

Abstract
We report a method to enrich cysteinyl adducts of human serum albumin (HSA)2, representing biomarkers of exposure to systemic electrophiles. Because the major site of HSA adduction is the single free sulfhydryl group at Cys34, we used thiol-affinity resins to remove mercaptalbumin (i.e., unadducted HSA) from the cysteinyl adducts. Electrospray ionization mass spectrometry was used to detect mercaptalbumin and HSA-Cys34 modifications before and after enrichment of HSA. Differences in adduct content were detected across samples of freshly-isolated, archived, and commercial HSA. Cysteinylated and glycosylated adducts were present in all samples with abundances decreasing in the order: commercial HSA > archived HSA > fresh HSA. After enrichment of HSA, mercaptalbumin was no longer observed in mass spectra. The ratio of HSA adducts post-/pre-enrichment, quantified via the Bradford assay and gel electrophoresis, was 0.029 mg adducts/mg HSA in fresh HSA and 0.323 mg adducts/mg HSA in archived HSA. The apparent elevation of adduct levels in archived samples could be due to differences in specimen preparation and storage, rather than to differences in circulating HSA adducts. We conclude that thiol-affinity resins can efficiently remove mercaptalbumin from HSA samples prior to characterization and quantitation of protein adducts of reactive systemic electrophiles.
Keywords: human serum albumin, biomarkers, adducts, enrichment, mass spectrometry
INTRODUCTION
It has been argued that biomarkers of exposure should be used in studies of the effects of toxic chemicals on human health [1]. Biomarkers can also provide a more precise estimate of internal dose, which increases the power to detect relationships between adverse health effects and causal agents [2]. However, because environmental toxicants are often chemically reactive electrophiles, their short life spans in vivo make them difficult to measure directly in biological media. This has motivated the use of stable adducts of these electrophiles with abundant blood proteins, notably hemoglobin and human serum albumin (HSA), as exposure biomarkers (reviewed by Tornqvist et al., [3] and Rubino et al., [4]). Stable adducts accumulate over the mean residence time of a protein and thereby reflect the integral of the blood level of the reactive species over, for example, 28 d for human serum albumin (HSA) and 60 d for hemoglobin. This makes protein adducts potentially more useful measures of exposure for retrospective epidemiologic studies than environmental measurements or short-term biomarkers, such as urinary metabolites or blood levels of parent compounds, which have residence times of hours or days [2].
Human serum albumin contains 35 cysteine residues, 34 of which are bound as intramolecular disulfides. Although the remaining cysteine, Cys34, has the only free sulfhydryl group in HSA, it represents the largest fraction of thiols in serum [5], where it has been estimated to account for approximately 80% of the antioxidant capacity [6; 7]. Within the tertiary protein structure of HSA, Cys34 resides in a unique microenvironment close to three ionizable residues: Asp38, His39, and Tyr84 [8]. As a result, Cys34 has an unusually low pKa (<6.7 compared to about 8.0 - 8.5 for thiols in most other proteins and peptides) and exists primarily in the highly nucleophilic thiolate form [8]. Examples of the many chemical species that form adducts with Cys34 include oxirane and quinone metabolites of benzene, naphthalene, and pentachlorophenol [9; 10; 11; 12; 13], nitrogen mustards [14], 4-hydroxy-trans-2-nonenal, 2-propenal, malondialdehyde, glyoxal, and other products of lipid peroxidation [15; 16; 17], metal ions such as Ag+, Hg2+, and Au+, and a host of drugs including auranofin, D-penicillamine, ethacrynate, and cisplatin (reviewed by [18]). Yet, although some HSA-Cys34 adducts have been detected in studies of humans, the analytical matrix is complex and the levels of individual adducts have been very low (less than one in a million unadducted protein molecules [4]). The combination of matrix effects plus low abundance has made it difficult to simultaneously measure numerous HSA adducts in samples of human serum or plasma and to identify unknown adducts.
Here we report a method to selectively enrich Cys34 adducts in fresh or archived samples of HSA. The enrichment approach takes advantage of the propensity of HSA containing unmodified Cys34 (mercaptalbumin) to bind with thiol-affinity resins [19]. Because adducted HSA is comprised primarily of small mixed-disulfides that exhibit reversible binding with HSA-Cys34, disulfide adducts were reduced to mercaptalbumin by dithiothreitol (DTT) prior to treatment with thiol-affinity resins. Using electrospray ionization (ESI) mass spectrometry, we characterized intact HSA from various sources and investigated the effects of reduction of mixed disulfides on the enrichment process. Enrichment was assessed both by mass spectrometry of the intact proteins and also by quantifying the amounts of HSA via the Bradford assay and gel electrophoresis before and after enrichment via thiol-affinity resins.
MATERIALS AND METHODS
Chemicals
Dithiothreitol (DTT), tris(2-carboxyethyl)phosphine (TCEP), iodoacetamide (IAA), phosphate buffered saline, Activated Thiol Sepharose 4B, sequence grade trypsin, sodium chloride, calcium chloride, ammonium sulfate, nitrogen, BioRad reagent dye, sodium dodecyl sulfate, BioSafe Coomassie G-250 dye (Bio-Rad, Hercules, CA), ammonium sulfate, Tris base, ProteasMAX, acetonitrile (Fisher Optima grade, 99.9%) and formic acid (Pierce, 1 ml ampoules, 99+%) were purchased from Fisher Scientific (Pittsburgh, PA). Commercial HSA was from Sigma (St. Louis, MO). Water was purified to a resistivity of 18.2 MΩ·cm (at 25 °C) using a Milli-Q Gradient ultrapure water purification system (Millipore, Billerica, MA).
Isolation of HSA
Four ml of whole blood were obtained from a healthy Asian volunteer subject (age = 34 y) by venipuncture in heparin. The blood was immediately centrifuged for 15 minutes at 3000 × g. The plasma layer was transferred to a 15-ml centrifuge tube, and saturated ammonium sulfate was added drop-wise to a final concentration of 60% ammonium sulfate. The plasma was vortexed briefly and centrifuged for 30 minutes at 3000 × g to pellet the precipitated protein. The supernatant, containing HSA, was transferred to 10-kDa molecular weight cutoff (MWCO) spin columns (Amicon Ultra-4, Millipore, Billerica, MA) and the protein was desalted using 5 x 15-ml volumes of deionized water. The isolated HSA was immediately aliquoted and frozen at -80°C. Archived HSA from 40 volunteer subjects (pooled and balanced from males/females, smokers/nonsmokers, and black/white subjects; 5 subjects per pool) had previously been isolated according to a similar protocol [20], which included dialysis to remove small molecules, lyophilization to constant weight, and dissolving the purified HSA in deionized water at 50 mg/ml. Archived samples were stored at -80°C prior to processing in the current study.
Mass Spectrometry of HSA
The heterogeneity of HSA with respect to Cys34-adduct status was evaluated in freshly isolated and archived HSA (described above), and commercial HSA from Sigma-Aldrich. Protein samples were analyzed using an Agilent 1200 series liquid chromatograph (LC; Santa Clara, CA) that was connected in-line with an LTQ Orbitrap XL hybrid mass spectrometer equipped with an Ion Max electrospray ionization (ESI) source (Thermo Fisher Scientific, Waltham, MA). The LC was equipped with C8 guard (Poroshell 300SB-C8, 5 μm, 12.5 × 2.1-mm, Agilent) and analytical (75 × 0.5-mm) columns and a 100-μl sample loop. Solvent A was 0.1% formic acid/99.9% water and solvent B was 0.1% formic acid/99.9% acetonitrile (v/v). For each sample, approximately 50 to 100 pmol of protein analyte was injected onto the column using an Agilent 1200 autosampler. Following sample injection, analyte trapping was performed for 5 min with 99.5% A at a flow rate of 90 3μ/min. The elution program consisted of a linear gradient from 25% to 95% B over 34 min, isocratic conditions at 95% B for 5 min, a linear gradient to 0.5% B over 1 min, and then isocratic conditions at 0.5% B for 14 min, at a flow rate of 90 μl/min. The column and sample compartments were maintained at 35 °C and 10 °C, respectively. Solvent (Milli-Q water) blanks were run between samples, and the autosampler injection needle was rinsed with Milli-Q water after each sample injection, to avoid cross-contamination between samples. The mass spectrometer ESI source parameters were as follows: ion transfer capillary temperature 275 °C, normalized sheath gas (nitrogen) flow rate 25%, ESI voltage 2.0 kV, ion transfer capillary voltage 33 V, and tube lens voltage 125 V. Positive-ion mass spectra were recorded over the range m/z = 500 to 2000 using the Orbitrap mass analyzer, in profile format, with full MS automatic gain control target settings of 3×10⁴ and 5×10⁵ charges for the linear ion trap and the Orbitrap, respectively, and an Orbitrap resolution setting of 6×10⁴ (at m/z = 400, FWHM). Raw mass spectra were processed using Xcalibur software (version 4.1, Thermo) and measured charge state distributions were deconvoluted using ProMass software (version 2.5 SR-1, Novatia, Monmouth Junction, NJ), using the default “large protein” parameters and a background subtraction factor of 1.5. Reproducibility of the measured masses of intact, adducted HSA proteins was within ± 3 Da (calculated from the repetitive measurements of the deconvoluted mass spectra of HSA samples over two weeks).
Reduction of HSA Mixed Disulfides
The efficiency of reducing small mixed disulfides bound to HSA-Cys34 was investigated with both DTT and TCEP. One-mg portions of commercial HSA were treated with one of 11 different concentrations of DTT or TCEP that ranged from equimolar to 270-fold molar excess, with reaction times ranging from 5 to 60 minutes. All experiments were conducted at room temperature in phosphate buffer, pH 7.4. Following protein reduction, samples were reacted with iodoacetamide (IAA), and the degree of reduction was assessed by monitoring the number of IAA additions (+57 Da per modification) above the measured mass of HSA (66,436±3 Da) [21; 22]. Reduction status was assessed before and after reduction using a LTQ Orbitrap XL hybrid mass spectrometer under the same MS conditions described above. Reduction conditions were considered optimal when they were stringent enough to reduce the Cys34-mixed disulfides while also preserving the intramolecular disulfide linkages.
For enrichment experiments, 2-mg portions of fresh HSA (n = 6) and 0.5-mg portions of pooled archived HSA (n = 16) were reduced using a 2.7-fold molar excess of DTT to release Cys34-bound mixed disulfides in 1-ml and 0.5-ml volumes, respectively. This concentration of DTT had been found to be optimal in preliminary experiments with commercial HSA (described above).
Using IAA-modified HSA as a Positive Control
IAA was reacted with HSA to create a Cys34 adduct that would serve as a positive control for the enrichment experiments. Commercial HSA was treated with a 2.7 molar excess of DTT and was reacted with 150 mM IAA in phosphate buffer, pH 7.4, at 37°C for 1 h. After removing excess IAA and buffer salts with a 10-kDa MWCO spin column, the fully-modified HSA was diluted with freshly isolated HSA to produce a starting solution containing 0.047 mg of the IAA-modified HSA per mg of HSA.
Using Thiol-affinity Resins to Remove Mercaptalbumin from HSA
A slurry containing a dry weight of either 250 mg (for fresh HSA) or 75 mg (for archived HSA) of Activated Thiol Sepharose 4B hydrated resin in degassed 4B binding buffer (100 mM Tris-HCl, 0.5 M NaCl, pH 7.4) was prepared in a ratio of 75% settled medium to 25% buffer. The slurry was transferred to a 1.5-ml polypropylene spin tube containing cellulose acetate membranes with a 0.22-μm pore size (Pierce Spin Cups, Thermo Scientific, Pittsburgh, PA). The reduced HSA starting solution, containing either fresh or archived HSA was added to the resin, mixed by vortexing, capped with nitrogen, and sealed with Parafilm®. After incubating at room temperature for 16 h on a rotary suspension mixer, the unbound proteins were removed from the thiol-affinity medium by centrifuging at 7000 rpm for 5 minutes. The flow-through fraction containing the HSA-Cys34 adducts was recovered.
Quantitation of Total Proteins and HSA
Electron ionization mass spectrometry was used to detect mercaptalbumin and HSA-Cys34 modifications before and after treatment of HSA with thiol-affinity resins. The total amounts of proteins in pre- and post-enrichment samples were determined in duplicate with the Bradford assay according to the standard microtiter plate protocol from the manufacturer (Bio-Rad, Hercules, CA) using commercial HSA for the standard curve. The purity of the isolated HSA was determined by sodium dodecyl sulfate-polyacrylamide gel electrophoresis (SDS-PAGE). Aliquots containing 10 μg of total protein in 10 μl of deionized water were mixed with 10 μl of 2X Laemmli sample buffer (Bio-Rad, Hercules, CA) containing 10% SDS and 5% β-mercaptoethanol and boiled for 10 min. The denatured samples and prestained molecular weight markers (Precision-Plus Protein Standards, Bio-Rad) were loaded on 4 – 20% polyacrylamide gradient gels (NuSep, Lawrenceville, GA) and separated at 100 V for one hour. The gels were stained with Bio-Safe Coomassie G-250 dye (Bio-Rad) and the relative concentrations of the various protein bands were determined by densitometry using an AlphaImager HP (Alpha Innotech, San Leandro, CA). The purity of HSA was expressed as the percentage of the sum of all protein bands.
Estimation of HSA-Cys34 Adduct Levels in HSA Samples
The HSA content of samples before and after removal of mercaptalbumin by thiol-affinity resins was quantified by measuring total proteins with the Bradford assay and gel electrophoresis (described above). After removal of mercaptalbumin, the protein content of post-enrichment samples reflected the quantity of adducted HSA-Cys34. Proportions of HSA adducts were, therefore, estimated as ratios of mean quantities of HSA after thiol-affinity treatment to those observed before treatment (mg adducts/mg HSA). For freshly-isolated HSA that had been spiked with IAA-modified HSA (positive control), this ratio was adjusted by subtracting the proportion of IAA adducts that had been added (0.047 mg IAA adducts/mg HSA).
Statistical Analysis
Adduct levels (mg Adducts/mg HSA) in samples of enriched HSA from archived specimens were analyzed with general linear models using Proc GLM of SAS (SAS for Windows v. 9.2, Cary, NC). Dummy variables were assigned for race (white or black), gender, and smoking status.
RESULTS AND DISCUSSION
Mass Spectrometry of HSA
Using LC-MS, we characterized intact HSA before and after enrichment of HSA-Cys34 adducts. The total ion chromatogram of freshly isolated HSA, given in Figure 1A, shows a major peak (labeled as ‘HSA’) followed by smaller peaks, representing other plasma proteins that were not precipitated by treatment with 60% ammonium sulfate. The raw ESI mass spectrum of HSA (Figure 1B) exhibits charge states 34+ through 66+.
Figure 1.
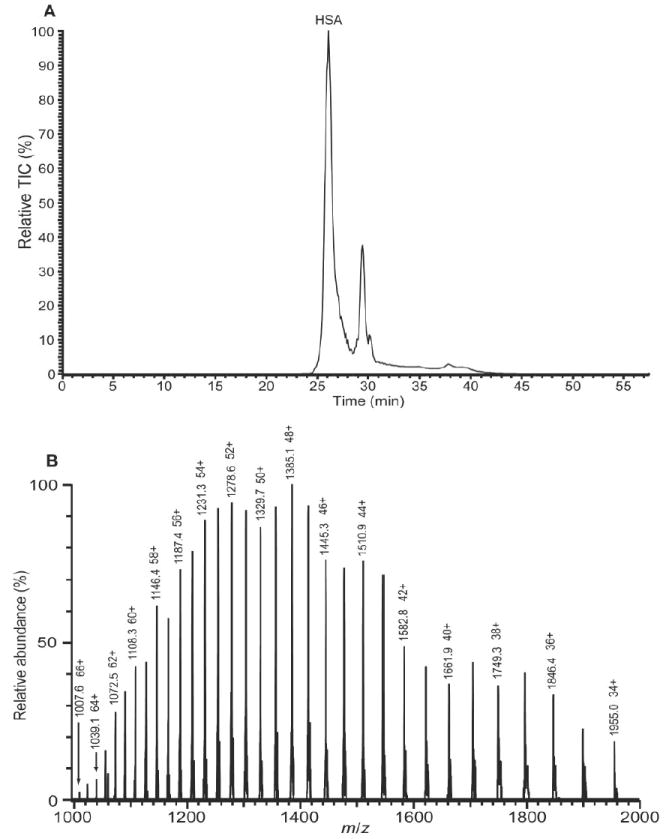
(A) LC-MS total ion chromatogram of freshly isolated HSA. The peak labeled HSA represents the HSA fraction of the plasma proteins after precipitation of immunoglobulins by treatment of plasma with 60% ammonium sulfate. (B) Raw ESI mass spectrum of the HSA fraction. (The deconvoluted mass spectrum is shown in Figure 2A.)
Heterogeneity of HSA
Human serum albumin is heterogeneous with respect to the thiol redox state, and exists in both the reduced and oxidized forms. The degree of HSA oxidation in vivo has been reported to increase with oxidative stress and various disease conditions, suggesting that HSA is an important scavenger of reactive systemic oxidants [23; 24]. However, after collection of blood specimens, Cys34 can be further oxidized during sample storage and processing. In particular, oxidation of Cys34 has been observed to initiate addition reactions with cysteine, and mixed disulfides [21; 24; 25; 26].
In this study, the degree of HSA-Cys34 modification was examined for three different HSA preparations: freshly isolated HSA, archived HSA, and commercial HSA. As shown in Figure 2, ESI mass spectrometry of the intact proteins points to different adduct profiles for these three sources of HSA. The spectrum of freshly isolated HSA (Figure 2A) was dominated by the mass corresponding to mercaptalbumin (66,436 Da), with a few lower abundance masses also observed, including one at 66,556 Da representing HSA+Cys (the cysteinylated product) and another at 66,599 Da, corresponding to HSA+Gluc (the glycosylated product). [Since the primary site for nonenzymatic glycosylation is Lys [27; 28], glycosylation should not preclude modifications of Cys34]. Commercial HSA contained the largest fraction of HSA+Cys, which was twice as abundant as mercaptalbumin (Figure 2B). The ESI mass spectrum of commercial HSA also showed less abundant masses at 66,473 Da, consistent with NO modification, and at 66,512 Da (modification unknown). In the archived HSA spectrum, mercaptalbumin was the most abundant species (Figure 2C) and prominent peaks corresponding to cysteinylation and glycosylation were observed at higher levels than in the fresh HSA sample.
Figure 2.
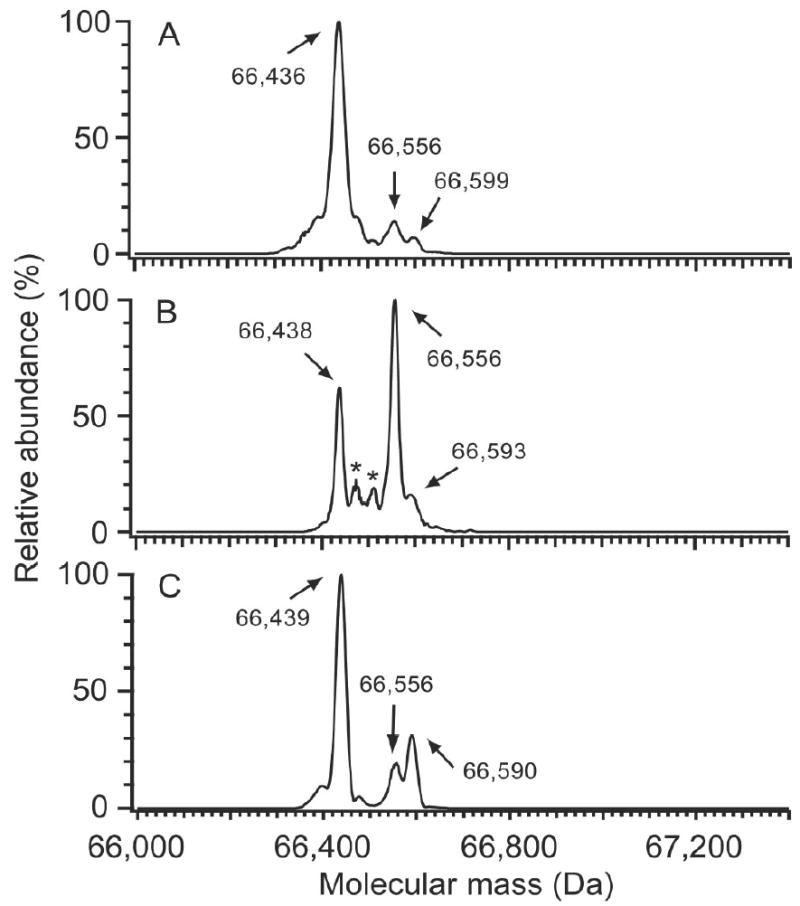
Deconvoluted ESI mass spectra showing heterogeneity of HSA from various sources. (A) Freshly isolated HSA; (B) commercial HSA, and (C) HSA stored at -80°C for 11 years. Mercaptalbumin (66,436 Da) is the most abundant species in fresh HSA (A), with minor peaks at 66,556 Da and 66,599 Da, corresponding to cysteinylation and glycosylation, respectively. Commercial HSA (B) was the most highly oxidized of the three HSA preparations. The most abundant modification was from cysteinylated (66,556 Da), with peaks at 66,473 and 66,593 Da consistent with the addition of NO and glucose, respectively. Archived HSA (C) displayed elevated cysteinylation (66,556 Da) and glycosylation (66,590 Da), and also contained an unknown abundant modification at 66,496 (+60) Da. The modification at 66,496 Da appears to be an irreversible modification at Cys34. The asterisks in (B) denote masses of 66,473 Da and 66,512 Da. (A representative LC-MS total ion chromatogram for the freshly isolated HSA sample is provided in Figure 1A. The raw mass spectrum of the HSA peak from the freshly isolated HSA sample is shown in Figure 1B.)
Reduction of HSA-Cys34 Mixed Disulfides
As indicated above, the most abundant modification on HSA-Cys34 was cysteinylation. Although cysteinylation was relatively minor in freshly isolated HSA (the 66,556 Da component in Figure 2A), higher levels of cysteinylated HSA were observed in the archived samples (66,556 Da; Figure 2C). As such, it is important to reduce HSA prior to treatment with thiol-affinity resins to achieve maximum enrichment of non-disulfide adducts.
We explored the reduction of mixed thiol disulfides using either DTT or TCEP at room temperature with 1-mg specimens of commercial HSA. Eleven different concentrations of DTT or TCEP were tested that ranged from a molar equivalent of reducing agent to 270-fold molar excess, with reaction times ranging from 5 to 60 minutes. The reaction time did not have a significant effect in any of the experiments using either TCEP or DTT (data not shown). Mass spectra from these experiments provide evidence that between two and five intramolecular disulfides were cleaved, corresponding to 5 – 11 IAA modifications, respectively; indeed, TCEP cleaved one intramolecular disulfide at the lowest (equimolar) concentration tested. In contrast, no intramolecular disulfides were broken with DTT at concentrations between 2.7-fold and 10.8-fold molar excess, indicating that Cys34 was the only cysteine residue reduced under these conditions.
As illustrated in Figure 3A, incubation of commercial HSA with a 2.7-fold molar excess of DTT effectively reduced Cys34-mixed disulfides, while preserving the intramolecular disulfide linkages. The most intense peak in the deconvoluted ESI mass spectrum was at 66,493 Da, corresponding to HSA with a single IAA modification. The mass in this spectrum at 66,654 Da is likely to be glycosylated HSA-Cys34-IAA while the minor peak at 66,559 Da is probably glycosylated mercaptalbumin [21]. The latter suggests that a small fraction of mercaptalbumin was not modified with IAA. The peak at 66,554 Da was also observed in spectra from HSA that had not been treated with IAA and is, therefore, unlikely to represent an IAA modification of HSA-Cys34. This peak (at 66,554 Da) could represent other covalent modifications of HSA-Cys34 that were not reduced with a 2.7-fold molar excess of DTT.
Figure 3.
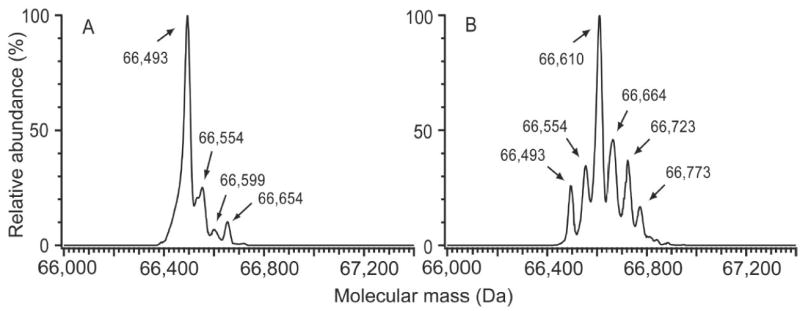
Reduction of commercial HSA using TCEP and DTT followed by reaction with IAA. Deconvoluted ESI mass spectra illustrate (A) optimal conditions using 2.7 molar excess DTT and (B) more stringent reduction conditions using 270 molar excess DTT. In spectrum A, peaks at 66,493, 66,599, and 66,654 Da correspond to HSA-Cys34-IAA, HSA-Gluc, and HSA-Cys34-IAA+Gluc, respectively. The peak at 66,554 Da is thought to represent a pool of unknown HSA-Cys34 adducts. In spectrum B, the series of ~57 Da mass additions indicate reduction of intramolecular disulfide linkages, with the addition of 2 IAA molecules representing a broken disulfide.
At a 27-fold molar excess of DTT, commercial HSA was modified with two additional IAA molecules, indicating one broken intramolecular disulfide. When DTT concentrations reached 270-fold excess, as shown in Figure 3B, a series of peaks was observed with masses close to those expected for addition products representing 1 to 5 IAA molecules to HSA. The respective observed and expected masses for these peaks, assuming a mass of 66,436 Da for free HSA, were as follows: 66,493 Da (1 IAA: +57 Da observed and expected), 66,554 Da (2 IAA: +118 Da observed vs. 114 Da expected), 66,610 Da (3 IAA: +174 Da observed vs. 171 expected), 66,664 (4 IAA: +228 Da observed and expected), and 66,723 Da (5 IAA: +287 Da vs. 285 Da expected). All of these observed masses are reasonable given our mass accuracy of ± 3 Da, with the possible exception of the peak at 66,554 Da which corresponds to a mass also observed without IAA treatment and, therefore, could represent a mixture of HSA with two IAA additions plus unknown HSA-Cys34 adducts. Although the last major peak in the mass spectrum, i.e., at 66,773 Da, could represent HSA with 6 IAA additions, the difference between observed and expected masses (6 IAA: +337 Da observed vs. 342 Da expected) is larger than our nominal mass accuracy.
Based on these results, a 2.7-fold molar excess of DTT was selected for reducing mixed disulfides without disrupting the intramolecular disulfide bridges. Reactions were performed at room temperature for 5 minutes. These reduction conditions are consistent with previous studies [29].
Qualitative Assessment of HSA-Cys34 Adduct Enrichment
Figure 4 shows the deconvoluted ESI mass spectra of HSA before and after enrichment of the Cys34 adducts with thiol-affinity resins. Three prominent peaks were observed in the pre-enrichment spectrum at 66,436, 66,556, and 66,599 Da, corresponding to HSA, HSA+Cys and HSA+Gluc, respectively, consistent with previous findings [21; 30]. After enrichment, three abundant peaks were observed in the spectrum at 66,493, 66,545, and 66,705 Da. The first peak at 66,493 (+57) Da corresponds to HSA-Cys34-IAA (positive control), which was not resolved in the pre-enrichment spectrum, where the starting concentration of HSA-Cys34-IAA was 0.047 mg/mg HSA. The most intense peak in the post-enrichment spectrum (Figure 4B) was at 66,545 Da, which corresponds to a mass addition of 109 Da. In the three-dimensional structure of HSA, the Cys34 residue resides in a cleft that is about 10 Å deep (He and Carter, 1992), which can sterically limit access to this residue by large electrophiles. It is therefore reasonable to expect Cys34 adducts that are of limited mass, i.e., in the range of 109 Da.
Figure 4.
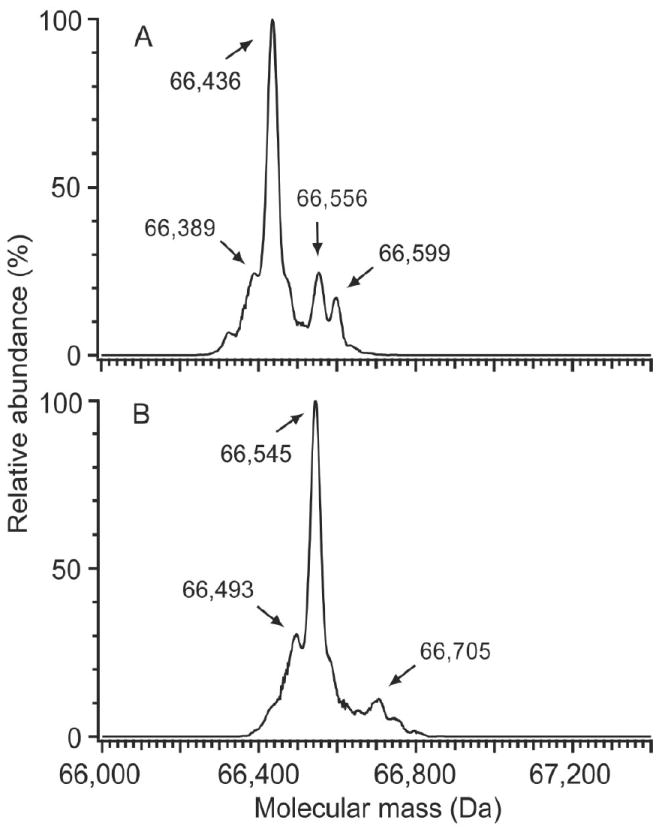
Deconvoluted ESI mass spectra of fresh HSA (A) before and (B) after treatment with thiol-affinity resins (0.047 mg/mg HSA-Cys34-IAA was added prior to enrichment as a positive control). In the pre-enrichment sample, (A), peaks were observed at 66,436, 66,556, and 66,599 Da, corresponding to mercaptalbumin, cysteinylated HSA, and glycosylated HSA, respectively. After enrichment, (B), a peak was observed at 66,493 Da for the HSA-Cys34-IAA positive control, which was not detected before enrichment. Peaks at 66,545 and 66,705 Da are thought to represent a pool of Cys34 and glycosylated Cys34 adducts, respectively. Note that no peak corresponding to unmodified HSA was observed after treatment with thiol-affinity resins.
A peak at 66,705 (66,545 + 160) Da was also observed in the post-enrichment spectrum. This probably represents the corresponding pool of N-linked glycosylated HSA-Cys34 adducts. Because all of the ions resolved in the post-enriched spectrum were adducted HSA-Cys34 species, it appears that treatment of HSA with thiol affinity resins effectively removed mercaptalbumin.
Quantitative Assessment of HSA-Cys34 before and after Enrichment
The amount of HSA in each sample was calculated using the Bradford assay to measure total protein, and SDS-PAGE to determine the purity of HSA. Gel-electrophoresis images are shown pre- and post-enrichment in Figure 5. Before treatment with thiol-affinity resins, the fresh HSA sample contained 70.6% HSA, and the archived HSA had a mean purity of 46.9% (SD 6.8). After treatment, the mean purity was 67.6% (SD 4.0) and 68.4% (SD 9.7) for the fresh and archived HSA, respectively. The archived HSA may have been altered during the isolation process (where dialysis and lyophilization were used) or may have degraded over time (11 y at -80°C), thus resulting in the observed lower HSA purity. Further work is needed to determine the effects of HSA isolation and storage on levels of HSA-Cys34 adducts and also to confirm adduct levels in fresh HSA from a large sample of subjects. After enrichment, the purity of the fresh and archived HSA specimens were similar, suggesting that the thiol-affinity resin removed the lower molecular weight contaminants from archived specimens of HSA.
Figure 5.

SDS-PAGE images of HSA before and after enrichment. Before enrichment (upper panel): fresh HSA is labeled as ID 1 and pooled archived HSA is labeled with IDs 2 - 9. After enrichment (lower panel): fresh HSA replicates are labeled with IDs 1.1 - 1.6 and pooled archived HSA specimens are labeled with IDs 2 - 9.
One fresh HSA specimen (sample 1.5 in Figure 5), and two of the pooled archived samples (one of the duplicates of samples 6 and 9 in Figure 5), were excluded from statistical analysis due to low volumetric and protein recoveries after treatment with thiol-affinity resins. The estimated mean adduct level for fresh HSA was 0.076 (SD 0.010) mg adducts/mg HSA after enrichment. When the amount of HSA-Cys34-IAA positive control (0.047 mg HSA-Cys34-IAA/mg HSA) was subtracted from this value, the mean adduct level was 0.029 mg adducts/mg HSA. The estimated mean adduct level in the archived specimens was 0.323 (SD 0.059) mg adducts/mg HSA, which was much higher than observed in freshly isolated HSA.
We used general linear models to investigate effects of race, gender, and smoking status on adduct levels in enriched specimens of archived HSA. Race (black vs. white) did not significantly affect adduct levels (P-value = 0.739) and was dropped from the model. The model with gender and smoking status explained 42.5% of the observed variation in adduct levels (i.e., R2 = 0.425) and produced the analysis of variance table shown in Table 2. After adjustment for gender, nonsmokers had significantly higher adduct levels than smokers (0.349 vs. 0.289 mg adducts/mg HSA; P-value = 0.0445) and after adjustment for smoking status, males had higher adduct levels than females, although the difference was not statistically significant (0.342 vs. 0.296 mg adducts/mg HSA; P-value = 0.1121) Since we expected to observe higher adduct levels in smoking subjects compared to control subjects, interpretation of the apparent increase in adduct levels among nonsmokers must await information about the identities of the particular adducts involved. In any case, these results should be regarded as very preliminary due to the small numbers of HSA samples in our analyses.
Table 2.
Analysis of Variance Table for the Effects of Gender and Smoking Status on Adduct Levels (mg adducts/mg HSA) in Enriched Specimens of Archived HSA.
| Source | DF | Sum of Squares | Mean Square | F Value | Pr > F | |
|---|---|---|---|---|---|---|
| Model | 2 | 0.01941218 | 0.00970609 | 4.06 | 0.0477 | |
| Error | 11 | 0.02628243 | 0.00238931 | |||
| Corrected Total | 13 | 0.04569461 | ||||
| Source | DF | Sum of Squares | Mean Square | F Value | Pr > F | |
| Gender | 1 | 0.00712637 | 0.00712637 | 2.98 | 0.1121 | |
| Smoking status | 1 | 0.01228582 | 0.01228582 | 5.14 | 0.0445 | |
Enriched HSA Adducts as Biomarkers of Exposure
As noted in the introduction, protein adducts can serve as biomarkers of exposure to a host of xenobiotic toxicants and reactive endogenous species [3; 4]. However, because the levels of protein adducts are small compared to the unmodified proteins, they are difficult to detect and identify without prior enrichment. By removing mercaptalbumin (i.e., unadducted HSA) with thiol-affinity resins, we obtained protein fractions consisting largely of HSA molecules that had been adducted at the HSA-Cys34 locus. Since HSA-Cys34 is the most nucleophilic and one of the most abundant reaction sites in serum, the method should be useful for characterizing adducts of important reactive electrophiles in the blood. Since the ultimate goal of our research is to identify unknown HSA-Cys34 adducts in tryptic digests of fresh and archived specimens of human plasma, the successful enrichment of such adducts is clearly important.
Based upon measurements of total proteins before and after enrichment of HSA, we observed about 10 times higher levels of non-disulfide adducts in archived specimens of HSA compared to fresh HSA (Table 1). This points to the possibility that HSA-Cys34 had been modified during either isolation or storage (11 y at -80°C), or both. Because archived specimens will often be used to characterize adduct levels associated with chemical exposures, it is important to determine the exact nature of modifications to HSA-Cys34 that occur during isolation and storage.
Table 1.
Amounts of Human Serum Albumin (HSA) Measured after Enrichment in Fresh and Archived Samples. (HSA-Cys34 adducts are represented by the amounts of HSA after enrichment via treatment with thiol-affinity resins).
| Subject or Pool | Type of HSA | Smoker | Gender | Race | HSA. (mg) | Adducts (mg/mg HSA)a |
|---|---|---|---|---|---|---|
| 1 | Fresh | No | M | A | 1.41 | 0.079 b |
| 1 | Fresh | No | M | A | 1.41 | 0.065 b |
| 1 | Fresh | No | M | A | 1.41 | 0.071 b |
| 1 | Fresh | No | M | A | 1.41 | 0.074 b |
| 1 | Fresh | No | M | A | 1.41 | 0.091 b |
| 2 | Archived | No | F | B | 0.262 | 0.357 |
| 2 | Archived | No | F | B | 0.262 | 0.295 |
| 3 | Archived | No | F | W | 0.212 | 0.304 |
| 3 | Archived | No | F | W | 0.212 | 0.278 |
| 4 | Archived | No | M | W | 0.214 | 0.331 |
| 4 | Archived | No | M | W | 0.214 | 0.346 |
| 5 | Archived | No | M | W | 0.184 | 0.460 |
| 5 | Archived | No | M | W | 0.184 | 0.419 |
| 6 | Archived | Yes | F | B | 0.274 | 0.296 |
| 7 | Archived | Yes | F | W | 0.264 | 0.259 |
| 7 | Archived | Yes | F | W | 0.264 | 0.315 |
| 8 | Archived | Yes | M | B | 0.261 | 0.305 |
| 8 | Archived | Yes | M | B | 0.261 | 0.321 |
| 9 | Archived | Yes | M | W | 0.208 | 0.237 |
Legend: M=male, F=female, A=Asian, B=black, W=white.
HSA measured after treatment with thiol-affinity resins.
Includes 0.047 mg IAA-HSA/mg HSA (positive control).
Acknowledgments
The authors declare that they have no competing financial interests. They appreciate the help of Suramya Waidyanatha, Ioana Popa, Karen Yeowell-O’Connell and Katherine Hoag, who had isolated HSA from plasma in the study that provided the archived specimens. The authors also appreciate the helpful comments of Michael Goshe, Avram Gold, and Louise Ball, who read an early draft of the manuscript.
Footnotes
Financial support for this work was provided by grant U54ES016115 from the U.S. National Institute for Environmental Health Sciences (NIEHS) through the trans-NIH Genes, Environment and Health Initiative and by NIEHS training grant T32ES07018. The content is solely the responsibility of the authors and does not necessarily represent the official view of the National Institute of Environmental Health Sciences or the National Institutes of Health.
abbreviations: DTT, dithiothreitol; ESI, electrospray ionization; HSA, human serum albumin; HSA+Cys, cysteinylated HSA; HSA+Gluc, glycosylated HSA; IAA, iodoacetamide; LC, liquid chromatography; MWCO, molecular-weight cutoff; MS, mass spectrometry; SD, standard deviation; SDS-PAGE, sodium dodecylsulfate-polyacrylamide gel electrophoresis; TCEP, tris(2-carboxyethyl)phosphine
Publisher's Disclaimer: This is a PDF file of an unedited manuscript that has been accepted for publication. As a service to our customers we are providing this early version of the manuscript. The manuscript will undergo copyediting, typesetting, and review of the resulting proof before it is published in its final citable form. Please note that during the production process errors may be discovered which could affect the content, and all legal disclaimers that apply to the journal pertain.
References
- 1.Wild CP. Environmental exposure measurement in cancer epidemiology. Mutagenesis. 2009;24:117–25. doi: 10.1093/mutage/gen061. [DOI] [PMC free article] [PubMed] [Google Scholar]
- 2.Lin YS, Kupper LL, Rappaport SM. Air samples versus biomarkers for epidemiology. Occup Environ Med. 2005;62:750–60. doi: 10.1136/oem.2004.013102. [DOI] [PMC free article] [PubMed] [Google Scholar]
- 3.Tornqvist M, Fred C, Haglund J, Helleberg H, Paulsson B, Rydberg P. Protein adducts: quantitative and qualitative aspects of their formation, analysis and applications. J Chromatogr B Analyt Technol Biomed Life Sci. 2002;778:279–308. doi: 10.1016/s1570-0232(02)00172-1. [DOI] [PubMed] [Google Scholar]
- 4.Rubino FM, Pitton M, Di Fabio D, Colombi A. Toward an “omic” physiopathology of reactive chemicals: Thirty years of mass spectrometric study of the protein adducts with endogenous and xenobiotic compounds. Mass Spectrom Rev. 2009;28:725–784. doi: 10.1002/mas.20207. [DOI] [PubMed] [Google Scholar]
- 5.Fabisiak JP, Sedlov A, Kagan VE. Quantification of oxidative/nitrosative modification of CYS(34) in human serum albumin using a fluorescence-based SDS-PAGE assay. Antioxid Redox Signal. 2002;4:855–65. doi: 10.1089/152308602760599016. [DOI] [PubMed] [Google Scholar]
- 6.Marjolaine R, Rondeau P, Singh NR, Tarnus E, Bourdon E. The antioxidant properties of serum albumin. Federation of European Biochemical Society. 2008;582:1783–1787. doi: 10.1016/j.febslet.2008.04.057. [DOI] [PubMed] [Google Scholar]
- 7.Ogasawara Y, Mukai Y, Togawa T, Suzuki T, Tanabe S, Ishii K. Determination of plasma thiol bound to albumin using affinity chromatography and high-performance liquid chromatography with fluorescence detection: ratio of cysteinyl albumin as a possible biomarker of oxidative stress. J Chromatogr B Analyt Technol Biomed Life Sci. 2007;845:157–63. doi: 10.1016/j.jchromb.2006.08.006. [DOI] [PubMed] [Google Scholar]
- 8.Stewart AJ, Blindauer CA, Berezenko S, Sleep D, Tooth D, Sadler PJ. Role of Tyr84 in controlling the reactivity of Cys34 of human albumin. FEBS J. 2005;272:353–62. doi: 10.1111/j.1742-4658.2004.04474.x. [DOI] [PubMed] [Google Scholar]
- 9.Yeowell-O’Connell K, Rothman N, Smith MT, Hayes RB, Li G, Waidyanatha S, Dosemeci M, Zhang L, Yin S, Titenko-Holland N, Rappaport SM. Hemoglobin and albumin adducts of benzene oxide among workers exposed to high levels of benzene. Carcinogenesis. 1998;19:1565–71. doi: 10.1093/carcin/19.9.1565. [DOI] [PubMed] [Google Scholar]
- 10.Waidyanatha S, Sangaiah R, Rappaport SM. Characterization and quantification of cysteinyl adducts of benzene diol epoxide. Chem Res Toxicol. 2005;18:1178–85. doi: 10.1021/tx0500981. [DOI] [PubMed] [Google Scholar]
- 11.Waidyanatha S, Rothman N, Li G, Smith MT, Yin S, Rappaport SM. Rapid determination of six urinary benzene metabolites in occupationally exposed and unexposed subjects. Anal Biochem. 2004;327:184–99. doi: 10.1016/j.ab.2004.01.008. [DOI] [PubMed] [Google Scholar]
- 12.Waidyanatha S, Lin PH, Rappaport SM. Characterization of chlorinated adducts of hemoglobin and albumin following administration of pentachlorophenol to rats. Chem Res Toxicol. 1996;9:647–53. doi: 10.1021/tx950172n. [DOI] [PubMed] [Google Scholar]
- 13.Tsai CH, Lin PH, Waidyanatha S, Rappaport SM. Fractionation of protein adducts in rats and mice dosed with [14C]pentachlorophenol. Arch Toxicol. 2002;76:628–33. doi: 10.1007/s00204-002-0394-y. [DOI] [PubMed] [Google Scholar]
- 14.Noort D, Hulst AG, Jansen R. Covalent binding of nitrogen mustards to the cysteine-34 residue in human serum albumin. Arch Toxicol. 2002;76:83–8. doi: 10.1007/s00204-001-0318-2. [DOI] [PubMed] [Google Scholar]
- 15.Aldini G, Gamberoni L, Orioli M, Beretta G, Regazzoni L, Maffei Facino R, Carini M. Mass spectrometric characterization of covalent modification of human serum albumin by 4-hydroxy-trans-2-nonenal. J Mass Spectrom. 2006;41:1149–61. doi: 10.1002/jms.1067. [DOI] [PubMed] [Google Scholar]
- 16.Aldini G, Dalle-Donne I, Colombo R, Maffei Facino R, Milzani A, Carini M. Lipoxidation-derived reactive carbonyl species as potential drug targets in preventing protein carbonylation and related cellular dysfunction. ChemMedChem. 2006;1:1045–58. doi: 10.1002/cmdc.200600075. [DOI] [PubMed] [Google Scholar]
- 17.Aldini G, Regazzoni L, Orioli M, Rimoldi I, Facino RM, Carini M. A tandem MS precursor-ion scan approach to identify variable covalent modification of albumin Cys34: a new tool for studying vascular carbonylation. J Mass Spectrom. 2008;43:1470–81. doi: 10.1002/jms.1419. [DOI] [PubMed] [Google Scholar]
- 18.Kragh-Hansen U, Chuang VT, Otagiri M. Practical aspects of the ligand-binding and enzymatic properties of human serum albumin. Biol Pharm Bull. 2002;25:695–704. doi: 10.1248/bpb.25.695. [DOI] [PubMed] [Google Scholar]
- 19.Haugen DA. Charge-shift strategy for isolation of hemoglobin-carcinogen adducts formed at the beta 93 cysteine sulfhydryl groups. Chem Res Toxicol. 1989;2:379–85. doi: 10.1021/tx00012a005. [DOI] [PubMed] [Google Scholar]
- 20.Lin YS, McKelvey W, Waidyanatha S, Rappaport SM. Variability of albumin adducts of 1,4-benzoquinone, a toxic metabolite of benzene, in human volunteers. Biomarkers. 2006;11:14–27. doi: 10.1080/13547500500382975. [DOI] [PubMed] [Google Scholar]
- 21.Beck JL, Ambahera S, Yong SR, Sheil MM, de Jersey J, Ralph SF. Direct observation of covalent adducts with Cys34 of human serum albumin using mass spectrometry. Anal Biochem. 2004;325:326–36. doi: 10.1016/j.ab.2003.10.041. [DOI] [PubMed] [Google Scholar]
- 22.Kleinova M, Belgacem O, Pock K, Rizzi A, Buchacher A, Allmaier G. Characterization of cysteinylation of pharmaceutical-grade human serum albumin by electrospray ionization mass spectrometry and low-energy collision-induced dissociation tandem mass spectrometry. Rapid Commun Mass Spectrom. 2005;19:2965–73. doi: 10.1002/rcm.2154. [DOI] [PubMed] [Google Scholar]
- 23.Turell L, Carballal S, Botti H, Radi R, Alvarez B. Oxidation of the albumin thiol to sulfenic acid and its implications in the intravascular compartment. Braz J Med Biol Res. 2009;42:305–11. doi: 10.1590/s0100-879x2009000400001. [DOI] [PubMed] [Google Scholar]
- 24.Kawakami A, Kubota K, Yamada N, Tagami U, Takehana K, Sonaka I, Suzuki E, Hirayama K. Identification and characterization of oxidized human serum albumin. A slight structural change impairs its ligand-binding and antioxidant functions. FEBS J. 2006;273:3346–57. doi: 10.1111/j.1742-4658.2006.05341.x. [DOI] [PubMed] [Google Scholar]
- 25.Sengupta S, Chen H, Togawa T, DiBello PM, Majors AK, Budy B, Ketterer ME, Jacobsen DW. Albumin thiolate anion is an intermediate in the formation of albumin-S-S-homocysteine. J Biol Chem. 2001;276:30111–7. doi: 10.1074/jbc.M104324200. [DOI] [PubMed] [Google Scholar]
- 26.Ogasawara Y, Namai T, Togawa T, Ishii K. Formation of albumin dimers induced by exposure to peroxides in human plasma: a possible biomarker for oxidative stress. Biochem Biophys Res Commun. 2006;340:353–8. doi: 10.1016/j.bbrc.2005.11.183. [DOI] [PubMed] [Google Scholar]
- 27.Shaklai N, Garlick RL, Bunn HF. Nonenzymatic glycosylation of human serum albumin alters its conformation and function. J Biol Chem. 1984;259:3812–7. [PubMed] [Google Scholar]
- 28.Kisugi R, Kouzuma T, Yamamoto T, Akizuki S, Miyamoto H, Someya Y, Yokoyama J, Abe I, Hirai N, Ohnishi A. Structural and glycation site changes of albumin in diabetic patient with very high glycated albumin. Clin Chim Acta. 2007;382:59–64. doi: 10.1016/j.cca.2007.04.001. [DOI] [PubMed] [Google Scholar]
- 29.Aldini G, Vistoli G, Regazzoni L, Gamberoni L, Facino RM, Yamaguchi S, Uchida K, Carini M. Albumin is the main nucleophilic target of human plasma: a protective role against pro-atherogenic electrophilic reactive carbonyl species? Chem Res Toxicol. 2008;21:824–35. doi: 10.1021/tx700349r. [DOI] [PubMed] [Google Scholar]
- 30.Bar-Or D, Bar-Or R, Rael LT, Gardner DK, Slone DS, Craun ML. Heterogeneity and oxidation status of commercial human albumin preparations in clinical use. Crit Care Med. 2005;33:1638–41. doi: 10.1097/01.ccm.0000169876.14858.91. [DOI] [PubMed] [Google Scholar]