Abstract
To better define the role of glutathione (GSH) in cell differentiation, the present study measured GSH concentrations during terminal HL-60 cell differentiation, in the presence and absence of differentiation-inducing agents, and in the presence and absence of GSH altering agents. Interestingly, there was a small transient increase in intracellular GSH levels during dimethyl sulfoxide (DMSO) or 1α,25-dihydroxyvitamin D3 (VD3) induced differentiation. This increase coincided with an increase in nitroblue tetrazolium (NBT) reduction capacity, a measure of superoxide anion production, but there was no apparent change in the GSH/glutathione disulfide (GSSG) ratio. Surprisingly, treatment of cells with low doses of 1-chloro-2,4-dinitrobenzene (CDNB; 5 µM) or diethylmaleate (DEM; 0.5 mM), which transiently deplete GSH levels to about 40% of control levels, resulted in enhanced differentiation of HL-60 cells exposed to VD3 or all-trans-retinoic acid (ATRA), as well as under un-induced conditions (i.e., spontaneous differentiation). Enhanced differentiation occurred when cells were treated with the GSH-depleting agents 4 hours after treatment with differentiation inducers. These findings indicate that intracellular GSH levels are regulated in a complex fashion during HL-60 cell differentiation, and that transient GSH depletion using low doses of CDNB and DEM enhances the differentiation process.
Key words: glutathione, cell differentiation, thiol levels, vitamin D3, all-trans retinoic acid, NADPH oxidase, N-acetylcysteine
Introduction
Cell differentiation is an intrinsically complex process that is regulated by diverse transcriptional pathways and epigenetic modifications.1–6 These signaling pathways stimulate coordinated changes in the expression of hundreds of genes in precise response to specific environmental signals. Because of the critical importance of cell differentiation to organism and tissue development and to cellular specialization, abnormal differentiation is directly linked to many human diseases, including cancer, neurodegenerative diseases, inflammatory diseases, viral infections and heart diseases.1–6
Interestingly, abnormal glutathione (GSH) homeostasis has also been reported in these same disease states, although there is as yet no direct link between the changes in GSH levels and either the altered cell differentiation or the etiology of these diseases. 7,8 Because GSH is involved in a multitude of biochemical pathways and cellular processes, changes in GSH levels simultaneously impact all of these processes, and thus it has been difficult to establish cause and effect relationships.8 Nevertheless, there is now growing evidence that reactive oxygen species function as intracellular messengers for cell growth and differentiation,9–19 and that GSH levels and thiol redox state modulate both reactive species availability, and cell growth and differentiation,20–43 although the specific mechanisms and pathways involved remain largely undefined. There are many redox sensitive transcription factors, including Nrf2, AP-1, c-Jun, Bach1, NFκB, IKKβ subunit, interferon regulatory factor 3, p53 and Pax-8,8 and each of these may contribute to the effects of the reactive oxygen species on cell differentiation. In particular, there is now growing evidence that Keap1-Nrf2 activation can alter differentiation outcome; however, the effects vary from stimulation to inhibition of differentiation depending on the cell type and the chemical properties and dose of the stimulus used to modulate Nrf2.27,39,40,44–54
Previous studies that have examined the role of GSH on cell differentiation have shown that extreme and sustained GSH depletion prior to the induction of differentiation markedly impairs the process.23–28 However, it is important to consider both the extent and timing of depletion when making conclusions concerning the effects of GSH on differentiation. In order to better understand the significance of GSH homeostasis during differentiation, the present study measured intracellular GSH levels during the differentiation process, as well as the effects of a more moderate GSH depletion on the differentiation process. In addition, to distinguish the temporal sequence of events, GSH depletion was initiated several hours after the addition of the differentiation-inducing stimulus. The studies were performed in HL-60 cells, a cell line originally isolated from an acute promyelocytic leukemia patient,55 which are a well-characterized model for studying terminal differentiation events. HL-60 cells can mature into neutrophils upon exposure to dimethyl sulfoxide (DMSO)56,57 or all-trans-retinoic acid (ATRA),58 or to monocytes upon exposure to 1α,25-dihydroxyvitamin D3 (VD3).59 This feature has been exploited to identify the common characteristics as well as the unique mechanisms involved in neutrophilic, monocytic, and eosinphilic maturation. Additionally, HL-60 cells retain the ability to spontaneously differentiate in culture (maturation in the absence of a differentiation inducer).55 This feature can be utilized experimentally to identify factors that are capable of enhancing or preventing normal terminal differentiation.
The present results demonstrate that GSH levels are dynamic during HL-60 differentiation, and that treatment with relatively low concentrations of 1-chloro-2,4-dinitrobenzene (CDNB) and diethylmaleate (DEM) results in enhanced differentiation. Taken together, these finding provide additional evidence that intracellular GSH levels play a role in determining differentiation outcomes, and that it may thus contribute to conditions and disease states characterized by abnormal differentiation.
Results
There is a small, transient increase in intracellular GSH levels during both granulocytic and monocytic terminal HL-60 cell differentiation.
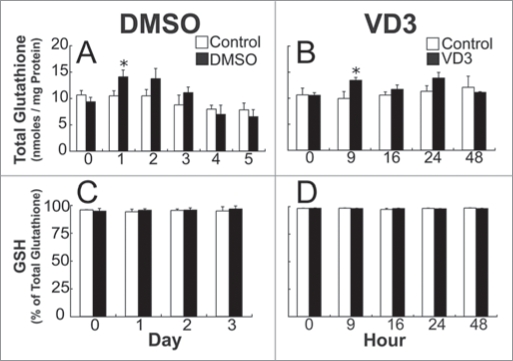
To examine whether intracellular GSH levels change during terminal cell differentiation, HL-60 cells were treated with DMSO, a granulocytic differentiation inducer, and GSH and GSSG levels were measured at various time points (Fig. 1). Glutathione levels remained relatively constant in control cells; however, the levels in DMSO-treated HL-60 cells were slightly higher at the 1-day time point (Fig. 1A). There was no measurable change in the percent of GSSG or reduced GSH (Fig. 1C), suggesting that the transient increase in GSH is due to an increase in total glutathione and not GSH or GSSG alone.
Figure 1.
A transient increase in glutathione occurs during DMSO, and VD3-induced Hl-60 differentiation. Total glutathione content (nanomoles/mg protein) in control cells, and those treated with 1.5% DMSO at 0, 1, 2, 3, 4 and 5 days of culture (A), or with 500 nM VD3 cells at 0, 9, 16, 24 and 48 hours of culture (B). Reduced glutathione (% of total glutathione) was determined for control, DMSO (C), and VD3-treated HL-60 cells (D). Samples were assayed in triplicate, and data are represented as mean ± S.E. of five to six experiments (A and B), and three experiments (C and D). Statistical significance is expressed as *p < 0.05 versus control values.
Because DMSO induces HL-60 cells to mature into neutrophils, it was important to examine whether this transient increase in GSH was specific for this pathway. To test this possibility, cells were treated with 500 nM VD3, which induces maturation into monocyte-like cells, and were collected at various times for analysis of total glutathione levels (Fig. 1B). As expected, glutathione levels remained relatively constant in control cells. In VD3-treated cells, glutathione levels were slightly higher at 9 h after VD3 exposure (Fig. 1B), but were comparable to controls at the other time points. As with the DMSO-treated cells, there was no change in the percent of GSSG or GSH (Fig. 1D) at the time points tested. Taken together these data suggest that a small transient increase in GSH is a feature of HL-60 maturation.
The transient increase in glutathione precedes changes in CD11b expression and cell cycle distribution, but coincides with an increase in NBT reduction capacity.
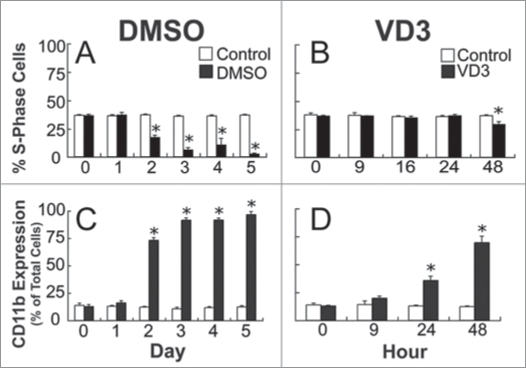
To elucidate the timing of this transient increase in glutathione in relation to differentiation marker expression, differentiation markers were assessed following DMSO and VD3 exposure. Because, cells that have differentiated exit the cell cycle, one way to identify the time when HL-60 cells are beginning to differentiate is to look at a time course of cell cycle distribution after treatment with differentiation inducers. A decrease in S-phase (Fig. 2A and B) and an increase in G1-phase cells (data not shown) occurred 48 hours after exposure to DMSO or VD3. There were no differences in cell cycle distribution between cells induced to differentiate and controls at the 1-day, and 9-hour time points, where the increase in GSH was observed.
Figure 2.
The transient increase in glutathione precedes changes in S-phase cell cycle distribution and CD11b expression. S-phase cell cycle distribution was assessed after 0, 1, 2, 3, 4 and 5 days of DMSO exposure (A), and 0, 9, 16, 24 and 48 hours of VD3 exposure (B). Total CD11b cell surface marker expression was measured in HL-60 cells after 0, 1, 2, 3, 4 and 5 days of 1.5% DMSO exposure (C), and 0, 9, 24 and 48 hours of 500 nM VD3 treatment (D). Data are represented as mean ± S.E. of three to four experiments. Statistical significance is expressed as *p < 0.05 versus control values.
As HL-60 cells mature, changes in cell surface marker expression occur, including increases in CD11b and decreases in CD71. An increase in CD11b marker expression occurred 2 days and 24 hours after DMSO and VD3 exposure, respectively (Fig. 2C and D). A decrease in CD71 expression also occurred 24 hours after VD3 treatment (data not shown). In DMSO-treated cells there was a decrease in CD71 expression at 1 day after exposure, followed by a dramatic decrease 2 days after exposure (data not shown). These data reveal that the transient increase in intracellular GSH precedes the shift in CD11b expression, but may coincide with CD71 expression in the case of DMSO-induction.
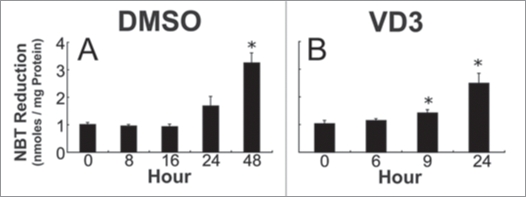
As HL-60 cells differentiate, superoxide anion production, a result of upregulated NADPH oxidase activity, also increases,57,60 and this was supported by the results of the NBT assay (Fig. 3). An increase in NBT reduction capacity first became apparent at the 24-hour time point after DMSO treatment, but was not statistically different until the 48 h time point (Fig. 3A). There was an increase in NBT reduction activity in VD3-treated HL-60 cells at the 9 h time point (Fig. 3B), suggesting that there is an increase in NADPH oxidase activity that occurs roughly at the same time as the increase in intracellular glutathione levels, and that continues to increase with time. One possible interpretation for these observations is that the initial increase in NADPH oxidase-produced reactive intermediates stimulates increased production and/or retention of cellular GSH, and that GSH values then return to normal after accommodation to the progressive increase in NADPH oxidase activity.
Figure 3.
NBT reduction capacity during DMSO and VD3-induced HL-60 differentiation. NBT reduction capacity in HL-60 cells after 0, 8, 16, 24 and 48 hours of DMSO exposure (A), and after 0, 6, 9 and 24 hours of VD3 treatment (B). Data are represented as mean ± S.E. of three experiments. Statistical significance is expressed as *p < 0.05 versus control values.
Treatment with GSH depletors augments HL-60 cell differentiation marker expression.
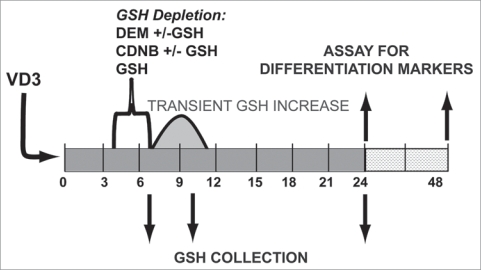
To further define the role of GSH in HL-60 differentiation, cells were depleted of GSH and differentiation marker expression was assessed. To more selectively investigate the importance of the transient increase in GSH during early maturation, GSH depleting agents were added just prior to the anticipated transient increase. Cells were treated with relatively low levels of GSH-altering agents for a period of 3 h to create a moderate and transient depletion of GSH early in differentiation (Fig. 4). The agents used to deplete GSH were 1-chloro-2,4-dinitrobenzene (CDNB; 5 µM) and diethylmaleate (DEM; 0.5 mM). Both of these compounds are excellent substrates for the glutathione S-transferases, allowing for a rapid GSH depletion, whereas the spontaneous (i.e., non-enzymatic) reaction of CDNB or DEM with GSH or other cellular thiols is comparatively slow under these conditions.61 Because the goal of these studies was to rapidly deplete cellular GSH levels, it was not possible to use the GSH synthesis inhibitor L-buthionine sulfoximine (BSO), which depletes GSH levels relatively slowly.
Figure 4.
Experimental design of GSH depletion experiments during induced HL-60 cell differentiation. HL-60 cells were incubated with GSH depleting agents, 0.5 mM DEM or 0.5 µM CDNB, either with or without 5 mM GSH. Treatment occurred during differentiation, after exposure to maturation agents, but before the transient increase in GSH observed after VD3 treatment. Cells were collected for GSH analysis 3, 6 and 20 hours after the initial incubation with GSH-altering agents. NBT reduction was analyzed at 24 hours, and cell cycle and cell surface marker expression 48 hours after exposure to differentiation inducers, 500 nM VD3 or 500 nM ATRA.
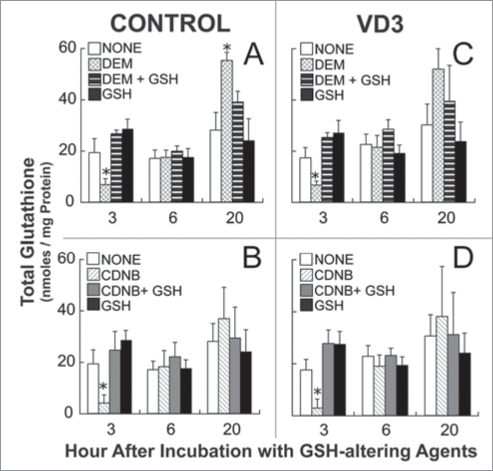
At approximately 3 hours after incubation with 0.5 mM DEM, intracellular GSH levels were approximately 40% of controls in both uninduced and VD3-treated cells (Fig. 5A and C). At 6 hours after DEM incubation, GSH returned to control levels, and 20 hours later it was higher in DEM-treated samples (Fig. 5A and C). This increase in GSH levels 20 hours after DEM treatment suggests that GSH is upregulated in response to the depletion that occurred earlier. Similar results were observed in cells treated with 5 µM CDNB, although no significant increase in glutathione occurred after 20 hours of CDNB treatment (Fig. 5B and D). The addition of 5 mM GSH to the culture medium modulated the effects of DEM and CDNB treatment at all time points. These effects of the exogenous GSH are likely explained both by the ability of this added GSH to react slowly with the DEM or CDNB in the culture medium, thus lowering the effective doses to the cells, and its ability to sustain intracellular GSH levels under these experimental conditions (Fig. 5).
Figure 5.
Total glutathione levels in control and VD3-induced HL-60 cells after DEM, and CDNB treatment. Control cells were incubated with either 0.5 mM DEM (A) or 5 µM CDNB (B), in the presence or absence of 5 mM GSH for a 3 hour period. HL-60 cells were treated with 500 nM VD3, and 4 hours later cells were incubated with either 0.5 mM DEM (C) or 5 μM CDNB (D) for 3 hours, in the presence or absence of 5 mM GSH. Cells were collected 3, 6 and 20 hours after treatment with GSH-altering agents for analysis of total intracellular glutathione levels. Samples were analyzed in triplicate for each experiment. Data are represented as mean ± S.E. of three experiments. Statistical significance is expressed as *p < 0.05 versus control values.
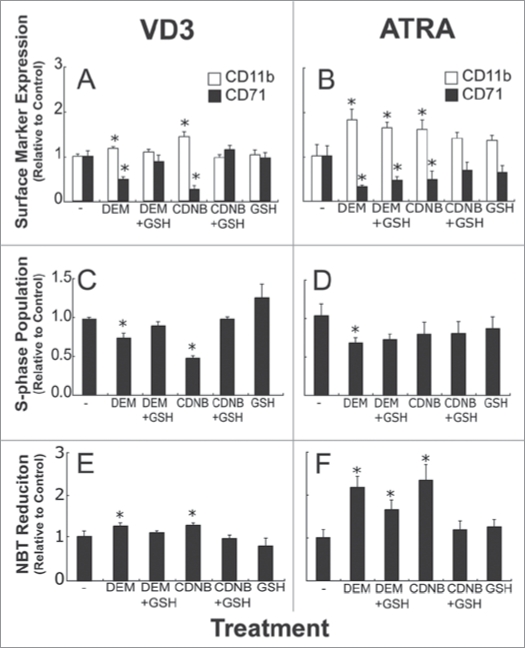
The effects of GSH depletion on cell surface marker expression were assessed in HL-60 cells treated with two different differentiation inducers, VD3 and ATRA (Fig. 6). VD3-exposed cells treated with DEM or CDNB had higher CD11b expression and lower CD71 expression at 48 hours after treatment (Fig. 6A). Comparable trends were observed for ATRA-induced HL-60 cells upon treatment with GSH-depleting agents (Fig. 6B), indicating that moderate GSH depletion with DEM or CDNB enhances cell surface marker expression associated with the differentiated HL-60 phenotype. Note that GSH supplementation largely prevented the effects of DEM and CDNB in VD3-treated cells (Fig. 6A), but it had small effects in ATRA-treated cells (Fig. 6B). The reason for this is not known, but may be related to differences in the time frames of differentiation induced in cells treated with VD3 and ATRA (data not shown).
Figure 6.
DEM and CDNB altered differentiation marker expression in VD3, and ATRA-induced HL-60 cells. HL-60 cells were exposed to 500 nM VD3 or 500 nM ATRA. Approximately 4 hours later cells were treated with either 0.5 mM DEM or 5 µM CDNB for 3 hours, in the presence or absence of 5 mM GSH. At 48 hours after differentiation induction, cells were collected for the analysis of CD11b and CD71 expression (A and B), and S-phase populations (C and D). At 24 hours after VD3 exposure, or ATRA treatment cells were collected to assess NBT reduction capacity (E and F). Data are represented as mean ± S.E. of three to five experiments. Statistical significance is expressed as *p < 0.05 versus control values.
Analysis of S-phase cells was also performed at 48 hours after the initial exposure to VD3 or ATRA, and the results reveal that both DEM and CDNB treatment decreased the proportion of VD3-exposed cells in S-phase (Fig. 6C). In line with the VD3 observations, ATRA-treated cells also exhibited decreased S-phase populations after DEM treatment (Fig. 6D); however, there was no significant change in S-phase distribution after CDNB incubation, and GSH supplementation appeared to have no effect on DEM and CDNB exposure (Fig. 6D). Because the ATRA-induced decrease in S-phase cell cycle population occurred later than VD3-induced alterations (data not shown), the decreases in S-phase population that is associated with ATRA-induced differentiation may be apparent at later time points. When a 3-hour incubation with DEM occurred 22 hours after VD3 induction, no enhancement of CD11b or decrease in CD71 expression took place (data not shown), suggesting that the effects of GSH on differentiation marker expression is time dependent. NBT reduction data also suggested that treatment with GSH-depleting agents enhanced HL-60 differentiation (Fig. 6). Both VD3-treated and ATRA-treated HL-60 cells exposed to either DEM or CDNB had higher NBT reduction capacity when compared to controls (Fig. 6E and F). Taken together, these results and the observations reported above are consistent with the hypothesis that a moderate, transient GSH depletion augments HL-60 differentiation.
NAC supplementation reduces differentiation marker expression in VD3-induced HL-60 cells.
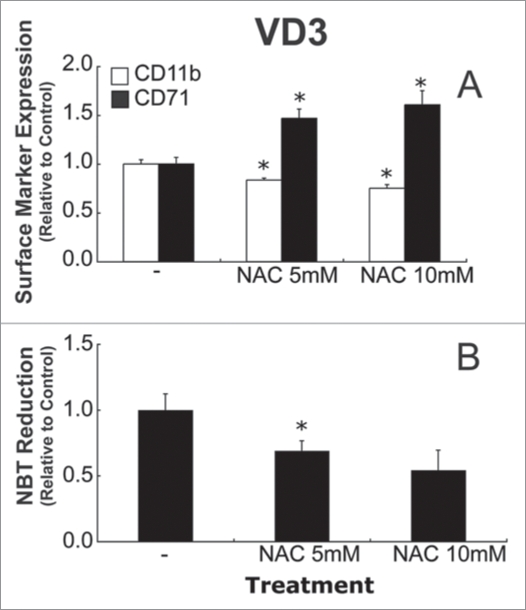
If transient GSH depletion enhances HL-60 differentiation, then it was hypothesized that thiol supplementation may diminish differentiation. To investigate this, HL-60 cells were treated with NAC, a derivative of the amino acid L-cysteine, at 4 hours after VD3-induction, and differentiation markers were assessed (Fig. 7). CD11b expression was lower and CD71 expression was higher in NAC-treated cells (Fig. 7A). In addition, NAC-treated cells also had decreased NBT reduction capacity (Fig. 7B). Although these data show that NAC treatment decreased differentiation marker expression in VD3-treated HL-60 cells, it did so without increasing intracellular GSH levels (GSH levels were 74% ± 6%, and 68% ± 6%, of control values 6 hours after 5 mM NAC, and 10 mM NAC, respectively), indicating that total thiol levels are likely the important determinants of these effects on differentiation.
Figure 7.
NAC treatment decreases differentiation marker expression in VD3-induced HL-60 cells. HL-60 cells were treated with NAC (5 or 10 mM) 4 hours after treatment with 500 nM VD3. Cell surface marker expression (A), and NBT reduction (B) were assessed 48, and 24 hours after VD3 treatment, respectively (B). Samples were analyzed in triplicate for NBT experiments. Data are represented as mean ± S.E. of three experiments. Statistical significance is expressed as *p < 0.05 versus control values.
GSH depletion enhances spontaneous HL-60 cell differentiation.
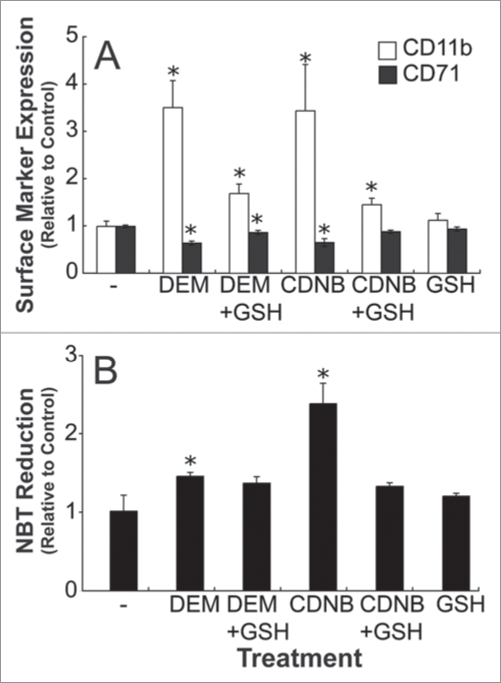
A small proportion of HL-60 cells spontaneously differentiate in culture, and thus this feature can be exploited experimentally to test the effects of GSH depletion on spontaneous differentiation. In order to determine if lowering intracellular GSH changes spontaneous maturation, un-induced HL-60 cells were incubated with DEM or CDNB for 3 hours, and differentiation markers were assessed at 3, 6 and 20 hours after the start of incubation. There was an increase in CD11b and a decrease in CD71 cell surface marker expression in both DEM and CDNB exposed cells (Fig. 8A). Control cells exposed to DEM or CDNB also exhibited increased NBT reduction capacity (Fig. 8B).
Figure 8.
DEM, and CDNB enhanced differentiation marker expression in un-induced HL-60 cells. HL-60 cells were treated with either 0.5 mM DEM or 5 µM CDNB for 3 hours, in the presence or absence of 5 mM GSH. Cells were collected at 48 hours for CD11b and CD71 expression (A), and at 24 hours for NBT reduction analysis (B). Samples were analyzed in triplicate for NBT experiments. Data are represented as mean ± S.E. of five to nine experiments. Statistical significance is expressed as *p < 0.05 versus control values.
Discussion
There is increasing evidence that the balance between the production of intracellular reactive oxygen species and the levels of GSH and other antioxidants modulates redox sensitive signaling pathways that regulate many cellular processes, including proliferation and differentiation; however, the precise mechanisms responsible for these complex responses and interactions remain largely unknown.9–19 The present study examined intracellular GSH levels during HL-60 cell differentiation, and the effects of two GSH depletors, CDNB and DEM, on the differentiation process. The results demonstrate that there is a small transient increase in total intracellular glutathione, but no apparent change in GSH/GSSG ratio, during both granulocytic and monocytic HL-60 maturation. This increase in intracellular glutathione precedes the changes in proliferation and CD11b cell surface marker expression, but coincides with an increase in NBT reduction capacity, a measure of superoxide anion production. In addition, treatment with low doses of CDNB and DEM to transiently decrease GSH levels augmented both induced and spontaneous differentiation, whereas NAC supplementation diminished it. Taken together with previous findings in other cell systems, the present data are consistent with a model in which reactive oxygen species act as signal mediators of cell differentiation. Thus, stimulation with a differentiation inducer leads to reactive oxygen species production, which in turn activate cell differentiation by an as yet undefined mechanism, as well as compensatory responses to deal with these reactive moieties, including transiently elevated GSH levels (Fig. 1A and B). When GSH levels are transiently depleted, reactive oxygen species availability is temporarily enhanced, leading to the activation of the cell differentiation program. Conversely, when thiol levels are augmented via the addition of NAC, reactive oxygen species are quenched, and as a result less oxidative signals are available to activate redox-sensitive differentiation pathways, and the cell differentiation program is impeded. On the other hand, under conditions of severe and sustained GSH depletion, excessive accumulation of reactive intermediates may cause inappropriate activation of signaling cascades or other cell injury, and thus thwart the normal cell differentiation program. Additional studies are needed to test this model, and to define the signaling pathways involved in these responses.
Although some previous studies have examined the role of GSH concentrations on cell differentiation, these studies have examined the effects of relatively drastic and sustained GSH depletion on this process, and most have depleted cellular GSH levels prior to or simultaneously with the induction of differentiation.23–28 Not surprisingly, differentiation is impaired under these severe conditions. In contrast, the present findings demonstrate that a more moderate and transient GSH depletion that is applied during the maturation process leads to enhanced HL-60 cell differentiation. In particular, the results show that when HL-60 cells were treated with the GSH-depleting agents at a time point that coincided with the differentiation-associated increase in intracellular GSH, differentiation marker expression was enhanced.
Consistent with this model, NAC treatment diminished differentiation marker expression, the opposite effect of GSH depletion treatments; however, it did so without increasing GSH levels. Note that NAC itself is a potent antioxidant, and has been shown to inhibit transcription factors involved in GSH synthesis. NAC inhibits NF-E2-related factor-2 (Nrf2), and thus downregulates the transcription of γ-glutamylcysteine ligase, the rate-limiting enzyme in GSH synthesis.62,63 These observations suggest that the thiol groups of GSH or NAC are likely critical for altering differentiation outcomes.
In addition to enhancing differentiation marker expression in induced HL-60 cells, CDNB and DEM also augmented spontaneous cell differentiation. Thus, altering thiol abundance not only affects monocytic and granulocytic pathways upregulated by VD3 and ATRA, respectively, but also stimulates the mechanisms responsible for spontaneous maturation. These findings further support the hypothesis that GSH levels are important determinants of differentiation events.
The present results also reveal that glutathione levels are regulated in a complex fashion during maturation. A small transient increase in glutathione levels was observed during both granulocytic and monocytic differentiation induction, suggesting that this may be a general feature of the differentiation process. Of significance, the measured increase in NBT reduction capacity coincided with the transient increase in GSH at 9 hours after VD3 exposure, and at 1 day after DMSO treatment, indicating a simultaneous increase in GSH and superoxide anion production capacity. Because oxidative stimuli are known to increase the expression of the rate limiting enzyme in GSH synthesis and hence elevate GSH levels,43 the initial increase in superoxide anion may cause GSH levels to become transiently higher. Although this association provides a possible explanation for the transient increase, no causal relationship has yet been established. Despite the fact that the increase in superoxide anion production may be a contributing factor to the transient increase in GSH, another possibility exists. HL-60 cells do not differentiate as a synchronous population, and thus there will always be some cells that are further along the differentiation pathway. As a result, some cells will attain the ability to produce superoxide anion earlier than others, and these data may be a reflection of this phenomenon.
Although these findings reveal a novel feature of HL-60 differentiation, many details concerning the nature of this transient increase still remain unclear. No changes in the GSH/GSSG ratio were detected in the current studies, and thus the transient increase in GSH appears to be explained by an increase in the absolute levels of glutathione (proportional increases in both GSH and GSSG levels). An increase in the absolute level of glutathione will affect any cell process that is dependent on this tripeptide’s availability, including enzyme activity, transport activity, glutathionylation, and cysteine availability. It is possible that higher glutathione levels may be required for some differentiation event, although additional studies are needed to test this possibility.
While these data do not support the hypothesis that a shift in intracellular thiol-redox status (a change in GSH/GSSG) is responsible for the transient increase in glutathione, this notion cannot be discounted. It is clear that thiol-redox status is not uniform throughout intracellular organelles, and differs within specific cellular compartments.63 If variations in GSH/GSSG do exist within the cell, then localized shifts in the GSH/GSSG ratio may be playing a critical role in redox signaling events, and hence cell processes such as differentiation. Additional studies are needed to identify possible changes within specific cellular compartments.
If GSH levels are an important factor in general differentiation events, then agents that alter its concentrations will affect differentiation outcomes. As mentioned earlier, diseases of differentiation (e.g., cancer, autoimmune disease and aging) are also associated with abnormal GSH levels. Although at this point the relationship is only a correlative one, understanding how GSH affects cellular differentiation may provide important insight into the etiology or treatment of these conditions. These findings may also have implications for in utero development. If the developing conceptus is exposed to environmental or infectious agents that deplete GSH levels, then orchestrated differentiation events may be disrupted, possibly leading to or contributing to birth defects, low birth weight, or increased propensity for disease later in life.
Materials and Methods
Materials.
VD3 was purchased from ALEXIS Corporation (Lausen, Switzerland). CD11b-PE, CD71-FITC, and PE and FITC isotype controls were from BD Biosciences (San Jose, CA). Unless otherwise stated, all other chemicals and reagents were purchased from Sigma-Aldrich.
Cell culture.
HL-60 cells were purchased from the American Type Culture Collection (ATCC) (Manassas, VA). The cell line was cultured in RPMI 1640 with L-glutamine (Mediatech, Herndon, VA) with 10% fetal bovine serum and 10 µg/ml gentamicin (Invitrogen, Carlsbad, CA) and incubated at 37°C and 5% CO2 atmosphere. For all experiments HL-60 cells were seeded at 0.3 × 10⁶ cells/ml. Cells were induced to differentiate into granulocyte-like cells through incubation with media supplemented with either 1.5% DMSO, or 500 nM ATRA, and into monocyte-like cells through incubation with 500 nM VD3.
GSH analysis.
Cell lysates were analyzed for intracellular GSH using an enzymatic assay containing 5,5′-dithio-bis(2-nitrobenzoic acid), NADPH, and glutathione reductase adapted for 96-well plate as described by Baker et al.64 By combining the use of small sample volumes with the sensitivity and specificity of the GSH assay by enzymatic recycling, this assay provides a rapid and sensitive assay for GSH and GSSG in biological samples. Protein analysis was performed using the DC Protein Assay kit (Bio-Rad, Hercules, CA). The agent 2-vinylpyridine was added to cell lysates to determine GSSG levels.
Cell cycle analysis.
Cells were aliquoted at 1 × 10⁶ cells/ml, were fixed in a 75% ethanol solution, and were kept at 4°C prior to analysis. On the day of the assay, cells were resuspended in 1 mg RNAse/ml phosphate buffered saline (PBS). After a 30 min incubation at room temperature, cells were resuspended in 20 µg propidium iodide (PI)/ml PBS, and analyzed using a Benton Dickson FACSCalibur flow cytometer (San Jose, CA). CD11b and CD71 differentiation marker expression. Cells were aliquoted at 1 × 10⁶ cells/ml, washed in PBS, and incubated with 15 µl of CD11b-PE and CD71-FITC (BD Biosciences, San Jose, CA) for 20 min at room temperature, in the dark. After a wash with PBS, supplemented with 1% FBS, cells were centrifuged for 7 min at 1,000 RPM. Cells were resuspended in 1 ml of PBS and kept at 4°C, until analyzed using a Benton Dickson FACSCalibur flow cytometer (San Jose, CA). Isotype controls for PE, and FITC fluorescence (BD Bioscience), as well as positive controls for CD11b-PE, and CD71-FITC, were run during each experiment.
Nitroblue tetrazolium (NBT) assay.
Approximately 5 × 10⁵ cells were resuspended in 0.5 ml PBS containing NBT (200 nM) and phorbol 12-myristate 13-acetate (PMA) (500 nM), the activating agent. Cells were incubated at 37°C containing for 30 minutes. Approximately 1N HCl was added to the samples to stop the reaction. The formazan precipitate was solubilized in DMSO and transferred to 96-well plates. Absorbance of the precipitates was analyzed in a spectrophotometric plate reader at 572 nm.
Statistical analysis.
Statistical analysis was performed using Statview 5 (SAS Institute Inc., Cary, NC). Data were analyzed using one-way ANOVA and Fisher’s PLSD posthoc analyses. In all cases p values of less than 0.05 were considered statistically significant.
Acknowledgements
We thank Christine Hammond and Rosemarie Marchan for their valuable advice on aspects of the project. Supported in part by National Institutes of Health Grants DK48823 and DK067214, and National Institute of Environmental Health Sciences Center Grant ES01247 and Toxicology Training Grant ES07026.
Abbreviations
- ATRA
all-trans retinoic acid
- BSO
buthionine sulfoximine
- DEM
diethyl maleate
- DMSO
dimethyl sulfoxide
- CDNB
1-chloro-2,4-dinitrobenzene
- GSH
reduced glutathione
- GSSG
glutathione disulfide
- NAC
N-acetyl L-cysteine
- NBT
nitroblue tetrazolium
- Nrf2
NF-E2-related factor-2
- VD3
1α,25-dihydroxyvitamin D3
Footnotes
Previously published online: www.landesbioscience.com/journals/oximed/article/10405
References
- 1.Oberley LW, Oberley TD, Buettner GR. Cell differentiation, aging and cancer: the possible roles of superoxide and superoxide dismutases. Medical Hypotheses. 1980;6:249–268. doi: 10.1016/0306-9877(80)90123-1. [DOI] [PubMed] [Google Scholar]
- 2.Goldman SA. Disease targets and strategies for the therapeutic modulation of endogenous neural stem and progenitor cells. Clin Pharmacol Ther. 2007;82:453–460. doi: 10.1038/sj.clpt.6100337. [DOI] [PubMed] [Google Scholar]
- 3.Maródi L, Notarangelo LD. Immunological and genetic bases of new primary immunodeficiencies. Nat Rev Immunol. 2007;7:851–861. doi: 10.1038/nri2195. [DOI] [PubMed] [Google Scholar]
- 4.Chien KR, Domian IJ, Parker KK. Cardiogenesis and the complex biology of regenerative cardiovascular medicine. Science. 2008;322:1494–1497. doi: 10.1126/science.1163267. [DOI] [PubMed] [Google Scholar]
- 5.Discher DE, Mooney DJ, Zandstra PW. Growth factors, matrices and forces combine and control stem cells. Science. 2009;324:1673–1677. doi: 10.1126/science.1171643. [DOI] [PMC free article] [PubMed] [Google Scholar]
- 6.Mohn F, Schübeler D. Genetics and epigenetics: stability and plasticity during cellular differentiation. Trends Genet. 2009;25:129–136. doi: 10.1016/j.tig.2008.12.005. [DOI] [PubMed] [Google Scholar]
- 7.Estrela JM, Ortega A, Obrador E. Glutathione in cancer biology and therapy. Critical Rev Clin Lab Sci. 2006;43:143–181. doi: 10.1080/10408360500523878. [DOI] [PubMed] [Google Scholar]
- 8.Ballatori N, Krance SM, Notenboom S, Shi S, Tieu K, Hammond CL. Glutathione dysregulation and the etiology and progression of human diseases. Biol Chem. 2009;390:191–214. doi: 10.1515/BC.2009.033. [DOI] [PMC free article] [PubMed] [Google Scholar]
- 9.Kamata H, Hirata H. Redox regulation of cellular signalling. Cell Signal. 1999;11:1–14. doi: 10.1016/s0898-6568(98)00037-0. [DOI] [PubMed] [Google Scholar]
- 10.Sauer H, Wartenberg M, Hescheler J. Reactive oxygen species as intracellular messengers during cell growth and differentiation. Cell Physiol Biochem. 2001;11:173–186. doi: 10.1159/000047804. [DOI] [PubMed] [Google Scholar]
- 11.Esposito F, Ammendola R, Faraonio R, Russo T, Cimino F. Redox control of signal transduction, gene expression and cellular senescence. Neurochem Res. 2004;29:617–628. doi: 10.1023/b:nere.0000014832.78725.1a. [DOI] [PubMed] [Google Scholar]
- 12.Ghezzi P. Regulation of protein function by glutathionylation. Free Radic Res. 2005;39:573–580. doi: 10.1080/10715760500072172. [DOI] [PubMed] [Google Scholar]
- 13.Dalle-Donne I, Rossi R, Giustarini D, Colombo R, Milzani A. S-Glutathionylation in protein redox regulation. Free Radic Biol Med. 2007;43:883–898. doi: 10.1016/j.freeradbiomed.2007.06.014. [DOI] [PubMed] [Google Scholar]
- 14.Go YM, Jones DP. Redox compartmentalization in eukaryotic cells. Biochim Biophys Acta. 2008;1780:1273–1290. doi: 10.1016/j.bbagen.2008.01.011. [DOI] [PMC free article] [PubMed] [Google Scholar]
- 15.Chan EC, Jiang F, Peshavariya HM, Dusting GJ. Regulation of cell proliferation by NADPH oxidasemediated signaling: potential roles in tissue repair, regenerative medicine and tissue engineering. Pharmacol Ther. 2009;122:97–108. doi: 10.1016/j.pharmthera.2009.02.005. [DOI] [PubMed] [Google Scholar]
- 16.Eickhoff R, Baldauf C, Koyro HW, Wennemuth G, Suga Y, Seitz J, et al. Influence of macrophage migration inhibitory factor (MIF) on the zinc content and redox state of protein-bound sulphydryl groups in rat sperm: indications for a new role of MIF in sperm maturation. Mol Hum Reprod. 2004;10:605–611. doi: 10.1093/molehr/gah075. [DOI] [PubMed] [Google Scholar]
- 17.Goth SR, Chu RA, Pessah IN. Oxygen tension regulates the in vitro maturation of GM-CSF expanded murine bone marrow dendritic cells by modulating class II MHC expression. J Immunol Methods. 2006;308:179191. doi: 10.1016/j.jim.2005.10.012. [DOI] [PubMed] [Google Scholar]
- 18.Konopka R, Kubala L, Lojek A, Pacherník J. Alternation of retinoic acid induced neural differentiation of p19 embryonal carcinoma cells by reduction of reactive oxygen species intracellular production. Neuro Endocrinol Lett 2. 2008;29:770–774. [PubMed] [Google Scholar]
- 19.Yan Y, Sabharwal P, Rao M, Sockanathan S. The antioxidant enzyme Prdx1 controls neuronal differentiation by thiol-redox-dependent activation of GDE2. Cell. 2009;138:1209–1221. doi: 10.1016/j.cell.2009.06.042. [DOI] [PMC free article] [PubMed] [Google Scholar]
- 20.Fidelus RK, Tsan MF. Glutathione and lymphocyte activation: a function of ageing and auto-immune disease. Immunology. 1987;61:503–508. [PMC free article] [PubMed] [Google Scholar]
- 21.Lang CA, Naryshkin S, Schneider DL, Mills BJ, Lindeman RD. Low blood glutathione levels in healthy aging adults. J Lab Clin Med. 1992;120:720–725. [PubMed] [Google Scholar]
- 22.Liu R, Choi J. Age-associated decline in gammaglutamylcysteine synthetase gene expression in rats. Free Radical Biol Med. 2000;28:566–574. doi: 10.1016/s0891-5849(99)00269-5. [DOI] [PubMed] [Google Scholar]
- 23.Esposito F, Agosti V, Morrone G, Morra F, Cuomo C, Russo T, et al. Inhibition of the differentiation of human myeloid cell lines by redox changes induced through glutathione depletion. Biochem J. 1994;301:649–653. doi: 10.1042/bj3010649. [DOI] [PMC free article] [PubMed] [Google Scholar]
- 24.Hansen JM, Carney EW, Harris C. Altered differentiation in rat and rabbit limb bud micromass cultures by glutathione modulating agents. Free Radic Biol Med. 2001;31:1582–1592. doi: 10.1016/s0891-5849(01)00751-1. [DOI] [PubMed] [Google Scholar]
- 25.Huh YJ, Kim JM, Kim H, Song H, So H, Lee SY, et al. Regulation of osteoclast differentiation by the redoxdependent modulation of nuclear import of transcription factors. Cell Death Differ. 2006;13:1138–1146. doi: 10.1038/sj.cdd.4401793. [DOI] [PubMed] [Google Scholar]
- 26.Kim JM, Kim H, Kwon SB, Lee SY, Chung SC, Jeong DW, et al. Intracellular glutathione status regulates mouse bone marrow monocyte-derived macrophage differentiation and phagocytic activity. Biochem Biophys Res Commun. 2004;325:101–108. doi: 10.1016/j.bbrc.2004.09.220. [DOI] [PubMed] [Google Scholar]
- 27.Ardite E, Barbera JA, Roca J, Fernández-Checa JC. Glutathione depletion impairs myogenic differentiation of murine skeletal muscle C2C12 cells through sustained NFkappaB activation. Am J Pathol. 2004;165:719–728. doi: 10.1016/s0002-9440(10)63335-4. [DOI] [PMC free article] [PubMed] [Google Scholar]
- 28.Kim HJ, Barajas B, Chan RC, Nel AE. Glutathione depletion inhibits dendritic cell maturation and delayed-type hypersensitivity: implications for systemic disease and immunosenescence. J Allergy Clin Immunol. 2007;119:1225–1233. doi: 10.1016/j.jaci.2007.01.016. [DOI] [PubMed] [Google Scholar]
- 29.Lonigro R, Donnini D, Fabbro D, Perrella G, Damante G, Ambesi Impiombato FS, et al. Thyroid-specific gene expression is differentially influenced by intracellular glutathione level in FRTL-5 cells. Endocrinology. 2000;141:90190–90199. doi: 10.1210/endo.141.3.7388. [DOI] [PubMed] [Google Scholar]
- 30.Catani MV, Savini I, Duranti G, Caporossi D, Ceci R, Sabatini S, et al. Nuclear factor kappaB and activating protein 1 are involved in differentiation-related resistance to oxidative stress in skeletal muscle cells. Free Radic Biol Med. 2004;37:1024–1036. doi: 10.1016/j.freeradbiomed.2004.06.021. [DOI] [PubMed] [Google Scholar]
- 31.Kim H, Kim IY, Lee SY, Jeong D. Bimodal actions of reactive oxygen species in the differentiation and boneresorbing functions of osteoclasts. FEBS Lett. 2006;580:5661–5665. doi: 10.1016/j.febslet.2006.09.015. [DOI] [PubMed] [Google Scholar]
- 32.Igarashi K, Sun J. The heme-Bach1 pathway in the regulation of oxidative stress response and erythroid differentiation. Antioxid Redox Signal. 2006;8:107–118. doi: 10.1089/ars.2006.8.107. [DOI] [PubMed] [Google Scholar]
- 33.Shalini S, Bansal MP. Co-operative effect of glutathione depletion and selenium induced oxidative stress on API and NFκB expression in testicular cells in vitro: insights to regulation of spermatogenesis. Biol Res. 2007;40:307–317. [PubMed] [Google Scholar]
- 34.Ngo MA, Sinitsyna NN, Qin Q, Rice RH. Oxygendependent differentiation of human keratinocytes. J Invest Dermatol. 2007;127:354–613. doi: 10.1038/sj.jid.5700522. [DOI] [PubMed] [Google Scholar]
- 35.Hansen JM, Klass M, Harris C, Csete M. A reducing redox environment promotes C2C12 myogenesis: implications for regeneration in aged muscle. Cell Biol Int. 2007;31:546–553. doi: 10.1016/j.cellbi.2006.11.027. [DOI] [PMC free article] [PubMed] [Google Scholar]
- 36.Gopalakrishna R, Gundimeda U, Schiffman JE, McNeill TH. A direct redox regulation of protein kinase C isoenzymes mediates oxidant-induced neuritogenesis in PC12 cells. J Biol Chem. 2008;283:14430–14444. doi: 10.1074/jbc.M801519200. [DOI] [PMC free article] [PubMed] [Google Scholar]
- 37.Cristofanon S, Nuccitelli S, D’Alessio M, Dicato M, Diederich M, Ghibelli L. Oxidation-dependent maturation and survival of explanted blood monocytes via Bcl-2 upregulation. Biochem Pharmacol. 2008;76:1533–1543. doi: 10.1016/j.bcp.2008.07.042. [DOI] [PubMed] [Google Scholar]
- 38.de Souza Malaspina TS, dos Santos CX, Campanelli AP, Laurindo FR, Sogayar MC, Granjeiro JM. Tartrateresistant acid phosphatase activity and glutathione levels are modulated during hFOB 1.19 osteoblastic differentiation. J Mol Histol. 2008;39:627–634. doi: 10.1007/s10735-008-9203-0. [DOI] [PubMed] [Google Scholar]
- 39.Ding Y, Choi KJ, Kim JH, Han X, Piao Y, Jeong JH, et al. Endogenous hydrogen peroxide regulates glutathione redox via nuclear factor erythroid 2-related factor 2 downstream of phosphatidylinositol 3-kinase during muscle differentiation. 2 downstream of phosphatidylinositol 3-kinase during muscle differentiation. Am J Pathol. 2008;172:1529–1541. doi: 10.2353/ajpath.2008.070429. [DOI] [PMC free article] [PubMed] [Google Scholar]
- 40.Takahata Y, Takarada T, Iemata M, Yamamoto T, Nakamura Y, Kodama A, et al. Functional expression of beta2 adrenergic receptors responsible for protection against oxidative stress through promotion of glutathione synthesis after Nrf2 upregulation in undifferentiated mesenchymal C3H10T1/2 stem cells. J Cell Physiol. 2009;218:268–275. doi: 10.1002/jcp.21594. [DOI] [PubMed] [Google Scholar]
- 41.Markovic J, Mora NJ, Broseta AM, Gimeno A, de-la-Concepción N, Viña J, Pallardó FV. The depletion of nuclear glutathione impairs cell proliferation in 3t3 fibroblasts. PLoS One. 2009;4:641. doi: 10.1371/journal.pone.0006413. [DOI] [PMC free article] [PubMed] [Google Scholar]
- 42.Urish KL, Vella JB, Okada M, Deasy BM, Tobita K, Keller BB, et al. Antioxidant levels represent a major determinant in the regenerative capacity of muscle stem cells. Mol Biol Cell. 2009;20:509–520. doi: 10.1091/mbc.E08-03-0274. [DOI] [PMC free article] [PubMed] [Google Scholar]
- 43.Yamamoto T, Sakaguchi N, Hachiya M, Nakayama F, Yamakawa M, Akashi M. Role of catalase in monocytic differentiation of U937 cells by TPA: hydrogen peroxide as a second messenger. Leukemia. 2009;23:761–769. doi: 10.1038/leu.2008.353. [DOI] [PubMed] [Google Scholar]
- 44.Motohashi H, Katsuoka F, Engel JD, Yamamoto M. Small Maf proteins serve as transcriptional cofactors for keratinocyte differentiation in the Keap1-Nrf2 regulatory pathway. Proc Natl Acad Sci USA. 2004;101:6379–6384. doi: 10.1073/pnas.0305902101. [DOI] [PMC free article] [PubMed] [Google Scholar]
- 45.Hinoi E, Fujimori S, Wang L, Hojo H, Uno K, Yoneda Y. Nrf2 negatively regulates osteoblast differentiation via interfering with Runx2-dependent transcriptional activation. J Biol Chem. 2006;281:18015–18024. doi: 10.1074/jbc.M600603200. [DOI] [PubMed] [Google Scholar]
- 46.Hinoi E, Takarada T, Fujimori S, Wang L, Iemata M, Uno K, Yoneda Y. Nuclear factor E2 p45-related factor 2 negatively regulates chondrogenesis. Bone. 2007;40:337–344. doi: 10.1016/j.bone.2006.08.016. [DOI] [PubMed] [Google Scholar]
- 47.Kusano Y, Horie S, Shibata T, Satsu H, Shimizu M, Hitomi E, et al. Keap1 regulates the constitutive expression of GST A1 during differentiation of Caco-2 cells. Biochemistry. 2008;47:6169–6177. doi: 10.1021/bi800199z. [DOI] [PubMed] [Google Scholar]
- 48.Pi J, Diwan BA, Sun Y, Liu J, Qu W, He Y, et al. Arsenic-induced malignant transformation of human keratinocytes: involvement of Nrf2. Free Radic Biol Med. 2008;45:651–658. doi: 10.1016/j.freeradbiomed.2008.05.020. [DOI] [PMC free article] [PubMed] [Google Scholar]
- 49.D’Archivio M, Scazzocchio B, Filesi C, Varì R, Maggiorella MT, Sernicola L, et al. Oxidised LDL upregulate CD36 expression by the Nrf2 pathway in 3T3-L1 preadipocytes. FEBS Lett. 2008;582:2291–2298. doi: 10.1016/j.febslet.2008.05.029. [DOI] [PubMed] [Google Scholar]
- 50.Williams MA, Rangasamy T, Bauer SM, Killedar S, Karp M, Kensler TW, et al. Disruption of the transcription factor Nrf2 promotes pro-oxidative dendritic cells that stimulate Th2-like immunoresponsiveness upon activation by ambient particulate matter. J Immunol. 2008;181:4545–4559. doi: 10.4049/jimmunol.181.7.4545. [DOI] [PMC free article] [PubMed] [Google Scholar]
- 51.Zhao F, Wu T, Lau A, Jiang T, Huang Z, Wang XJ, et al. Nrf2 promotes neuronal cell differentiation. Free Radic Biol Med. 2009;47:867–879. doi: 10.1016/j.freeradbiomed.2009.06.029. [DOI] [PMC free article] [PubMed] [Google Scholar]
- 52.Kosaka K, Mimura J, Itoh K, Satoh T, Shimojo Y, Kitajima C, et al. Role of Nrf2 and p62/ZIP in the neurite outgrowth by carnosic acid in PC12 h cells. J Biochem. 2010;147:73–81. doi: 10.1093/jb/mvp149. [DOI] [PubMed] [Google Scholar]
- 53.Bourdonnay E, Morzadec C, Fardel O, Vernhet L. Redox-sensitive regulation of gene expression in human primary macrophages exposed to inorganic arsenic. J Cell Biochem. 2009;107:537–547. doi: 10.1002/jcb.22155. [DOI] [PubMed] [Google Scholar]
- 54.Takahashi T, Tabuchi T, Tamaki Y, Kosaka K, Takikawa Y, Satoh T. Carnosic acid and carnosol inhibit adipocyte differentiation in mouse 3T3-L1 cells through induction of phase2 enzymes and activation of glutathione metabolism. Biochem Biophys Res Commun. 2009;382:549–554. doi: 10.1016/j.bbrc.2009.03.059. [DOI] [PubMed] [Google Scholar]
- 55.Collins SJ, Gallo RC, Gallagher RE. Continuous growth and differentiation of human myeloid leukaemic cells in suspension culture. Nature. 1977;270:347–349. doi: 10.1038/270347a0. [DOI] [PubMed] [Google Scholar]
- 56.Collins SJ, Ruscetti FW, Gallagher RE, Gallo RC. Terminal differentiation of human promyelocytic leukemia cells induced by dimethyl sulfoxide and other polar compounds. Proc Natl Acad Sci USA. 1978;75:2458–2462. doi: 10.1073/pnas.75.5.2458. [DOI] [PMC free article] [PubMed] [Google Scholar]
- 57.Collins SJ, Ruscetti FW, Gallagher RE, Gallo RC. Normal functional characteristics of cultured human promyelocytic leukemia cells (HL-60) after induction of differentiation by dimethylsulfoxide. J Exp Med. 1979;149:969–974. doi: 10.1084/jem.149.4.969. [DOI] [PMC free article] [PubMed] [Google Scholar]
- 58.Breitman TR, Selonick SE, Collins SJ. Induction of differentiation of the human promyelocytic leukemia cell line (HL-60) by retinoic acid. Proc Natl Acad Sci USA. 1980;77:2936–2940. doi: 10.1073/pnas.77.5.2936. [DOI] [PMC free article] [PubMed] [Google Scholar]
- 59.McCarthy DM, San Miguel JF, Freake HC, Green PM, Zola H, Catovsky D, et al. 1,25-dihydroxyvitamin D3 inhibits proliferation of human promyelocytic leukaemia (HL60) cells and induces monocyte-macrophage differentiation in HL60 and normal human bone marrow cells. Leuk Res. 1983;7:51–55. doi: 10.1016/0145-2126(83)90057-7. [DOI] [PubMed] [Google Scholar]
- 60.Newburger PE, Speier C, Borregaard N, Walsh CE, Whitin JC, Simons ER. Development of the super-oxide-generating system during differentiation of the HL-60 human promyelocytic leukemia cell line. J Biol Chem. 1984;259:3771–3776. [PubMed] [Google Scholar]
- 61.Plummer JL, Smith BR, Sies H, Bend JR. Chemical depletion of glutathione in vivo. Methods Enzymol. 1981;77:50–59. doi: 10.1016/s0076-6879(81)77010-1. [DOI] [PubMed] [Google Scholar]
- 62.Li N, Alam J, Venkatesan MI, Eiguren-Fernandez A, Schmitz D, Di Stefano E, et al. Nrf2 is a key transcription factor that regulates antioxidant defense in macrophages and epithelial cells: protecting against the proinflammatory and oxidizing effects of diesel exhaust chemicals. J Immunol. 2004;173:3467–3481. doi: 10.4049/jimmunol.173.5.3467. [DOI] [PubMed] [Google Scholar]
- 63.Lu SC. Regulation of hepatic glutathione synthesis: current concepts and controversies. Faseb J. 1999;13:1169–1183. [PubMed] [Google Scholar]
- 64.Baker MA, Cerniglia GJ, Zaman A. Microtiter plate assay for the measurement of glutathione and glutathione disulfide in large numbers of biological samples. Anal Biochem. 1990;190:360–365. doi: 10.1016/0003-2697(90)90208-q. [DOI] [PubMed] [Google Scholar]


