Abstract
A recent reclassification of diatoms based on phylogenies recovered using the nuclear-encoded SSU rRNA gene contains three major classes, Coscinodiscophyceae, Mediophyceae and the Bacillariophyceae (the CMB hypothesis). We evaluated this with a sequence alignment of 1336 protist and heterokont algae SSU rRNAs, which includes 673 diatoms. Sequences were aligned to maintain structural elements conserved within this dataset. Parsimony analysis rejected the CMB hypothesis, albeit weakly. Morphological data are also incongruent with this recent CMB hypothesis of three diatom clades. We also reanalyzed a recently published dataset which purports to support the CMB hypothesis. Our reanalysis found that the original analysis had not converged on the true bipartition posterior probability distribution, and rejected the CMB hypothesis. Thus we conclude that a reclassification of the evolutionary relationships of the diatoms according to the CMB hypothesis is premature.
Keywords: SSU, diatom phylogeny, diatom classification, Coscinodiscophyceae, Mediophyceae, Bacillariophyceae
Introduction
Analyses of molecular data (mainly nuclear SSU rDNA; henceforth SSU) have generally reinforced the traditional view (Simonsen, 1979; Round et al., 1990) that centric diatoms broadly grade into pennates through many nodes (Medlin et al., 1993; Medlin et al., 1996a; Medlin et al., 1996b; Ehara et al., 2000; Medlin et al., 2000; Medlin & Kaczmarska, 2004; Sorhannus, 2004; Alverson et al., 2006; see Alverson & Theriot, 2005 for review; Sorhannus, 2007; Choi et al., 2008). However, Medlin & Kaczmarska (2004) recently proposed that centric diatoms were composed of only two clades rather than many. They retained the name Coscinodiscophyceae for the so-called “radial centrics” and applied the name Mediophyceae for the so-called “bipolar” or “multipolar centrics”. They also suggested a number of morphological characters as diagnostic for these groups. We refer to this as the CMB hypothesis (for the three major clades discovered – Coscinodiscophyceae, Mediophyceae and Bacillariophyceae).
The CMB phylogenetic hypothesis has not been universally embraced. For example, Mann & Adl (2005) treated both Coscinodiscophyceae and Mediophyceae as paraphyletic taxa without discussion. Williams & Kociolek (2007) challenged the robustness of the CMB phylogeny based on the fact that many different SSU analyses return different trees. In contrast, Sims et al. (2006) recovered the CMB hypothesis with high bipartition posterior probability (BPP) support. Medlin et al. (2008) recovered the CMB hypothesis with high BPP support using a secondary structure alignment but noted that several aspects of the tree were unusual (e.g., the placement of Attheya).
In fact, topology of the diatom SSU tree, and support values for incongruent groups, has changed from study to study. For example, the elongate Toxarium has been placed well within the centric grade amidst multipolar diatoms (very distant from the pennate diatoms) using ML analysis on 38 diatoms (Kooistra et al., 2003), as sister to all pennates in a Bayesian analysis of 51 diatom sequences (Chepurnov et al., 2008), poorly resolved in an MP analysis of 181 diatom sequences (Alverson et al., 2006), and once again well within the multipolar diatoms in a Bayesian analysis of 54 diatom SSU sequences (Medlin et al., 2008). As underscored by this brief comparison, the many different inferences of diatom phylogeny have utilized different alignment strategies, different optimality criteria, have employed those criteria in different ways and have used different taxa. Any or all of these factors may have lead to the novel results of Medlin & Kaczmarska (2004) and Sims et al. (2006), but this cannot be directly studied because Medlin & Kaczmarska (2004) and the Sims et al. (2006) datasets which produced the CMB hypothesis have not been made publicly available. However, the Medlin et al. (2008) dataset is available and we re-analyse it below. To test the effects of ingroup and outgroup sampling, we created our own large alignment of stramenopile SSU sequences aligned according to secondary structure (Gutell et al., 1985; Gutell et al., 1992; Gutell et al., 2002) and used it to test the CMB hypothesis and its robustness. Specifically we address the effect (or lack thereof) of adding distantly related outgroups on inferences of the diatom SSU tree.
Materials and Methods
Multiple Sequence Alignment
We included all 1549 nuclear encoded small subunit ribosomal DNA (rDNA) stramenopile sequences available in Genbank as of September 1, 2007. The SSU rDNA sequences were aligned manually with the alignment editor “AE2” (developed by T. Macke, Scripps Research Institute, San Diego, CA—Larsen et al. 1993), which was developed for Sun Microsystems’ (Santa Clara, CA) workstations running the Solaris operating system. The manual alignment process involves first aligning positionally homologous nucleotides (i.e., those that map to the same locations in the secondary and tertiary structure models) into columns in the alignment, maximizing their sequence and structure similarity. For regions with high similarity between sequences, the nucleotide sequence is sufficient to align sequences with confidence. For more variable regions in closely related sequences or when aligning more distantly related sequences, however, a high-quality alignment only can be produced when additional information (here, secondary and/or tertiary structure data) is included.
The underlying SSU rRNA secondary structure model initially was predicted with covariation analysis (Gutell et al., 1985; Gutell et al., 1992). Approximately 98% of the predicted model basepairs were present in the high-resolution crystal structure from the 30S ribosomal subunit (Gutell et al., 2002). This model (based on the bacterium Escherichia coli) has been extended to the eukaryotic SSU rRNA (Cannone et al., 2002), further using covariation analysis to assess eukaryote-specific features. The additional constraints of the eukaryotic model were used to refine the alignment of the stramenopile sequences iteratively until positional homology was established for the entire data matrix.
The initial SSU rDNA alignment contained 1549 sequences, with a final length of 3786 columns. Medlin & Kaczmarska (2004) filtered out sequences that were less than 50% complete and we followed this convention, resulting in a final dataset of 1336 stramenopile sequences of which 673 are diatoms and 7 are bolidophytes, which are considered the immediate sister group to diatoms according to both chloroplast encoded rbcL and SSU data (Daugbjerg & Andersen, 1997; Goertzen & Theriot, 2003; Andersen, 2004). The remaining taxa are more distantly related stramenopiles. The final alignment is available at TreeBASE (http://www.treebase.org/treebase/intro.html) or from the authors. Forty secondary structure model diagrams representing the major diatom lineages are available at http://www.rna.ccbb.utexas.edu/SIM/4D/Diatom nSSU/. We analyzed the data in two data sets: diatoms plus bolidophytes only (DiatBo) and diatoms plus all stramenopiles (DiatStram).
Other data sets
We obtained the Nexus files used for Figures 2 and 3 in Medlin & Kaczmarska (2004) directly from Medlin. One dataset had 126 sequences and the other had 281 sequences, and we refer to them as the MK126 and MK281 datasets. Both had the same 123 diatom sequences and differed only in that the former used only bolidophytes as the outgroup and the latter sampled broadly across eukaryotes as the outgroups. We also used the Nexus file used to produce Figure 1A of Medlin et al. (2008) from http://www3.interscience.wiley.com.ezproxy.lib.utexas.edu/journal/121395867/suppinfo. That file had 54 sequences, all diatoms with no outgroup, and we refer to that as the M54 dataset.
Figure 2.
Strict consensus of 503 unique equally most parsimonious trees calculated from the diatom plus bolidophyte (DiatBo) dataset. Only relationships among diatoms are shown.
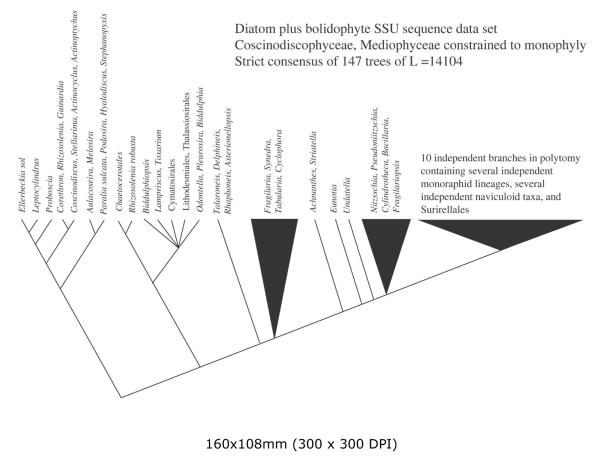
Figure 3.
Strict consensus of 147 unique equally most parsimonious trees calculated from the Bolidomonas plus diatom (DiatBo) dataset with Coscinodiscophyceae and Mediophyceae constrained to monophyly. Only relationships among diatoms are shown.
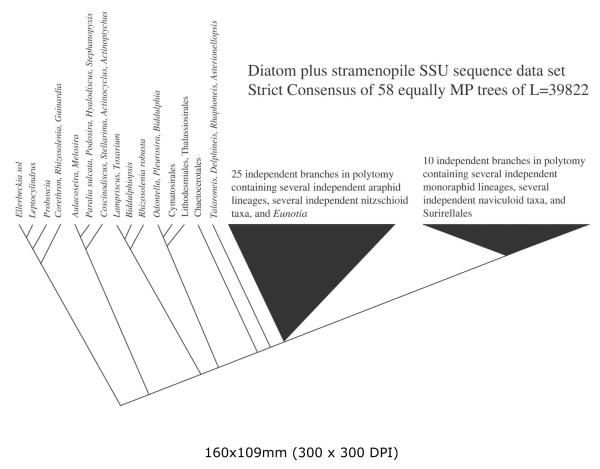
Figure 1.
Strict consensus of 65 unique equally most parsimonious trees calculated from the stramenopile-outgroup and diatom-ingroup analysis (DiatStram dataset). Only relationships among diatoms are shown.
Phylogenetic analysis
All datasets were subjected to parsimony analysis in TNT (Goloboff et al., 2003). The full suite of TNT options (sectorial search, ratchet, drift, and tree fusion) were used. There is no standard recommendation for use of these algorithms and there are few comparative studies of these algorithms. Within the context of the ratchet, Nixon (1999) argued that in large datasets, it may be better to limit length of searches on individual islands of trees, and search more islands. The notion is that exploring a greater range of islands containing optimal trees, is more likely to cover the entire diversity of optimal trees in a shorter period of time than exhaustively searching one island. Thus, we took the same approach used by Goertzen and Theriot (2003) and Alverson et al. (2006) when employing these newer algorithms. We increased the number of all cycles, rounds and repetitions for sectorial, drift, fusion and ratchet searches 10-fold beyond default values, and used between 100 and 1000 random taxon additions for each run. We saved the resultant trees from each run separately, and then repeated the procedure with a new randomly selected seed number. After each run, we checked that no shorter tree was found, combined trees from all previous runs and then calculated the number of nodes collapsed in their strict consensus. If no shorter trees were found and if no additional nodes were collapsed, we concluded that we had sampled the complete representative set of MP trees, as additional trees would be redundant and unlikely to further erode the resolution of the strict consensus (Nixon, 1999; Goertzen & Theriot, 2003).
We assessed the parsimony penalty required by constraining each of Coscinodiscophyceae, Mediophyceae and Bacillariophyceae to monophyly under searches as above. We assessed support for the unconstrained MP trees using nonparametric bootstrap (BS) analysis in TNT with the standard sampling with replacement strategy. We used the new technology search with 10 taxon additions and sectorial, ratchet, drift, and tree fusings for each of the 1000 pseudoreplicates of the BS analysis.
The DiatBo, MK 281, MK126 and M54 data sets were subjected to Bayesian analyses. All Bayesian analyses were run with the GTR+G+I model (nucmodel=4by4, nst=6, rates=invgamma). These were the settings used by Sims et al. (2006) and also corresponded to the best model for each dataset as selected by MrModelTest (Nylander, 2004). All initial runs for all datasets were done at 1,000,000 MCMC generations, equal to or greater than the number of generations run by Medlin and Kaczmarska (2004), Sims et al. (2006) and Medlin et al. (2008). Where these papers did not specify other settings for the Bayesian analysis, default settings were used. To test reproducibility of the results, we ran three separate analyses, each with 2 runs for a total of six independent runs of 1,000,000 MCMC generations each. We also ran one analysis of the DiatBo dataset with 2 runs (4 chains, three heated, one cold) for 10 million generations, saving every 10,000th tree. Finally, we ran the M54 dataset for 50 million generations, saving every 10,000th tree. We assessed whether independent runs in all analyses had sampled the same posterior distribution by comparing independent run (split) posterior probabilities with the compare command in AWTY (Wilgenbusch et al., 2004). We followed the burn-in periods of Medlin et al. (2004) and Medlin et al. (2008) for their datasets when we ran 1,000,000 generations on M54, MK126 and MK281. We used a burn-in of 90% for our DiatBo dataset 1,000,000 and 10,000,000 generation analyses to approximate Sims et al. (2006).
Morphology
We coded the characters of symmetry, presence or absence of mucilaginous matrix, auxospore shape/growth, presence/absence of the properizonium and of the perizonium, according to the assessments of Medlin & Kaczmarska for 34 taxa (2004: Table 2, page 258), and treated all multistate characters as unordered. Since no outgroup or ontogenetic information was provided, the only option for rooting was to consider the Coscinodiscophyceae as the outgroup to the remaining diatoms and so test for monophyly of the Mediophyceae and Bacillariophyceae. However it is possible to determine if the Coscinodiscophyceae formed a convex group (possibly monophyletic depending on the placement of the root within the unrooted network). Winclada running NONA was used for parsimony analysis, with 10000 replications, holding 100 starting trees per repetition, and all other parameters set to defaults.
Results
Parsimony analysis
For the DiatStram dataset, eleven runs totaling 2898 random taxon addition repetitions were required to converge on the representative set of MP trees (L = 39822, c.i. = 0.12, r.i. = 0.84). We found 22 unique MP trees on the first run. Their strict consensus collapsed 441 nodes. Eight more runs produced 54 more MP trees for a total of 76 trees. However, 11 of these were duplicates and there were only 65 unique MP trees. Their strict consensus collapsed 450 nodes or only 9 more than collapsed in the first single run. That we found redundant trees and the reduced yield in topological diversity suggest that we have found the true diversity of all MP trees that could be obtained from the DiatStram dataset (Fig. 1).
For the DiatBo dataset, three runs of 500 random addition sequences seemed to converge on the representative set of MP trees. The strict consensus of the first 139 trees of L=14094 (c.i. = 0.19, r.i. = 0.84) collapsed 287 nodes, that of the 338 trees of the first and second runs collapsed 288 nodes, and that of the 554 trees of the all three runs combined collapsed 288 nodes. In each of the runs, an MP tree was found within the first 18 random additions indicating that TNT was finding at least one tree of optimal topology very early in the analysis. In addition, 51 of the 554 total trees were identical to trees previously found, indicating that there was some redundancy in the coverage of tree space. Thus, we believe Fig. 2 well represents the strict consensus of all equally MP cladograms that might be found in the DiatBo dataset.
Unconstrained searches in both analyses resulted in nonmonophyly for the classes Coscinodiscophyceae and Mediophyceae, and monophyly for the class Bacillariophyceae. In both, the Coscinodiscophyceae was positively paraphyletic (i.e., fully resolved as a ladder-like grade with no polytomies) with Melosirales the sister clade to a non-monophyletic Mediophyceae plus a monophyletic Bacillariophyceae. The Mediophyceae was positively paraphyletic in the DiatStram analysis, with Chaetoceros and a few other taxa forming a clade sister to the pennates. In the DiatBo analyses, relationships among Mediophyceae were an unresolved polytomy.
Monophyly of the Coscinodiscophyceae and Mediophyceae (i.e., the CMB hypothesis) required little penalty for either large dataset: the CMB hypothesis was only 7 steps longer than the unconstrained MP trees for the DiatStram dataset and 10 steps longer for the DiatBo dataset. Arrangements of terminal taxa were similar for results for both datasets, and only the tree for the DiatBo dataset is shown (Fig. 3).
Given the relatively low penalty incurred for transforming any optimal tree into the CMB hypothesis, it is not surprising that the BS values along the backbone of the tree were generally quite low. The Bacillariophyceae clade and the Mediophyceae plus Bacillariophyceae clade were the only two backbone nodes to receive BS support values of ≥90% for either dataset.
Parsimony analysis of M54, MK126 and MK281 datasets yielded similar results (trees not shown). The MP tree or trees rejected the CMB hypothesis, and bootstrap values along the backbone were typically less than 50%. The CMB constraint trees were not much longer than the MP trees: 4 steps longer for the M54 dataset (4530 versus 4526); 7 steps longer for the MK126 dataset (5633 versus 5626); and 23 steps longer for the MK281 data set (19302 versus 19325).
Bayesian analysis
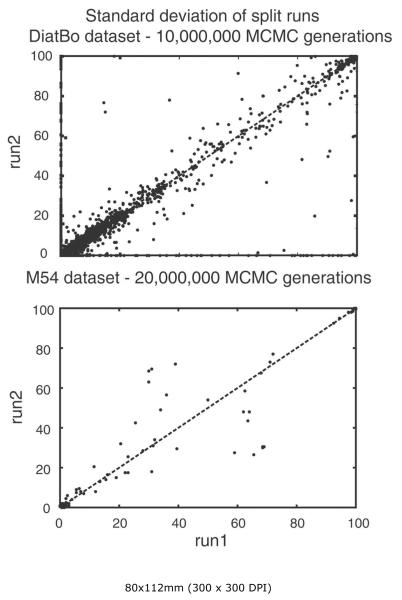
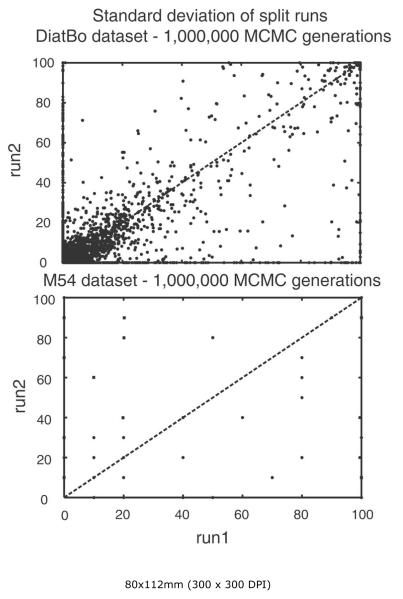
Analyses of 1,000,000 generations had clearly not converged on the same posterior distributions among independent runs in analyses of either the DiatBo or M54 datasets. Plots of bipartition posterior probability values between the first pair of runs for each of the two datasets showed many points (i.e., bipartitions) falling directly along the abscissa and ordinate, indicating that some clades found in one analysis (even at BPP values > 0.8) were not found at all in others. Further, convergence was not reached with 10,000,000 MCMC generations for the DiatBo dataset or even 20,000,000 MCMC generations for the M54 dataset (Fig. 5). For the DiatBo dataset, topological differences between runs were not minor. In the 10,000,000 generation analysis of DiatBo, Toxarium, Lampriscus, Biddulphiopsis and the Cymatosirales (Toxarium and allies) grouped with Lithodesmiales plus Thalassiosirales (BPP = 0.90) in one run, whereas Toxarium and allies were sister to pennates (BPP = 0.5) in another run. Several species of Pinnularia, a diatom placed in the raphid pennates in traditional classifications and in our MP analyses, were placed at the base of the diatom tree as sister to Leptocylindrus with BPP values of 0.88 and 0.98 in each of the two runs. While several of the 1,000,000 generation runs recovered a monophyletic Bacillariophyceae, the fact we did not recover the pennates in any of the 10,000,000 generation analyses clearly indicates that even our longest Bayesian runs were far short of convergence on the same topologies and same posterior probabilities.
Figure 5.
Bipartition partition probability plots of two runs (split runs) from the 10,000,000 MCMC generation Bayesian analysis of our diatom plus bolidophyte dataset (DiatBo: upper plot) and the 20,000,000 generation Medlin et al. (2008) dataset (M54: lower plot). 90% burn-in used for each.
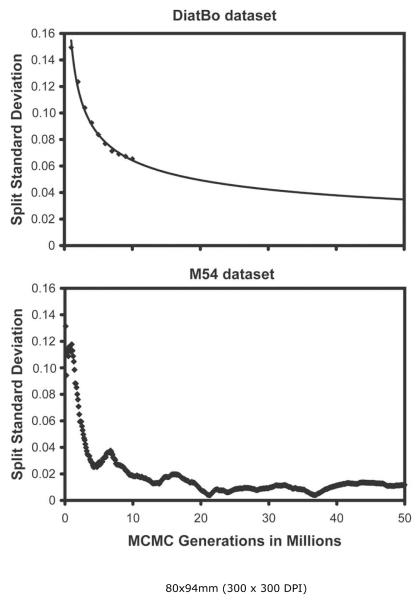
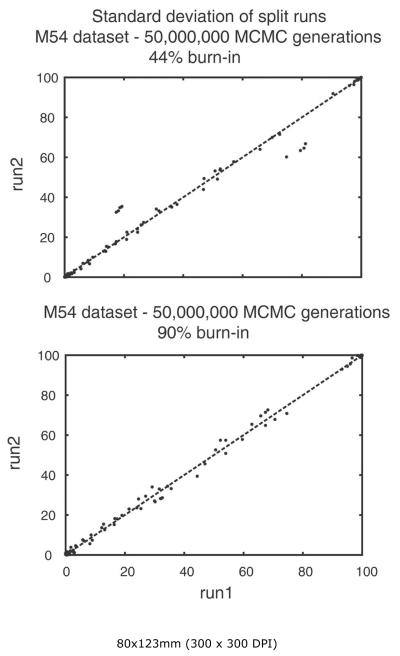
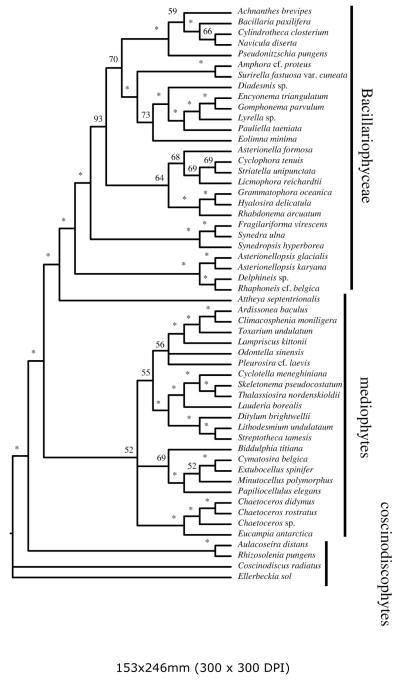
We analyzed aspects of performance of the M54 data set to obtain a gross estimate of how difficult it might be to reach convergence in a Bayesian analysis of several hundred diatom sequences. The standard deviation of bipartitions between independent runs for the M54 dataset dropped to near zero at about 22 million generations, and thereafter oscillated at ~0.1 until the analysis was terminated at 50,000,000 generations (Fig. 6). While this might suggest that convergence had been reached by 22 million generations, plotting the sampled trees for the last 28 million generations shows clusters of points off a straight line (Fig. 7). Discarding trees from the the first 45 million generations resulted in a BPP plot approximating a straight line. The majority rule consensus tree returns a convex Coscinodiscophyceae and monophyletic Bacillariophyceae, but the Mediophyceae were positively paraphyletic. Attheya septentrionalis was grouped with the pennates at a BPP of 0.95. This is the same placement of Attheya obtained from MP analysis. In fact, incongruence between the Bayesian and MP trees for dataset M54 are restricted to areas where the BPP values are below 0.70 (not shown).
Figure 6.
Standard deviation of likelihood scores among independent runs (split runs) versus number of generations for Bayesian analysis of our diatom plus bolidophyte (DiatBo) dataset (upper plot) and of the Medlin et al. (2008) dataset (M54: lower plot). The line in the upper plot represents a power function estimate of split standard deviations out to 50,000,000 MCMC generations.
Figure 7.
Bipartition probability plot of two runs from the M54 dataset of Medlin et al. (2008). The upper plot discarded the first 22 million MCMC generations (or 44% burn-in, based on initial minimum at ca. 22 million MCMC generations from Fig. 6). The lower plot discarded the first 45 million MCMC generations (or 90% burn-in).
Bayesian analyses of the intermediate-sized MK126 and MK281 datasets had also not converged on the same posterior probability distribution at 1,000,000 MCMC generations as judged by the still rapidly dropping split standard deviations (not shown), underscoring again the difficulty of completing a meaningful Bayesian analysis on even 100 diatom nSSU sequences in so few MCMC generations. Our analysis of the MK54 dataset indicates it might take as many as 50-100 million generations or more to reach convergence on datasets with 600 or more diatom SSU sequences.
Morphological tree
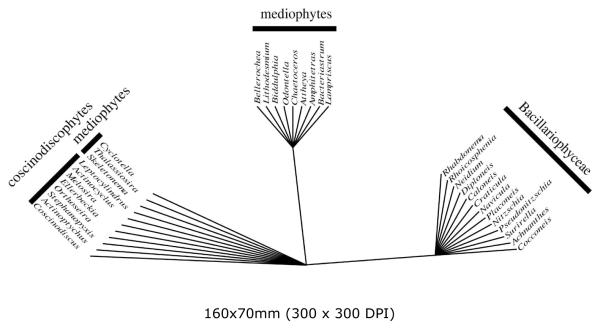
Seven trees of length = 9 were found. Only the pennates formed a convex group (meaning neither the Coscinodiscophyceae or Mediophyceae could be monophyletic, regardless of how the tree was rooted.) In the strict consensus, the Thalassiosirales were excluded from the remaining Mediophyceae (Fig. 9) because they share all the characteristics of the Coscinodiscophyceae (radial symmetry, globular/isometric auxospore shape/growth, and lack both a perizonium and properizonium), and have none of the features peculiar to other Mediophyceae or the Bacillariophyceae.
Figure 9.
Unrooted tree of diatom genera as determined by a parsimony analysis of the morphology matrix of Table 2 in Medlin (2004). Strict consensus of 8 trees.
Discussion
Our results weakly reject the hypothesis that the Coscinodiscophyceae, Mediophyceae, and Bacillariophyceae are each monophyletic (the CMB hypothesis.) Only the Bacillariophyceae (pennate diatoms) were monophyletic, whether we included only closely related outgroups (bolidophytes only) or distantly related outgroups (bolidophytes and all other stramenopiles). However, there is little parsimony penalty to constrain trees to the CMB hypothesis for all datasets.
Given that greatly different topologies can be obtained from SSU datasets with little penalty, it is not surprising that estimates of the diatom phylogeny based on SSU sequences vary widely between studies using different taxa, alignments, and optimality criteria. For example, the few studies hinting at the possibility of a monophyletic Coscinodiscophyceae and paraphyletic Mediophyceae or vice versa used relatively few diatom SSU sequences. Medlin et al. (1993), very early in the use of SSU data in diatom systematics, returned a monophyletic Coscinodiscophyceae included only three Coscinodiscophyceae and one member of the Mediophyceae among 11 diatoms. Medlin et al. (1996a, 1996b) used 29 diatom SSU sequences, and returned a monophyletic Coscinodiscophyceae and paraphyletic Mediophyceae. Kooistra & Medlin (1996) analyzed that same data set, experimenting with various approaches to dealing with the potential long-branch problem introduced by “aberrantly evolving” diatoms; each approach returned a monophyletic Coscinodiscophyceae and paraphyletic Mediophyceae, although relationships within mediophytes were dependent upon method used. Kooistra et al. (2003) used 38 diatom SSU sequences, only two of which were Coscinodiscophyceae, both of which were on long branches, returning a monophyletic Coscinodiscophyceae and paraphyletic Mediophyceae. Using 51 diatom SSU sequences, Chepurnov et al. (2008) also returned a monophyletic Coscinodiscophyceae and paraphyletic Mediophyceae. However, they only ran 4,000,000 MCMC generations, so it is unclear if they had reached convergence of topology and posterior probabilities.
In contrast, Cavalier-Smith & Chao (2006), focusing not on diatoms but on a wide range of protists including diatoms, used a wide range of outgroups but only 32 diatom SSU sequences in a distance (neighbor-joining) analysis. While they found moderate (70%) BS support for monophyly of the Mediophyceae, they also found a paraphyletic Coscinodiscophyceae, with the internode excluding Melosirales from other Coscinodiscophyceae receiving support slightly higher than that found for a monophyletic Mediophyceae (BS=72%). In perhaps the most extreme case of taxon sampling effects, Van de Peer et al. (1996) in studying relationships among alveolates and stramenopiles, returned monophyly for the centric diatoms as a whole, using eleven diatom exemplars.
It is not just monophyly (or not) of the centrics, the Coscinodiscophyceae or Mediophyceae that have proven unstable as in different analyses of SSU. Three studies, which each included more than 100 diatom sequences, offer the opportunity to compare trees calculated under a single optimality criterion (Bayesian inference). A comparison of results shows that taxon sampling differences alone may account for very different tree topologies. The Lithodesmiales were grouped with the Thalassiosirales at BPP = 1.0 when including 123 diatoms (Medlin & Kaczmarska, 2004), with the Hemiaulales to the exclusion of the Thalassiosirales at BPP = 1.0 with 181 diatom SSU sequences (Alverson et al., 2006), and with the Biddulphiales, Triceratiales and Toxarium to the exclusion of the Thalassiosirales at BPP = 1.0 with an unknown number of diatom sequences (Sims et al., 2006). The still unpublished dataset of Figure 2 of Sims et al. (2006) has been characterized as including more than 800 ingroup sequences (Medlin et al., 2008). Finally, we note that alignment methods have varied greatly among the many studies using SSU sequences and could be a possible source of variation that has yet to be fully explored, but has been shown to potentially radically change diatom SSU tree topology (Medlin et al., 2008).
Among the many trees generated using SSU, the most radical and controversial trees (Williams & Kociolek, 2007), are those that support the CMB hypothesis: the MP tree of 8600+ SSU sequences (including 123 diatoms) by Medlin & Kaczmarska (2004),the Bayesian tree of the 800+ diatom sequences (with bolidophyte outgroups) by Sims et al. (2006), and the Bayesian tree of 54 diatom SSU sequences (with no outgroup) by Medlin et al. (2008).
Medlin & Kaczmarska (2004) claimed that their MP tree (based on 8600+ sequences of which only 123 were diatoms) was more accurate than their Bayesian tree (with the same 123 diatoms but only 3 bolidophyte SSU sequences as the outgroup) because including distantly related outgroups increased the number of parsimony informative characters. However, while increased taxon sampling within the scope of the problem (within diatoms) may increase accuracy, increased taxon sampling outside the scope of the problem (adding distant outgroups) will likely decrease accuracy of phylogenetic inference (Hillis, 1998; Pollock et al., 2002; Hillis et al., 2003; Hedtke et al., 2006; Verbruggen & Theriot, 2008). Medlin & Kaczmarska (2004) cited Bollback (2002) as support for their position, but that paper is irrelevant to this problem, as it studied effects of adding characters only, not taxa (whether ingroup or outgroup) and only in the context of model-based methods, specifically accuracy of selection of models for phylogenetic analysis. Thus, contrary to the claims of Medlin & Kaczmarska (2004), one may well hypothesize that recovery of the CMB tree under parsimony was actually an artifact of increased error caused by addition of distantly related outgroup taxa. In light of the literature on taxon sampling, a more substantive claim was that made by Sims et al. (2006), who suggested that increased ingroup sampling led to recovery of the CMB hypothesis, this time with high BPP support values.
We suggest, however, that recovery of the CMB hypothesis in Medlin & Kaczmarska (2004), Sims et al. (2006) and Medlin et al. (2008), in each case, likely resulted from insufficient tree search effort. Medlin & Kaczmarska (2004) used the MP search in ARB, whose most effective heuristic search algorithm employs a combination of Nearest Neighbor Interchange and Kernighan-Lin optimization, which together are less effective than the commonly used Tree-Bisection-Reconnection algorithm, and certainly not as effective as other methods available, such as the parsimony ratchet (Nixon, 1999). Given the large number of near-optimal trees that contain the CMB hypothesis in our dataset, it is likely that a suboptimal search might find any one of these suboptimal trees. Similarly, the Bayesian inference of Sims et al. (2006) was also probably confounded by insufficient search of tree space. They only ran 1,000,000 MCMC generations. Our analysis of our DiatBo dataset (673 diatoms plus 7 bolidophytes) had not reached convergence at 10,000,000 generations. Our analysis of the M54 dataset, presumably the same alignment but with far fewer taxa than used by Sims et al. (2006), seems to have required at least 45 million generations for the burn-in alone. The tree of Figure 1A of Medlin et al. (2008), supporting the CMB hypothesis, is clearly an artifact of running far too few MCMC generations. Even if that tree topology is correct, the monophyly of the Coscinodiscophyceae is an artifact of arbitrary rooting because no outgroup was used.
Thus, our results strongly suggest that the choice of optimality criterion has less influence on trees derived from SSU data than does the proper application of that choice. All methods, all alignments, and all taxon sampling schemes we reviewed or reanalyzed here returned weak rejection of the CMB hypothesis.
Both Medlin & Kaczmarska (2004) and Sims et al. (2006) argued that morphological data were congruent with their SSU trees. However, the characters discussed are either irrelevant to testing the CMB hypothesis, or ambiguous about it (e.g., spermatozoid structure [the Coscinodiscophyceae and Mediophyceae each have both merogenous and hologenous spermatozoids]; pyrenoid structure [one type is apparently symplesiomorphically shared by the Coscinodiscophyceae and Mediophyceae with the exception of Thalassiosirales whose pyrenoid structure is autapomorphic for the order.]) Our tree calculated from the Medlin & Kaczmarska (2004) morphological character matrix excluded the Thalassiosirales from the Mediophyceae on the basis of auxospore characteristics. Nevertheless it was claimed that the particular pattern of auxospore formation under discussion was retained in the Thalassiosirales (Medlin & Kaczmarska, 2004, page 267). To make this argument under parsimony, the Thalassiosirales would have to be the sister group to all other remaining Mediophyceae, a relationship not recovered in either Medlin & Kaczmarska (2004) or Sims et al. (2006).
Complicated scenarios are invoked ad hoc to explain the distribution of the four different Golgi body arrangements. Of the two widely distributed arrangements, the so-called Type 1 (sensu Medlin & Kaczmarska, 2004) arrangement was attributed to most of the Coscinodiscophyceae, and the Type 2 arrangement was attributed to the Aulacoseirales (of the Coscinodiscophyceae), Mediophyceae, and Bacillariophyceae. If Type 1 is apomorphic and Type 2 is not, then there is no evidence from the Golgi arrangement that Aulacoseirales belong to the Coscinodiscophyceae. If Type 2 is apomorphic, regardless of the interpretation of Type 1, the Golgi character actually is congruent with our SSU trees and rejects the CMB hypothesis by placing the Aulacoseirales with the Mediophyceae and Bacillariophyceae. Nevertheless, Medlin & Kaczmarksa (2004) argued away this incongruence, explaining the distribution of Golgi body types in terms of ancestral polymorphisms, implicitly invoking unobserved character conditions in unobserved ancestral species for as far back as the common ancestor to red algae and diatoms (Medlin & Kaczmarska, 2004, p. 265): “However, GER-M units are known from the oomycetes and the red algae, whereas an association of the Golgi around the nucleus is also known in the Labyrinthuloides. Thus, it would appear that both features are present in ancestors of the diatoms and the potential host cells of their plastids. It can be argued that the two traits then segregated themselves in the two separate lineages as they evolved.”
Conclusion
Medlin & Kaczmarska (2004) and Sims et al. (2006) proposed monophyly of each of the Coscinodiscophyceae, Mediophyceae, and Bacillariophyceae. Unavailability of the datasets, the only besides that of Medlin et al. (2008) to support the CMB hypothesis, precludes direct reproduction of their results. Thus we assembled datasets of similar size and characteristics. Our results suggest that the CMB hypothesis is rejected by SSU data, albeit very weakly. Similarly, our reanalysis of morphological evidence proposed by Medlin & Kaczmarska (2004) also weakly rejects the CMB hypothesis. Medlin & Kaczmarska (2004) very likely recovered a suboptimal MP tree for their 8600+ sequence data set. Sims et al. (2006) very likely failed to converge on the true posterior distribution of trees in their Bayesian analysis. Conversely, if Medlin & Kaczmarska (2004) did recover the MP tree or trees, and if the Sims et al. (2006) analysis did reach convergence for their dataset, then results presented here demonstrate that the likelihood of their having done so is highly dependent on taxon sampling and/or sequence alignment. We demonstrated that the Medlin et al. (2008) tree supporting the CMB hypothesis was an artifact. Thus, it can only be concluded that the CMB hypothesis is far from robust, regardless of how one interprets the variation between studies.
In summary, pursuit of a well-supported phylogeny of diatoms seems to be as much limited by the quantity of characters per taxon as by the number of taxa for which data exist. There is a small but growing rbcL dataset which rejects the CMB hypothesis (Choi et al., 2008). Very limited coxI data supports the CMB hypothesis, but analyses so far included but 4 species (Ehara et al., 2000). While nSSU data are a useful addition to the difficult problem of inferring the diatom phylogeny, further use of SSU alone, as Patterson (1994, p. 185) wrote in a similar context, might simply be an ineffective attempt to: “… wring truth from recalcitrant data.”
Figure 4.
Bipartition partition probability plots of two runs (split runs) from the 1,000,000 MCMC generation Bayesian analysis of our diatom plus bolidophyte dataset (DiatBo: upper plot) and of the Medlin et al. (2008) dataset (M54: lower plot). 90% burn-in used for each.
Figure 8.
Majority rule consensus tree (calculated without an outgroup and arbitrarily rooted in the middle of the Coscinodiscophyceae) derived from 50,000,000 MCMC generation Bayesian analysis of the M54 dataset from Medlin et al. (2008) with 90% burn-in. Numbers or symbols below nodes are BPP values. Stars = BPP values ≥ 95%.
Acknowledgements
ECT was supported by NSF EF 0629410 and the Jane and Roland Blumberg Centennial Professorship in Molecular Evolution. AJA was supported by an NIH Ruth L. Kirschstein NRSA Postdoctoral Fellowship (1F32GM080079-01A1). Both also acknowledge the Tony Institute. RRG and JJC were supported by NIH GM067317.
References
- ADL SM, SIMPSON AGB, FARMER MA, ANDERSEN RA, ANDERSON OR, BARTA JR, BOWSER SS, BRUGEROLLE GUY, FENSOME RA, FREDERICQ S, JAMES TY, KARPOV S, KUGRENS P, KRUG J, LANE CE, LEWIS LA, LODGE J, LYNN DH, MANN DG, MCCOURT RM, MENDOZA L, MOESTRUP O, MOZLEY-STANDRIDGE SE, NERAD TA, SHEARER CA, SMIRNOV AV, SPIEGEL FW, TAYLOR MFJR. The New Higher Level Classification of Eukaryotes with Emphasis on the Taxonomy of Protists. The Journal of Eukaryotic Microbiology. 2005;52(5):399–451. doi: 10.1111/j.1550-7408.2005.00053.x. [DOI] [PubMed] [Google Scholar]
- ALVERSON AJ, CANNONE JJ, GUTELL RR, THERIOT EC. The evolution of elongate shape in diatoms. Journal of Phycology. 2006;42(3):655–668. [Google Scholar]
- ALVERSON AJ, JANSEN RK, THERIOT EC. Bridging the Rubicon: Phylogenetic analysis reveals repeated colonizations of marine and fresh waters by thalassiosiroid diatoms. Mol. Phylogenet. Evol. 2007;45(1):193–210. doi: 10.1016/j.ympev.2007.03.024. [DOI] [PubMed] [Google Scholar]
- ALVERSON AJ, THERIOT EC. Comments on recent progress toward reconstructing the diatom phylogeny. Journal of Nanoscience and Nanotechnology. 2005;5(1):57–62. doi: 10.1166/jnn.2005.007. [DOI] [PubMed] [Google Scholar]
- ANDERSEN RA. Biology and systematics of heterokont and haptophyte algae. American Journal of Botany. 2004;91(10):1508–1522. doi: 10.3732/ajb.91.10.1508. [DOI] [PubMed] [Google Scholar]
- BOLLBACK JP. Bayesian model adequacy and choice in phylogenetics. Molecular Biology Evolution. 2002;19(7):1171–1180. doi: 10.1093/oxfordjournals.molbev.a004175. [DOI] [PubMed] [Google Scholar]
- CANNONE JJ, SUBRAMANIAN S, SCHNARE MN, COLLETT JR, D’SOUZA LM, DU Y, FENG B, LIN N, MADABUSI LV, MULLER KM, PANDE N, SHANG Z, YU N, GUTELL RR. The Comparative RNA Web (CRW) Site: an online database of comparative sequence and structure information for ribosomal, intron, and other RNAs. BMC Bioinformatics. 2002;3:2. doi: 10.1186/1471-2105-3-2. [DOI] [PMC free article] [PubMed] [Google Scholar]
- CAVALIER-SMITH T, CHAO E. Phylogeny and megasystematics of phagotrophic heterokonts (Kingdom Chromista) J. Mol. Evol. 2006;62(4):388–420. doi: 10.1007/s00239-004-0353-8. [DOI] [PubMed] [Google Scholar]
- CHEPURNOV VA, MANN DG, VON DASSOW P, VANORMELINGEN P, GILLARD J, INZÉ D, SABBE K, VYVERMAN W. In search of new tractable diatoms for experimental biology. BioEssays. 2008;30:692–702. doi: 10.1002/bies.20773. [DOI] [PubMed] [Google Scholar]
- CHOI H-G, JOO HM, JUNG W, HONG SS, KANG J-S, KANG S-H. Morphology and phylogenetic relationships of some psychrophilic polar diatoms (Bacillariophyta) Nova Hediwigia Beihefte. 2008;133:7–30. [Google Scholar]
- DAUGBJERG N, ANDERSEN RA. A molecular phylogeny of the heterokont algae based on analyses of chloroplast-encoded rbcL sequence data. Journal of Phycology. 1997;33(6):1031–1041. [Google Scholar]
- EHARA M, INAGAKI Y, WATANABE KI, OHAMA T. Phylogenetic analysis of diatom coxI genes and implications of a fluctuating GC content on mitochondrial genetic code evolution. Curr Genet. 2000;37(1):29–33. doi: 10.1007/s002940050004. [DOI] [PubMed] [Google Scholar]
- GOERTZEN LR, THERIOT EC. Effect of taxon sampling, character weighting, and combined data on the interpretation of relationships among the heterokont algae. Journal of Phycology. 2003;39(2):423–439. [Google Scholar]
- GOLOBOFF P, FARRIS J, NIXON K. T.N.T.: Tree analysis using new technology. 2003 www.cladistics.com.
- GUTELL RR, LEE JC, CANNONE JJ. The accuracy of ribosomal RNA comparative structure models. Current Opinion in Structural Biology. 2002;12(3):301–310. doi: 10.1016/s0959-440x(02)00339-1. [DOI] [PubMed] [Google Scholar]
- GUTELL RR, POWER A, HERTZ GZ, PUTZ EJ, STORMO GD. Identifying constraints on the higher-order structure of RNA: continued development and application of comparative sequence analysis methods. Nucleic Acids Research. 1992;20(21):5785–5795. doi: 10.1093/nar/20.21.5785. [DOI] [PMC free article] [PubMed] [Google Scholar]
- GUTELL RR, WEISER B, WOESE CR, NOLLER HF. Comparative anatomy of 16S-like ribosomal RNA. Progress in Nucleic Acid Research and Molecular Biology. 1985;32:155–216. doi: 10.1016/s0079-6603(08)60348-7. [DOI] [PubMed] [Google Scholar]
- HEDTKE S, TOWNSEND T, HILLIS D. Resolution of phylogenetic conflict in large data sets by increased taxon sampling. Systematic Biology. 2006;55(3):522–529. doi: 10.1080/10635150600697358. [DOI] [PubMed] [Google Scholar]
- HILLIS DM. Taxonomic sampling, phylogenetic accuracy and investigator bias. Systematic Biology. 1998;47(1):3–8. doi: 10.1080/106351598260987. [DOI] [PubMed] [Google Scholar]
- HILLIS DM, POLLOCK DD, MCGUIRE JA, ZWICKL DJ. Is sparse taxon sampling a problem for phylogenetic inference? Systematic Biology. 2003;52(1):124–126. doi: 10.1080/10635150390132911. [DOI] [PMC free article] [PubMed] [Google Scholar]
- KOOISTRA W, DE STEFANO M, MANN DG, SALMA N, MEDLIN LK. Phylogenetic position of Toxarium, a pennate-like lineage within centric diatoms (Bacillariophyceae) Journal of Phycology. 2003;39(1):185–197. [Google Scholar]
- KOOISTRA WHCF, MEDLIN LK. Evolution of the diatoms (Bacillariophyta): IV. A reconstruction of their age from small subunit rRNA coding regions and the fossil record. Mol. Phylogenet. Evol. 1996;6(3):391–407. doi: 10.1006/mpev.1996.0088. [DOI] [PubMed] [Google Scholar]
- MEDLIN LK, KACZMARSKA I. Evolution of the diatoms V: Morphological and cytological support for the major clades and a taxonomic revision. Phycologia. 2004;43(3):245–270. [Google Scholar]
- MEDLIN LK, KOOISTRA WHCF, GERSONDE R, WELLBROCK U. Evolution of the diatoms (Bacillariophyta): II. Nuclear-encoded small-subunit rRNA sequence comparisons confirm a paraphyletic origin for the centric diatoms. Mol. Biol. Evol. 1996a;13(1):67–75. doi: 10.1093/oxfordjournals.molbev.a025571. [DOI] [PubMed] [Google Scholar]
- MEDLIN LK, KOOISTRA WHCF, GERSONDE R, WELLBROCK U. Evolution of the diatoms (Bacillariophyta): III. Molecular evidence for the origin of the Thalassiosirales. Nova Hedwigia Beiheft. 1996b;112:221–234. [Google Scholar]
- MEDLIN LK, KOOISTRA WHCF, SCHMID A-MM. A review of the evolution of the diatoms–a total approach using molecules, morphology and geology. In: WITKOWSKI A, SIEMINSKA J, editors. The Origin and Early Evolution of the Diatoms: Fossil, Molecular and Biogeographical Approaches. Szafer Institute of Botany, Polish Academy of Sciences; Kraków: 2000. pp. 13–36. [Google Scholar]
- MEDLIN LK, SATO S, MANN DG, KOOISTRA WHCF. Molecular evidence confirms sister relationship of Ardissonea, Climacosphenia and Toxarium within the bipolar centric diatoms (Bacillariophyta, Mediophyceae), and cladistic analyses confirm that extremely elongate shape has arisen twice in the diatoms. Journal of Phycology. 2008;48 doi: 10.1111/j.1529-8817.2008.00560.x. [DOI] [PubMed] [Google Scholar]
- MEDLIN LK, WILLIAMS DM, SIMS PA. The evolution of the diatoms (Bacillariophyta). I. Origin of the group and assessment of the monophyly of its major divisions. Eur. J. Phycol. 1993;28(4):261–275. [Google Scholar]
- NIXON K. The parsimony ratchet, a new method for rapid parsimony analysis. Cladistics. 1999;15:407–414. doi: 10.1111/j.1096-0031.1999.tb00277.x. [DOI] [PubMed] [Google Scholar]
- NYLANDER JAA. Program distributed by the author. Evolutionary Biology Centre, Uppsala University; 2004. MrModeltest v2. [Google Scholar]
- PATTERSON C. Null or minimal models. In: SCOTLAND R, SIEBERT DJ, WILLIAMS DM, editors. Models in phylogeny reconstruction. Oxford University Press; Oxford: 1994. pp. 173–192. [Google Scholar]
- POLLOCK DD, ZWICKL DJ, MCGUIRE JA, HILLIS DM. Increased taxon sampling is advantageous for phylogenetic inference. Systematic Biology. 2002;51:664–671. doi: 10.1080/10635150290102357. [DOI] [PMC free article] [PubMed] [Google Scholar]
- ROUND FE, CRAWFORD RM, MANN DG. The Diatoms: Biology & Morphology of the Genera. Cambridge University Press; Cambridge: 1990. [Google Scholar]
- SIMONSEN R. The diatom system: Ideas on phylogeny. Bacillaria. 1979;2:9–71. [Google Scholar]
- SIMS PA, MANN DG, MEDLIN LK. Evolution of the diatoms: insights from fossil, biological and molecular data. Phycologia. 2006;45(4):361–402. [Google Scholar]
- SORHANNUS U. Diatom phylogenetics inferred based on direct optimization of nuclear-encoded SSU rRNA sequences. Cladistics. 2004;20(5):487–497. doi: 10.1111/j.1096-0031.2004.00034.x. [DOI] [PubMed] [Google Scholar]
- SORHANNUS U. A nuclear-encoded small-subunit ribosomal RNA timescale for diatom evolution. Mar Micropaleontol. 2007;65(12):1–12. [Google Scholar]
- VAN DE PEER Y, VAN DER AUWERA G, DE WACHTER R. The evolution of stramenopiles and alveolates as derived by “substitution rate calibration” of small ribosomal subunit RNA. J. Mol. Evol. 1996;42(2):201–210. doi: 10.1007/BF02198846. [DOI] [PubMed] [Google Scholar]
- VERBRUGGEN H, THERIOT EC. Building trees of algae: Some advances in phylogenetic and evolutionary analysis. Eur. J. Phycol. 2008;43(3):229–252. [Google Scholar]
- WILGENBUSCH JC, WARREN DL, SWOFFORD DL. AWTY: A system for graphical exploration of MCMC convergence in Bayesian phylogenetic inference. 2004 doi: 10.1093/bioinformatics/btm388. http://ceb.csit.fsu.edu/awty. In. [DOI] [PubMed]
- WILLIAMS DM, KOCIOLEK JP. Pursuit of a natural classification of diatoms: History, monophyly and the rejection of paraphyletic taxa. Eur. J. Phycol. 2007;42(3):313–319. [Google Scholar]


