Abstract
Small animal imaging of cardiovascular disease using single photon emission tomography (SPECT) can be used to provide quantitative measurements of myocardial infarct. The purpose of this study was to demonstrate the accuracy of pinhole SPECT imaging with [99mTc]sestamibi for estimation of infarct size in a rat model of coronary artery disease. Nine rats had their left anterior descending artery ligated to induce a region of myocardial infarct. These animals were injected with 37 MBq [99mTc]sestamibi, and, 1 h later, scanned on a pinhole SPECT system for 30 min. The defect size measured with SPECT, which was dependent on a threshold applied to the short axis circumferential profiles, was compared against the gold standard triphenyltetrazolium chloride (TTC) staining. The size of the perfusion deficit measured using [99mTc]sestamibi SPECT compared very favorably with the TTC staining result, for threshold values in the range 50–70%. The optimum threshold was approximately 70%, giving an excellent correlation (R2=0.89, p<0.001). Estimation of infarct size by [99mTc] sestamibi SPECT yielded an excellent agreement with TTC staining. In conclusion, measurement of myocardial infarct with SPECT can be used to study the rat heart in vivo, and provides a quantitative measure of myocardial viability.
Keywords: ischemia, myocardium, pinhole SPECT, rat, sestamibi, triphenyltetrazolium chloride staining
Introduction
Molecular imaging of small animals, such as mice and rats, using high resolution single photon emission tomography (SPECT) [1, 2], is becoming a valuable tool to study animal models of human disease in vivo. Previously, we have demonstrated accurate quantification of the dopaminergic system in the mouse brain [1, 2], and studied the quantitative expression of a reporter gene [3], using a pinhole SPECT system. In this work, we aim to extend these studies into the heart, to demonstrate that small animal SPECT is capable of accurate, quantitative estimation of myocardial infarct size in rats with relatively high resolution.
Animal models of myocardial infarct have provided many clues to the underlying mechanisms of heart disease, and may be useful for preclinical evaluation of treatments such as new drugs, gene therapy [4], and stem cell implantation [5]. SPECT imaging of myocardial perfusion, with tracers such as [99mTc]sestamibi, provides an accurate indicator of coronary artery disease, but only provided the data are quantitative, and are an accurate representation of the underlying state of the myocardium. In particular, in order to determine any changes in animal models of myocardial infarct during ventricular remodeling or in response to treatments, the imaging technique must give an accurate quantification of the size of perfusion deficit. This study aims to demonstrate the accuracy of pinhole SPECT imaging in a rat model of myocardial infarction using [99mTc]sestamibi, by comparing the defect size measured by SPECT against a gold standard staining technique.
Materials and methods
Rat model of myocardial infarction
All animal procedures were approved by the Institutional Animal Care and Use Committee (IACUC) of the University of Pennsylvania. Male Sprague-Dawley rats (6–8 weeks old, 220–250 gram) were purchased from Charles River Laboratories (Wilmington, MA). Animals were anesthetized by intraperitoneal (i.p.) injection of ketamine/xylazine (50/2.5 mg/kg). Animals were then incubated and ventilated through a small animal ventilator (Model 680, Harvard Apparatus, Holliston, MA). One percent isoflurane mixed with oxygen was used to maintain the anesthesia during surgery. The body temperature was maintained by a heating lamp. Electrocardiogram was monitored throughout the surgery. After opening the thoracic cavity and the pericardium, the left anterior descending (LAD) coronary artery was ligated by tying a piece of 6–0 silk suture around the vessel and the surrounding myocardium. A small piece of polyethylene tubing was used to perform the ligation without damaging the artery. The ligation was placed at different locations in each animal (e.g. proximal vs. distal) to provide a range of infarct sizes. Ligation was maintained in place for 45 min and LAD perfusion was then restored.
Pinhole SPECT imaging
All scans were performed on a Prism 3000XP triple headed gamma camera (Philips Medical Systems, Cleveland, OH), equipped with custom-made pinhole collimators (Nuclear Fields, Des Plaines, IL). All the images were reconstructed using 10 iterations of a cone-beam iterative simultaneous algebraic reconstruction technique (SART) with a correction for center-of-rotation error. Attenuation and scatter correction were not performed in any studies.
A total of nine infarcted animals, and three healthy controls, were scanned. Imaging was performed between 1 h and 6 h after surgery. Each rat was anesthetized with 1–1.5% isoflurane in 1 l/min oxygen, and injected with approximately 37 MBq [99mTc]sestamibi in the tail vein. The animal was allowed to recover from the anesthetic, then, 1 h after injection, the rat was anesthetized again and positioned in the scanner, and SPECT images were acquired for 30 min. Each detector head was fit with a 3 mm diameter tungsten pinhole – while this resulted in relatively poor spatial resolution, it maximized sensitivity. The radius of rotation was set to 4 cm (magnification 6), and data were acquired over 120 projections angles (360° for each head), 15 s per projection, giving a total acquisition time of 30 min. Projection data were acquired into a 128×128 matrix, with pixel size 3.56 mm. Images were reconstructed into a 128×128×128 array, giving high resolution images of voxel size 0.6 mm.
Triphenyltetrazolium chloride (TTC) staining
In the presence of intact dehydrogenase enzyme systems, 2,3,5-Triphenyltetrazolium chloride (TTC) forms red-colored precipitates while the infarcted area lacks dehydrogenase activity and therefore will not be stained. Powder of TTC (Sigma, St. Louis, MO) was dissolved in PBS to make TTC staining solution (1.5% w/v). Both TTC solution and saline were prewarmed to 37 °C.
Staining was performed 3 days after imaging, to allow the radioactivity to decay to background levels. After inducing the rat with i.p. injection of ketamine/acepromazine (50/5 mg/kg) the rat was euthanized. The heart was removed from the thoracic cavity and perfused retrograde through a cannula inserted in the ascending aorta with 6 ml pre-warmed saline followed by 6 ml 1.5% TTC solution [6]. The heart was then placed in a –80 °C freezer for 15 min. It was cut perpendicular to its long axis to approximately 1.5 mm thick slices. The right ventricles were carefully removed from each slice. The wet weight of each slice was determined. The slices were then placed side by side between two glass slides, which were scanned on both sides using a flatbed scanner (Epson, Long Beach, CA). Using image processing software (ImageJ, http://rsb.info.nih.gov/ij/), the infarcted area (nonstained pale white region) was measured on both sides and averaged for each slice, and summed from all slices. The infarction size was expressed as the fraction of the infarcted region relative to the size of the myocardium in all slices.
Image analysis
Reconstructed SPECT images were reoriented to give the conventional short-axis, and vertical and horizontal long-axis slices. The myocardium was divided into 10–14 short axis slices covering the entire heart from the base to the apex, and the extent of the perfusion deficit measured according to a published method [7], which has been validated previously in mice [8]. Each 0.6 mm thick slice had 64 circumferential profiles taken through the myocardium, with the origin at the center of the left ventricle. A plot of the maximum image intensity along each ray at each angle was generated for each slice, and the fraction of data points under a threshold value was determined. The defect size was measured as a fraction of the total myocardial volume, by weighting the fraction under the threshold by the volume of myocardium in each slice.
The profile threshold was varied to give the best agreement with the gold-standard TTC staining results. The fraction of the total myocardial volume taken up by the perfusion deficit in the SPECT data was plotted against the same measurement obtained using TTC staining, and the correlation coeffcient (R2) and linear regression equation determined for each threshold value. The optimum threshold value should give the maximum R2, and a regression equation with a slope of 1 and an intercept at 0.
Results
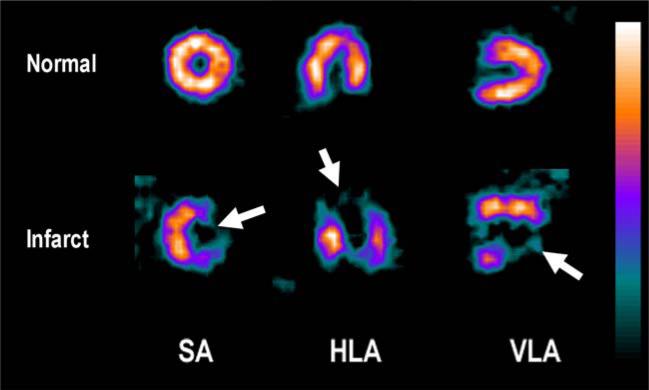
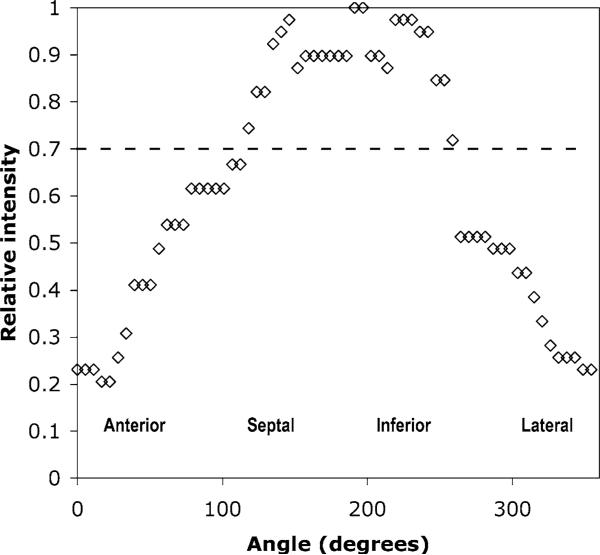
Good uptake of [99mTc]sestamibi in the rat myocardium was observed in all animals. Control animals had no observable region of deficit, while all infarcted animals exhibited reduced regional perfusion (Figure 1). Circumferential profiles across the rats with myocardial infarct demonstrated dramatic reductions in [99mTc]sestamibi binding corresponding to the region of tissue damaged by ligation of the LAD coronary artery (Figure 2).
Figure 1.
SPECT images of [99mTc]sestamibi uptake in the rat myocardium. The top row shows short axis (SA), horizontal long axis (HLA), and vertical long axis (VLA) views of a healthy rat. The bottom row shows the same views in a rat with a large infarct region, exhibiting dramatic reductions in [99mTc]sestamibi binding in the lesion (arrowed).
Figure 2.
Example of a circumferential profile across a short axis slice in the midventricular region in an infarct animal (the same animal as shown in the bottom row of Figure 1). The dashed line shows a 70% threshold for the definition of a lesion. According to this threshold level, the region of healthy tissue extends from 100° to 260°, with the remainder involved in the anteriolateral lesion.
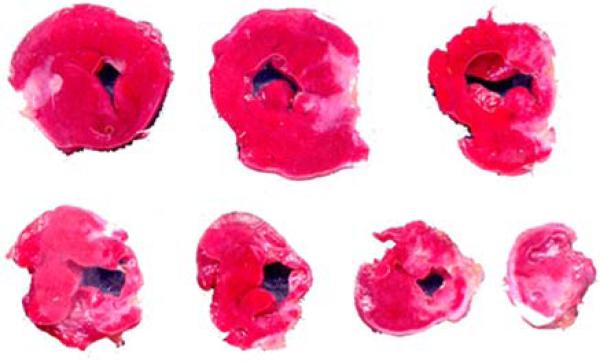
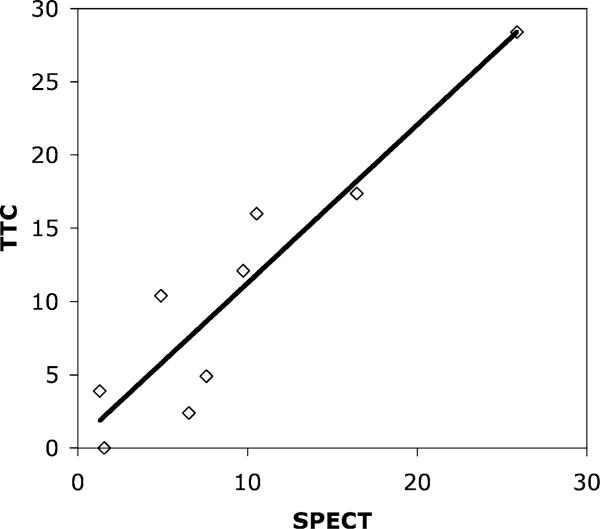
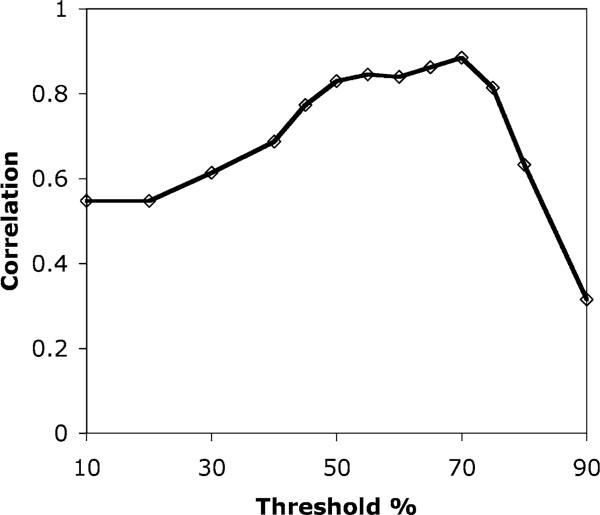
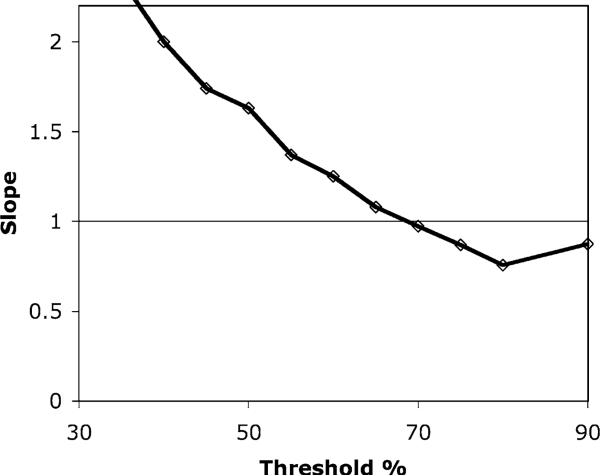
TTC staining of the rat myocardium showed large regions of damaged tissue (unstained) which corresponded with the deficits observed on the SPECT images (Figure 3). The size of the unstained region on the TTC data was compared to the defect size calculated from the SPECT images using the circumferential profiles (Figure 4). The threshold at which the SPECT data was considered to show a perfusion deficit was varied, and the defect size compared to the gold standard TTC staining measurement. The correlation coeffcient, R2, and slope of the regression equation were recorded as a function of the SPECT threshold (Figures 5 and 6). A fairly broad plateau in the plot of R2 existed in the range 50–70%, with a slight peak around 70% (R2=0.89, p<0.001). This was in agreement with the graph of the regression slope, which showed a value of 1 at a threshold of approximately 68%.
Figure 3.
TTC staining of rat myocardium (the same animal as shown in the bottom row of Figure 1), exhibiting a large region of infarct tissue (unstained by TTC).
Figure 4.
Example of the correlation between infarct size measured using SPECT imaging, and TTC staining, for a given threshold in the analysis of the SPECT data (threshold=70% in this example). Correlation coeffcient R2=0.89 (p<0.001). Slope of the regression equation is 0.97±0.15.
Figure 5.
Variation of correlation coeffcient (R2) with the threshold used in the analysis of the SPECT data. Higher values of R2 indicate a better correlation between the TTC staining and SPECT imaging results. A fairly broad plateau in the plot of correlation coeffcient exists in the range 50–70%, with a slight peak around 70%.
Figure 6.
Variation of the slope of the regression fit with the threshold used in the analysis of the SPECT data. A perfect agreement between SPECT and TTC staining results would give a gradient of 1.0 (shown as the horizontal line). The curve crosses this value at a threshold of approximately 68%, which is in good agreement with the optimum value of 70% determined from the correlation coeffcient measurement (Figure 5).
Discussion
The calculated size of the perfusion deficit measured using [99mTc]sestamibi SPECT compared very favorably with the gold standard TTC staining result, for a threshold value in the range 50–70%. The optimum threshold was approximately 70%, giving an excellent correlation (R2=0.89). The relatively low spatial resolution, and lack of cardiac gating, may have resulted in underestimation of the perfusion deficit. Also, it is noted that TTC staining indicated non-viable myocardium (infarction) while [99mTc]sestamibi signal indicates viable (maybe stunned) and perfused region. The strong correlation shown in this and other studies [8, 9] demonstrated that non-invasive imaging results can serve as a surrogate for quantification of the infarct size.
Similar studies in mice [8] gave a threshold of 50%, although this was optimized using a different method of analysis, and gave a good correlation between SPECT and autoradiography (R2=0.69), although the imaging data tended to underestimate the defect size, probably due to the much smaller size of the mouse heart compared to the rat. Other studies comparing SPECT and TTC staining in rats [9] used a 24% threshold directly on the SPECT images, rather than on the maximum intensity circumferential profiles. The correlation between SPECT and TTC staining results was slightly better (R2=0.95), although the defect sizes were considerably larger than those used in this study (approximately 20–60%, compared to 0–30%). In addition, both previous studies, in mice [8] and rats [9], used very large injected doses (up to 370 MBq, compared with 37 MBq in this study), which the authors recognized as a significant radiation dose. This study has specifically attempted to reduce the amount of radioactivity injected in the animals, and to limit the analysis to relatively small lesion sizes, to assess the accuracy of pinhole SPECT in smaller lesions.
Imaging of the rat myocardium gave excellent correlation between the perfusion deficit size measured with [99mTc]sestamibi SPECT, and the gold standard TTC staining result. Measurement of myocardial infarct with SPECT can be used to study the rat heart in vivo, and provides a quantitative measure of myocardial viability.
Acknowledgements
This research was supported by National Institutes of Health grants EB-002473 (RZ), and EB-001809 (PDA). DT is supported by American Heart Association grant 0425558U.
References
- 1.Acton PD, Choi SR, Plössl K, Kung HF. Quantification of dopamine transporter in mouse brain using ultra-high resolution single photon emission tomography. Eur J Nucl Med. 2002;29:691–698. doi: 10.1007/s00259-002-0776-7. [DOI] [PubMed] [Google Scholar]
- 2.Acton PD, Hou C, Kung MP, Plössl K, Keeney CL, Kung HF. Occupancy of dopamine D2 receptors in the mouse brain measured using ultra-high resolution single photon emission tomography and [123I]IBF. Eur J Nucl Med. 2002;29:1507–1515. doi: 10.1007/s00259-002-0903-5. [DOI] [PubMed] [Google Scholar]
- 3.Auricchio A, Acton PD, Hildinger M, Plössl K, Kung HF, Wilson JM. In vivo quantitative non-invasive imaging of gene transfer with single-photon emission computerized tomography. Hum Gene Ther. 2003;14:255–261. doi: 10.1089/10430340360535805. [DOI] [PubMed] [Google Scholar]
- 4.Kizana E, Alexander IE. Cardiac gene therapy: therapeutic potential and current progress. Curr Gene Therapy. 2003;3:418–451. doi: 10.2174/1566523034578249. [DOI] [PubMed] [Google Scholar]
- 5.Timmermans F, De Sutter J, Gillebert TC. Stem cells for the heart, are we there yet. Cardiology. 2003;100:176–185. doi: 10.1159/000074811. [DOI] [PubMed] [Google Scholar]
- 6.Ostrowski RP, Januszewski S, Kowalska Z, Kapuscinski A. Effect of endothelin receptor antagonist bosentan on plasma leptin concentration in acute myocardial infarction in rats. Pathophysiology. 2003;9:249–256. doi: 10.1016/s0928-4680(03)00028-2. [DOI] [PubMed] [Google Scholar]
- 7.O'Conner MK, Hammell T, Gibbons RJ. In vitro validation of a simple tomographic technique for estimation of percentage myocardium at risk using methoxyisobutyl isonitrile technetium 99 m (sestamibi). Eur J Nucl Med. 1990;17:69–76. doi: 10.1007/BF00819407. [DOI] [PubMed] [Google Scholar]
- 8.Wu MC, Gao DW, Sievers RE, Lee RJ, Hasegawa BH, Dae MW. Pinhole single photon emission computed tomography for myocardial perfusion imaging of mice. J Am Coll Cardiol. 2003;42:576–582. doi: 10.1016/s0735-1097(03)00716-2. [DOI] [PubMed] [Google Scholar]
- 9.Liu Z, Kastis GA, Stevenson GD, et al. Quantitative analysis of acute myocardial infarct in rat hearts with ischemia-reperfusion using a high resolution stationary SPECT system. J Nucl Med. 2002;43:933–939. [PMC free article] [PubMed] [Google Scholar]


