

Abstract
Foveal-sparing scotomas are common in advanced dry macular degeneration (geographic atrophy). Foveal preservation may be present for a number of years. Despite good visual acuity, these patients have reduced reading rates. Magnification may not be effective if the text becomes too large to “fit” within the central spared area.
When one thinks about low vision associated with macular degeneration, one typically thinks about patients with central scotomas (blind spots) and poor visual acuity. Magnification is a critical factor in allowing the patients to resume reading, as are increasing contrast and improving lighting. However, there is a group of patients with geographic atrophy (GA), the advanced form of dry age-related macular degeneration (AMD), who have good acuity, yet have significant difficulty with tasks that are dependent on good central vision, including reading and recognizing faces. These patients have scotomas in the central field, but have central sparing that is partially or completely surrounded by scotomas.
Many of these patients attain visual acuities of 20/40 or better when reading single letters, but have great difficulty reading because a full word may not “fit” in the small area that is surrounded by the scotoma (Sunness et al., 1997). They have difficulty going from line to line. Some patients with central sparing and good acuity report what seems like a paradoxical symptom: They can read newsprint but are unable to read the large headlines (Sunness, in press-a) because the large letter cannot fit in the spared area. When testing these patients' visual acuity, an examiner may report the acuity as 20/400 because the patients may not be able to read the 20/200 line, but if the patients are asked to read smaller print, the examiner may find their acuity to be 20/50. Alternatively, the examiner may notice that a patient's reading rate actually improves with smaller text relative to larger text.
Patients with good visual acuity with scotomas encroaching on the center pose special problems in low vision rehabilitation. They often require some magnification because their acuity is somewhat reduced, but too much magnification makes things more difficult and is counterproductive because it puts more of the word onto the blind area. For these patients, a closed-circuit television (CCTV) that does not go down to low levels of magnification will often not be helpful.
In one large low vision practice, almost 20% of the patients had a macular ring scotoma; that is, the fovea was bounded on all sides by a scotoma (Fletcher & Schuchard, 1997). The chief cause of scotomas with central sparing is GA, the advanced dry form of AMD. The factors accounting for the preservation of the fovea in atrophic disorders are not well understood, but foveal preservation is also present in a number of other conditions, including Stargardt disease, cone dystrophy, central areolar choroidal dystrophy, and plaquenil toxicity (Gass, 1997). In GA, central scotomas correspond to areas that have developed atrophy, with a loss of retinal pigment epithelium, the overlying photoreceptors, and the underlying choriocapillaris (Green & Enger, 1993; Sarks, Sarks, & Killingsworth, 1988). These areas are easily detected by ophthalmoscopy by their lack of pigmentation, the visibility of the underlying choroidal vessels, and their loss of retinal thickness. In many cases of GA, the process begins with focal areas of atrophy near, but not in, the foveal region. Over time, these atrophic areas enlarge and coalesce, forming a horseshoe of atrophy surrounding the spared foveal center (Maguire & Vine, 1986; Sarks et al., 1988; Schatz & McDonald, 1989; Sunness et al., 2007; Sunness et al., 1997) The horseshoe may then close off to become a ring of atrophy surrounding the spared fovea. Eventually, foveal atrophy develops, and the patient must adopt an eccentric locus of fixation to see the object of interest. This process may take a number of years to evolve. Forty percent of eyes with GA and a visual acuity of 20/50 or better have a three-line loss of Early Treatment Diabetic Retinopathy Study (ETDRS) visual acuity (doubling of the visual angle) by two years following diagnosis, and the visual acuity of 27% of affected eyes worsens to 20/200 or worse within four years (Sunness, Gonzalez-Baron et al., 1999).
A large prospective natural history study of GA, funded by the National Institutes of Health, was conducted between 1992 and 2000 at the Wilmer Eye Institute. This article reports the findings of the study in terms of the prevalence of scotomas with central sparing, the reading difficulties experienced by these patients, the progression of impairment of the patients' reading rates and acuity with time, and the preservation of the fovea over time.
Methods
The participants in the study were 156 patients with GA from AMD and without choroidal neovascularization (CNV) in one or both eyes. The study was approved by the Johns Hopkins University School of Medicine's institutional review board, and written informed consent was obtained for all the participants. This study adhered to the Declaration of Helsinki. To be eligible, the patients had to have one or more areas of GA of at least 500 microns in diameter and could not have another retinal disease. One patient with Stargardt's disease is presented, only in Figure 4, to illustrate a reading pattern that may characterize eyes with macular ring scotomas.
Figure 4.
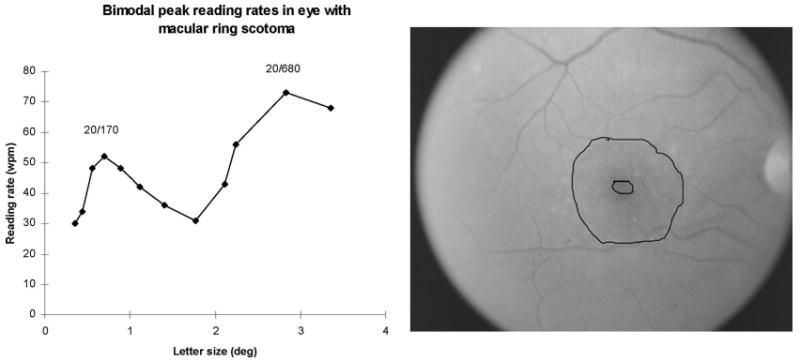
Bimodal reading rates in a patient in her early 50s with a macular ring scotoma from Stargardt disease. Visual acuity was 20/60. Left: The reading rate as a function of character size, tested here out to 3.5 degrees. There is a sharp peak reading rate of 52 WPM at the letter size of 0.70 degrees (20/170) and a second peak (and higher) reading rate of 73 WPM at the letter size 2.83 degrees (20/680). (The patients with good acuity in the GA study were not tested on letter sizes greater than 2 degrees.) Right: Fundus photograph of the eye whose data are presented to the left. There is a small central spared area surrounded by atrophy and dense scotoma.
At the baseline and at each annual visit, the participants underwent a battery of visual function tests that have been described fully in earlier publications (Sunness et al., 1997). The patients underwent a protocol refraction, ETDRS visual acuity, a measure of low luminance visual acuity using the ETDRS chart (performed by interposing a 2 log unit neutral density filter over the best correction) (Sunness et al., 2008) and Pelli-Robson contrast sensitivity.
The reading rate was measured at 9 character sizes, scaled to the patient's visual acuity, using a paragraph of unrelated words presented on a monitor. The patient was given 15 seconds to read, and the number of words read correctly was recorded. For a comparison group of elderly persons with only drusen and no advanced AMD, the median maximum reading rate was 130 words per minute (WPM), and none had a maximum reading rate of less than 100 WPM.
Foveal dark-adapted sensitivity was performed using a Tubingen perimeter, as previously described. Mapping of fixation and scotomas was performed using a prototype Rodenstock scanning laser ophthalmoscope (SLO) (Rodenstock, Munich). A full clinical evaluation was performed, and fundus photographs were obtained. At the baseline, a fluorescein angiogram was performed to rule out CNV; it was not repeated at subsequent visits unless there was suspicion of CNV or another retinal disease.
The fundus photographs were used to measure the areas of GA and to define their location on the retina relative to the fovea. These procedures have been described previously (Sunness, Bressler, Tian, Alexander, & Applegate, 1999; Sunness, Gonzalez-Baron et al., 1999). Briefly, the fundus photograph was projected, using a Dokumator, and the areas of GA were outlined. The areas of sparing with areas of GA were also outlined. These drawings were digitized, and the areas of GA and of sparing were measured. The total GA area was calculated as the sum of the areas of GA less the spared regions within the GA areas. A measure called central atrophic area was calculated as the total GA area within a 10.2-square-millimeter (sq mm) circle centered on the fovea. (This is equivalent to an area of 4 Macular Photocoagulation Study disc areas. One Macular Photocoagulation Study disc area is 2.54 sq mm on the retina.) The GA was also characterized as to its pattern—single small areas (<2.54 sq mm on the retina), multifocal GA, horseshoe (a single area of GA surrounding the fovea for at least 180 degrees, but less than 360 degrees), ring (surrounding the fovea for 360 degrees), and solid (area ≥ 2.54 sq mm) without central sparing within it.
For this article, patients with GA were included if they had visual acuity of 20/50 or better (logMAR VA < 0.46) in one or both eyes with GA. The study eye was defined as the eye with better visual acuity; if the acuities were the same in both eyes, the eye with the higher baseline reading rate was chosen. Patients were excluded if their fellow eye had only early AMD and had better acuity than the eye with GA; in these patients, adaptation to the scotoma surrounding fixation would likely not have been necessary.
Statistical methods
JMP expert data analysis software (Cary, North Carolina) was used to perform the statistical analyses presented later. The study used mainly descriptive statistics. Groups were compared using the Student's t-test. Univariate and multivariate linear regression was performed to look at the dependence of the reading rate on visual acuity and the GA pattern. Kaplan-Meier survival analysis was used to follow over time the percentage of patients with the maximum reading rate of less than 50 WPM.
Results
Patients
Of the 156 patients, 72 (46%) had GA with visual acuity of greater than or equal to 20/50 (called “good visual acuity” here) in their better-seeing eye at the baseline. The median visual acuity of the study eyes was 20/34 (0.23 logMAR). The median age was 77, and 60% of the patients were female. Seventy percent of the patients had follow-ups for four or more years. Ninety-five percent had late AMD in the fellow eye; 67% had bilateral GA without CNV, and 28% had CNV in the fellow eye only. The mean total area of GA at the baseline was 6.3 sq mm, and, on average, 44% of the central 10.2 sq mm of the retina was atrophic (and scotomatous, since in GA the area of atrophy corresponds to the area of dense scotoma; see Sunness, 2008; Sunness, Schuchard et al., 1995).
Table 1 shows the baseline characteristics of the study eye, and Figure 1 provides examples of some of the GA patterns. Twenty-four eyes (33%) had a multifocal pattern, 11 eyes (15%) had a horseshoe pattern, and 9 eyes (13%) had a macular ring pattern. The remaining eyes had a single, generally round, area of GA (classified as small or as solid, based on the area, as defined earlier). The eyes with the macular ring pattern had a significantly larger total area of atrophy than did those in the other groups, and the small group, by definition, had a smaller area of atrophy; the remaining three patterns were not significantly different from one another in total atrophy (see Table 1). The percentage of central atrophy was significantly larger for the ring pattern than for the others, and the horseshoe pattern had significantly more central atrophy than the solid, multifocal, and small configurations (see Table 1).
Table 1. Baseline characteristics of the study eye.
| Baseline pattern of geographic atrophy | Number at the baseline | Baseline mean visual acuitya | Baseline mean maximum reading rateb | Mean geographic atrophy areac | Mean percentage of atrophy in central 10.2 sq mm circle centered on fovea at the baselined |
|---|---|---|---|---|---|
| Small | 11 (15%) | 20/30 (0.17 [0.10–0.24]) | 110 [87–132] | 1.3 [0–5.5] | 10% [0–21%] |
| Multifocal | 24 (33%) | 20/34 (0.23 [0.18–0.28]) | 94 [79–110] | 7.2 [4.3–10.2] | 37% [30–44] |
| Horseshoe | 11 (15%) | 20/36 (0.26 [0.19–0.33]) | 94 [71–116] | 11.4 [7.0–15.9] | 62% [51–72%] |
| Ring | 9 (13%) | 20/35 (0.24 [0.16–0.31]) | 73 [48–98] | 23.4 [18.7–28.1] | 80% [68–92%] |
| Solid | 17 (24%) | 20/35 (0.24 [0.19–0.29]) | 80 [62–98] | 8.6 [5.2–12.0] | 47% [38–55%] |
| Total | 72 | 20/34 (0.23 [0.20–0.26]) | 90 [81–98] | 9.3 [7.1–11.5] | 44% [38–51%] |
LogMAR visual acuity in parentheses, 95% confidence intervals in brackets.
Words per minute in parentheses, 95% confidence intervals in brackets.
Square mm at the baseline in parentheses, 95% confidence intervals in brackets.
95% confidence intervals are in brackets.
Figure 1.
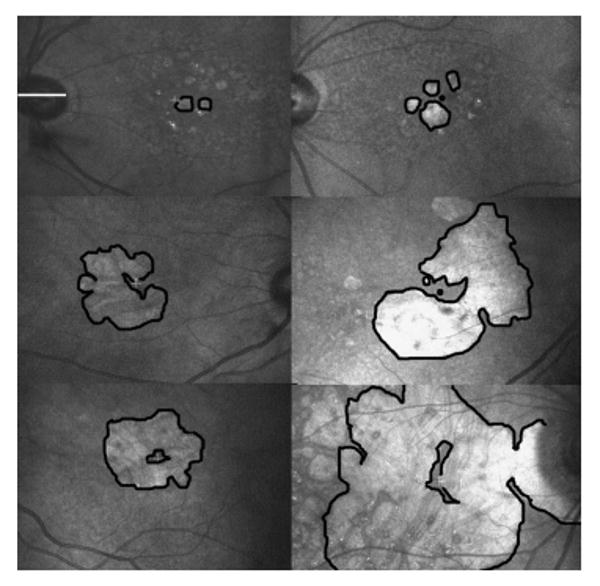
Scanning laser ophthalmoscope infrared images, showing configurations of GA from age-related macular degeneration with foveal sparing. The horizontal white line overlying the optic nerve in the upper left image is approximately 5 degrees in length, and all images are on the same scale. In each image, the borders of the larger areas of GA are outlined in black, so that the spared regions are outlined in black as well. The white fixation cross indicates the site of central fixation. In the images in which the fixation cross is not visible, a black dot indicates the approximate location of the foveal center. Top row: Eyes with small areas of multifocal GA. In the left image, the patient would experience a scotoma to the right. In the right image, the patient would experience a scotoma to the left, slightly above and slightly below fixation. Middle row: Eyes with horseshoe-shaped areas of atrophy. In the left image, the scotoma to the left would interfere the most, but there are also scotomas above and below fixation. In the image to the right, there is a scotoma near fixation just above fixation in the visual field space (inferior in the fundus image). There is also a scotoma below fixation. Bottom row: Eyes with macular ring scotomas. The image on the left is the fellow eye of the image just above it. This patient reported that he could read newsprint, but not newspaper headlines, because the headlines did not “fit” in the spared central area. The image on the right illustrates that even with a large area of GA, there is often persistent central sparing.
Figure 2 shows the strong correlation (r = −0.48, p = .0001) at the baseline of the maximum reading rate with logMAR visual acuity. The pattern of GA is not a significant predictor of the maximum reading rate for this group of patients in either the univariate or multivariate analysis. However, the pattern of GA does affect reading in a specific way. For eyes with drusen but no advanced AMD (the top portion of Figure 3), the reading rate remains relatively constant for larger letter sizes (in the range tested) once the peak reading rate is attained. (This reading rate versus letter size relationship was seen for all 11 patients with drusen only and good visual acuity who were tested.) However, for 4 (44%) of the 9 patients with macular ring scotomas, there was a peak at the small letter size and then a reduction in the reading speed with increasing character size after the peak. Figure 3 shows the curves for reading rate versus letter size at the baseline, one year, and four years for a patient with a macular ring scotoma, who demonstrates this phenomenon of a decreased reading rate with larger letters. The patient had narrowing of the spared foveal area over the years (see Figure 3), but still had evidence of a tiny area of anatomic foveal preservation at four years. At one year (1993), he showed the same reading rate versus letter size relationship, but at four years (1996), his reading rate had fallen dramatically, and there was not the steep decrease in reading speed with increasing letter size.
Figure 2.

The baseline maximum reading rate as a function of the baseline visual acuity. Even within the range of good visual acuities included in this study, there is strong correlation between reading rate and visual acuity. The open squares are the eyes with the macular ring scotoma configuration of GA. The closed symbols are all the other eyes.
Figure 3.
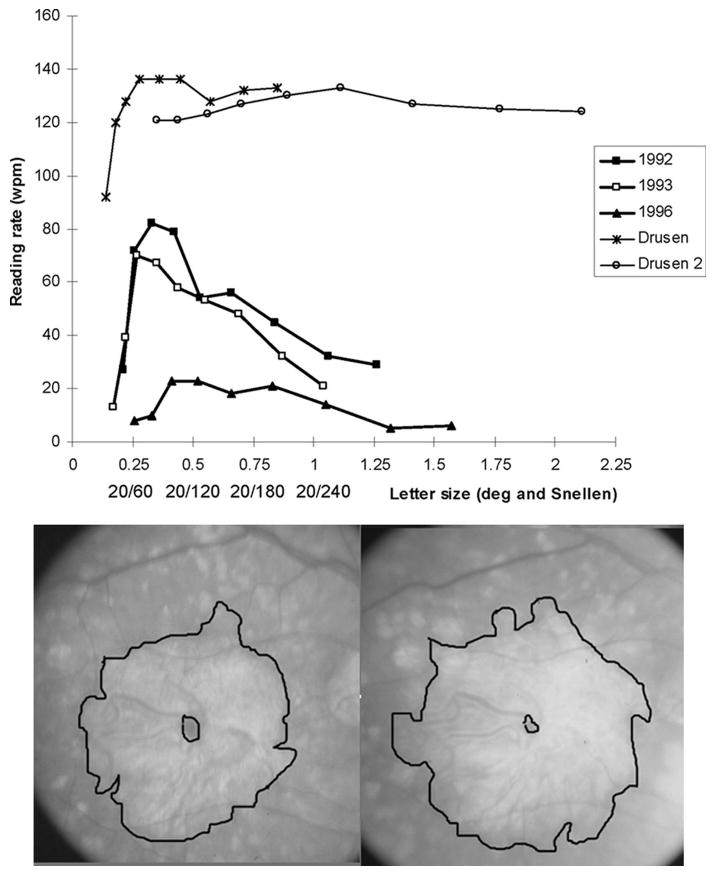
Top: Reading rate as a function of letter size. The findings of two eyes with drusen (all 11 eyes with drusen were similar) are shown at the top. For these eyes, once the maximum reading rate was attained, the reading rate remained essentially the same for increasing character size, out to the largest size tested (2 degrees). The longitudinal findings of one patient with a macular ring scotoma (bottom) are at the lower portion of the graph. At the baseline (1992), the maximum reading rate of 82 WPM was attained at 0.33 degrees, with a dramatic fall-off of the reading rate for larger letter sizes. One year later (1993), the results were similar, with a maximum reading rate of 70 WPM at 0.27 degrees, with a fall-off of the reading rate for larger letter sizes. At four years (1996), the maximum reading rate fell to 23 WPM without a sharp peak of the higher reading rate at the small letter size. Bottom: Fundus photographs of the eye with a macular ring scotoma, whose reading data are presented at the top of the figure. Left: In 1992, visual acuity was 0.14 logMAR (20/28). There was a small area of central sparing surrounded by a large area of GA and its corresponding dense scotoma. Right: In 1996, the visual acuity was 0.26 logMAR (20/36). There is still central sparing despite enlargement of the atrophy, but the central spared region was much smaller than in 1992.
In our natural history study, the nine character sizes tested were scaled for the visual acuity, so that for most patients, no letter sizes larger than 1.5 degrees were tested. The curve identified as drusen 2 in Figure 3 was unusual in that the scaling was inadvertently not done in the same way, so that one can see that there was no falloff of the reading rate when the letter size was increased out to 2 degrees. Subsequent to the GA natural history study, we had the opportunity to measure reading rate as a function of letter size going out past 3 degrees in a patient with a macular ring scotoma from Stargardt disease. Figure 4 shows the plot for the patient's atrophic lesion and reading rate versus letter size. This patient had a bimodal curve, with a peak at a relatively small letter size (20/170), then a decline of reading rate with increasing letter size, and then a second (and higher) peak at 20/680. This pattern suggests the use of the spared foveal region for the smaller letters and the use of an eccentric location for the larger ones.
There was continued sparing of the fovea on fundus photographs for many patients throughout the follow-up period. Table 2 shows the extent to which there was anatomic preservation of the fovea over the follow-up period. Many eyes had increasing encroachment of atrophy on the fovea, but 32 patients (44%) retained a pattern sparing the fovea anatomically (either multifocal, horseshoe, or ring) at the last follow-up visit. Twenty-two patients (31%) developed a ring pattern at some time during the follow-up period. Of interest is that 8 of the 9 eyes with the macular ring scotoma remained in that configuration throughout the follow-up period.
Table 2. The study eye at the follow-up (numbers; percentages in parentheses).
| Baseline pattern of GA | Number at the baseline | Number with a ring at some point during the follow-up | Number who retained an encircling pattern at the last follow-upa | Number who reached solid by the end of the follow-up | Mean logMAR visual acuity loss at two years (n = 54)b | Mean logMAR visual acuity loss at four years (n = 47)c |
|---|---|---|---|---|---|---|
| Small | 11 (15%) | 0 (0%) | 2 (18%) | 9 (82%) | 0.08 [0–0.29] | 0.28 [0–0.59] |
| Multifocal | 24 (33%) | 8 (30%) | 14 (61%) | 9 (39%) | 0.31 [0.17–0.43] | 0.53 [0.31–0.74] |
| Horseshoe | 11 (15%) | 4 (36%) | 8 (73%) | 3 (27%) | 0.13 [0–0.34] | 0.35 [0.01–0.69] |
| Ring | 9 (13%) | 9 (1000%) | 8 (89%) | 1 (11%) | 0.25 [0–0.50] | 0.56 [0.22–0.91] |
| Solid | 17 (24%) | 1 (6%) | 0 (0%) | 17 (100%) | 0.39 [0.25–0.54] | 0.65 [0.41–0.88] |
| Total | 72 | 22 (31%) | 32 (44%) | 39 (54%) | 0.27 [0.19–0.35] | 0.51 [0.38–0.63] |
The encircling pattern includes multifocal, horseshoe, and ring.
95% confidence intervals are in brackets.
95% confidence intervals are in brackets.
However, despite the clinical appearance of foveal sparing, visual acuity worsened for all groups over the course of the follow-up. There was a mean worsening of the visual acuity by 0.27 logMAR units at two years, and by 0.51 logMAR units at four years (see Table 2). The group with the solid pattern at the baseline had a significantly greater worsening of visual acuity than did the small or horseshoe groups at two years. There was no significant difference between the GA-pattern groups in mean visual acuity lost at four years, although the number of patients in the four-year follow-up was smaller than in the two-year follow-up.
Figure 5 shows the percentage of study eyes with reading rates of less than 50 WPM at each year of follow-up, using survival analysis. Fifteen percent of the eyes had reading rates of less than 50 WPM at the baseline, despite their good initial visual acuities. At two years and at four years, 54% and 78%, respectively, had reading rates of less than 50 WPM.
Figure 5.

Kaplan-Meier survival analysis. The graph shows the percentage of eyes for each year of follow-up with a maximum reading rate fewer than 50 WPM. The 95% confidence limits are shown in brackets.
Discussion
The presence of foveal sparing in macular diseases has been documented for several decades. It is interesting that the prevalence rate found for foveal sparing in Hart and Burde's (1983) study was identical, at about 20%, to the prevalence of macular ring scotomas in a low vision population in Fletcher and Schuchard's (1997) study.
Patients with macular ring scotomas and other scotomas that partly encircle the fovea pose a catch-22 situation for low vision intervention. On the one hand, visual acuity may be reduced, and some magnification is required. On the other hand, too much magnification will lead to more of the word falling onto the scotomatous area. This article has demonstrated (in Figure 3) the drop-off of the reading rate with letter size for eyes with macular ring scotomas.
Unfortunately, in the GA natural history study, the reading rates for eyes with good baseline acuity were not measured past a letter size of 1.5 degrees. Figure 4 shows a patient with a macular ring scotoma from Stargardt disease whose reading rate was measured for larger letter sizes. The data from this patient show a second peak in reading rate at a 20/680 letter size, which was higher than the reading rate at the first peak (20/170 letter size). We hypothesize that the patient shifted to eccentric fixation when the letter size got too large to be accommodated in the small central spared region. It is well known that patients with macular ring scotomas may have central fixation and concurrently have an eccentric preferred retinal locus of fixation (Lei & Schuchard, 1997; Sunness, Bressler, & Maguire, 1995). This eccentric location may be used under low luminance conditions (Lei & Schuchard, 1997; Sunness et al., 2008), but may also be used in tasks that demand a larger continuous visual field, even if more magnification is required. It is not known if the same findings of a second and higher peak at a large letter size are seen in patients with GA. The success that many patients with macular ring scotomas have with video magnification suggests that many shift at some point to eccentric fixation and use higher magnification. However, many patients with these scotomas find that the lowest magnification setting on a CCTV is too high for them, implying they still are using the central preferred retinal locus of fixation, even when there is an opportunity to go to higher magnification levels that would allow them to use eccentric fixation.
The assessment of patients with GA and foveal sparing must include a sense of the amount that scotomas encroach upon the center. Fundus photographs are useful in detecting the presence of foveal sparing and the possibility that the patient may have some remaining foveal vision, but do not, in themselves, provide information on how well the remaining fovea sees and whether the patient can effectively use the spared region. Formal testing, such as using an SLO or a Nidek MP-1 microperimeter, provides a more direct sense of a patient's use of the fovea for fixation and of the size and retinal sensitivity of the remaining foveal area. The nature of the patient's scotoma can also be determined by informal means that do not require expensive and uncommon equipment. The way the patient reads an eye chart or a reading card provides a sense of whether he or she is missing parts of words and where these missed parts are relative to fixation. Other means of measuring scotomas, such as how faces are perceived (Sunness, in press-b) and how patients perform on Amsler grid testing, may be revealing. This information itself is valuable for patients, in that it allows them to understand the nature of the visual difficulties they experience. This information can then be included when professionals try to determine the most effective low vision interventions.
Patients with GA and foveal-sparing scotomas have a keen need for increased lighting and good contrast (Sunness et al., 2008) so as to maximize their foveal vision, and this may be the most important intervention for these patients. Some magnification is often required, but one should not give more magnification than is necessary to maximize the number of letters that fit within the spared region. Patients will do better with video magnifiers that allow for a low level of magnification, rather than those that begin at higher levels. To capitalize on the patients' good visual acuity and to minimize the need to find the word or keep on the same line, presentation of reading material in a single scrolling row (such as the row display mode in the myReader closed-circuit television manufactured by Human-Ware) or the rapid presentation of one word at a time at a single location may be especially useful.
Acknowledgments
The work was supported, in part, by Grants EY08552 and EY14148 from the National Institutes of Health, a Research to Prevent Blindness Physician Scientist Award, and a grant from the Harry and Jeanette Weinberg Foundation.
Footnotes
This article was presented, in part, at the 1999 annual meeting of the Association for Research in Vision and Ophthalmology, Fort Lauderdale, Florida.
Contributor Information
Janet S. Sunness, Email: jsunness@gbmc.org, Richard E. Hoover Rehabilitation Services for Low Vision and Blindness, Greater Baltimore Medical Center, 6569 North Charles Street, PPW 305, Baltimore, MD 21204;.
Gary S. Rubin, Email: g.rubin@ucl.ac.uk, Helen Keller Professor of Visual Rehabilitation, Institute of Ophthalmology, University College London, 11-43 Bath Street, London EC1V 9EL, England;.
Abraham Zuckerbrod, Email: azuckerbrod@sunyopt.edu, College of Optometry, State University of New York, 33 West 42nd Street, New York, NY 10036;.
Carol A. Applegate, Email: capplegate@gbmc.org, Richard E. Hoover Rehabilitation Services for Low Vision and Blindness, Hoover Services, Greater Baltimore Medical Center;.
References
- Fletcher DC, Schuchard RA. Preferred retinal loci: Relationship to macular scotomas in a low-vision population. Ophthalmology. 1997;104:632–638. doi: 10.1016/s0161-6420(97)30260-7. [DOI] [PubMed] [Google Scholar]
- Gass JDM. Stereoscopic atlas of macular diseases. 4th. St. Louis, MO: Mosby; 1997. [Google Scholar]
- Green WR, Enger C. Age-related macular degeneration histopathologic studies: The 1992 Lorenz E. Zimmerman Lecture. Ophthalmology. 1993;100:1519–1535. doi: 10.1016/s0161-6420(93)31466-1. [DOI] [PubMed] [Google Scholar]
- Hart WM, Burde RM. Three-dimensional topography of the central visual field: Sparing of foveal sensitivity in macular disease. Ophthalmology. 1983;90:1028–1038. doi: 10.1016/s0161-6420(83)80031-1. [DOI] [PubMed] [Google Scholar]
- Lei H, Schuchard RA. Using two preferred retinal loci for different lighting conditions in patients with central scotomas. Investigative Ophthalmology & Vision Science. 1997;38:1812–1818. [PubMed] [Google Scholar]
- Maguire P, Vine AP. Geographic atrophy of the retinal pigment epithelium. American Journal of Ophthalmology. 1986;102:621–625. doi: 10.1016/0002-9394(86)90535-0. [DOI] [PubMed] [Google Scholar]
- Sarks JP, Sarks SH, Killingsworth MC. Evolution of geographic atrophy of the retinal pigment epithelium. Eye. 1988;2:552–577. doi: 10.1038/eye.1988.106. [DOI] [PubMed] [Google Scholar]
- Schatz H, McDonald HR. Atrophic macular degeneration: Rate of spread of geographic atrophy and visual loss. Ophthalmology. 1989;96:1541–1551. doi: 10.1016/s0161-6420(89)32694-7. [DOI] [PubMed] [Google Scholar]
- Sunness JS. Reading newsprint but not headlines: Pitfalls in measuring visual acuity and color vision in patients with bull's-eye maculopathy and other macular scotomas. Retinal Cases & Brief Reports. doi: 10.1097/IAE.0b013e31802fa25d. in press-a. [DOI] [PubMed] [Google Scholar]
- Sunness JS. What you see is not always what you get in atrophic macular disease. Retinal Cases & Brief Reports. 2008;2:205–208. doi: 10.1097/ICB.0b013e31806011e6. [DOI] [PubMed] [Google Scholar]
- Sunness JS. The use of face fields for determining fixation location in eyes with central scotomas from macular disease. Journal of Visual Impairment & Blindness. in press-b. [PMC free article] [PubMed] [Google Scholar]
- Sunness JS, Bressler NM, Maguire MG. Scanning laser ophthalmoscope analysis of the pattern of visual loss in age-related geographic atrophy of the macula. American Journal of Ophthalmology. 1995;119:143–151. doi: 10.1016/s0002-9394(14)73866-8. [DOI] [PubMed] [Google Scholar]
- Sunness JS, Bressler NM, Tian Y, Alexander J, Applegate CA. Measuring geographic atrophy in advanced age-related macular degeneration. Investigative Ophthalmology and Vision Science. 1999;40:1761–1769. [PubMed] [Google Scholar]
- Sunness JS, Gonzalez-Baron J, Applegate CA, Bressler NM, Tian Y, Hawkins B, Barron Y, Bergman A. Enlargement of atrophy and visual acuity loss in the geographic atrophy form of age-related macular degeneration. Ophthalmology. 1999;106:1768–1779. doi: 10.1016/S0161-6420(99)90340-8. [DOI] [PubMed] [Google Scholar]
- Sunness JS, Margalit E, Srikumaran D, Tian Y, Applegate CA, Perry D, Hawkins BS, Bressler NM. The long-term natural history of geographic atrophy from age-related macular degeneration: Enlargement of atrophy. Ophthalmology. 2007;114:271–277. doi: 10.1016/j.ophtha.2006.09.016. [DOI] [PMC free article] [PubMed] [Google Scholar]
- Sunness JS, Rubin GS, Applegate CA, Bressler NM, Marsh MJ, Hawkins BS, Haselwood D. Visual function abnormalities and prognosis in eyes with age-related geographic atrophy of the macula and good acuity. Ophthalmology. 1997;104:1677–1691. doi: 10.1016/s0161-6420(97)30079-7. [DOI] [PMC free article] [PubMed] [Google Scholar]
- Sunness JS, Rubin GS, Broman A, Applegate CA, Bressler NM, Hawkins BS. Low luminance visual dysfunction as a predictor of subsequent visual acuity loss in age-related geographic atrophy of the macula. Ophthalmology. 2008;115:1480–1488. doi: 10.1016/j.ophtha.2008.03.009. [DOI] [PMC free article] [PubMed] [Google Scholar]
- Sunness JS, Schuchard R, Shen N, Rubin G, Dagnelie G, Haselwood D. Landmark-driven fundus perimetry using the scanning laser ophthalmoscope (SLO) Investigative Ophthalmology & Vision Science. 1995;36:1863–1874. [PMC free article] [PubMed] [Google Scholar]