Abstract
Hepatocyte nuclear factor (HNF) 4α is a key transcription factor regulating endo/xenobiotic-metabolizing enzymes and transporters. We investigated whether microRNAs are involved in the regulation of human HNF4α. Potential recognition elements for miR-24 (MRE24) were identified in the coding region and the 3′-untranslated region (3′-UTR), and those for miR-34a (MRE34a) were identified in the 3′-UTR in HNF4α mRNA. The HNF4α protein level in HepG2 cells was markedly decreased by the overexpression of miR-24 and miR-34a. The HNF4α mRNA level was significantly decreased by the overexpression of miR-24 but not by miR-34a. In luciferase analyses in HEK293 cells, the reporter activity of plasmid containing the 3′-UTR of HNF4α was significantly decreased by miR-34a. The reporter activity of plasmid containing the HNF4α coding region downstream of the luciferase gene was significantly decreased by miR-24. These results suggest that the MRE24 in the coding region and MRE34a in the 3′-UTR are functional in the negative regulation by mRNA degradation and translational repression, respectively. The down-regulation of HNF4α by these microRNAs resulted in the decrease of various target genes such as cytochrome P450 7A1 and 8B1 as well as morphological changes and the decrease of the S phase population in HepG2 cells. We also clarified that the expressions of miR-24 and miR-34a were regulated by protein kinase C/mitogen-activated protein kinase and reactive oxygen species pathways, respectively. In conclusion, we found that human HNF4α was down-regulated by miR-24 and miR-34a, the expression of which are regulated by cellular stress, affecting the metabolism and cellular biology.
Keywords: Bile Acid, Cytochrome P450, Liver, MicroRNA, Nuclear Receptors
Introduction
Human hepatocyte nuclear factor 4α (HNF4α, NR2A1),3 which belongs to the nuclear hormone receptor superfamily, is highly expressed in liver and regulates the expression of various genes involved in the synthesis/metabolism of fatty acid, cholesterol, glucose, and urea (1). It is well recognized that endo/xenobiotic-metabolizing enzymes such as cytochrome P450s (CYPs), UDP-glucuronosyltransferases, sulfotransferase as well as ATP-binding cassette transporters, organic anion transporters and organic cation transporters are under the control of HNF4α (2). HNF4α transactivates the expression of target genes not only via direct binding to their regulatory sequences but also through the regulation of other transcriptional factors such as pregnane X receptor and constitutive androstane receptor, which regulate these target genes. HNF4α forms large transcriptional regulatory networks in the liver. Therefore, it is believed that the change of HNF4α expression has a great impact upon the function of the liver.
Bile acids are important regulatory molecules mediating cholesterol synthesis and glucose metabolism as well as their own synthesis (3). It is well known that HNF4α positively regulates the expression of bile acid-synthesizing enzymes such as CYP7A1 and CYP8B1. When bile acids are accumulated, the HNF4α-mediated transactivation is inhibited by short heterodimer partner, which is up-regulated by bile acid-activating farnesoid X receptor (4, 5). Bile acids are known to activate the mitogen-activated protein kinase (MAPK) signaling pathway. It is known that the expression and function of HNF4α are up- or down-regulated through extracellular signal-regulated kinase (ERK), c-Jun NH2-terminal kinase (JNK), and p38 MAPK pathways (6–8). In addition, chenodeoxycholic acid, a toxic bile acid, has been reported to decrease the HNF4α mRNA expression via unknown pathways (9). Thus, the bile acid synthesis would be fine-tuned through the modulation of the expression and/or activity of HNF4α. However, the regulatory mechanism of the HNF4α expression has not still been fully understood.
MicroRNAs (miRNAs) are a recently discovered family of short noncoding RNA whose final product is an ∼22-nucleotide functional RNA molecule (10). They regulate the expression of target genes by binding to complementary regions of transcripts to repress their translation or mRNA degradation. At present, more than 700 miRNAs have been identified in humans. They are expressed in a cell- or tissue-specific manner. For example, miR-122 is most abundantly and specifically expressed in liver (11). It has been demonstrated that silencing of miR-122 in vivo causes a decrease of hepatic cholesterol biosynthesis (12). In addition, two independent studies revealed that the knockdown of all miRNAs in liver by conditional knock-out of Dicer1 resulted in apoptosis and inflammation (13) or a disruption of hepatic zonation (14). These findings indicate the physiological and biological significance of miRNAs in liver function. In this study, we examined the possibility that miRNAs might regulate the expression of human HNF4α, resulting in the modulation of liver function.
EXPERIMENTAL PROCEDURES
Chemicals and Reagents
Phorbol 12-myristate 13-acetate (PMA), H2O2, U0126, and SB202190 were obtained from Wako Pure Chemicals (Osaka, Japan). SP600125 was from Calbiochem. The pGL3-promoter (pGL3p) vector, pGL4.74-TK plasmid, pTARGET vector, and dual luciferase reporter assay system were purchased from Promega (Madison, WI). Lipofectamine 2000, Lipofectamine RNAiMAX, Stealth Select RNA interference for human HNF4α (HSS140902) (siHNF4α), and Negative Control Medium GC Duplex #3 (siControl) were from Invitrogen. Pre-miR miRNA precursor molecule for miR-24, miR-34a, and Negative Control #1 (Control) were from Ambion (Austin, TX). All of the primers were commercially synthesized at Hokkaido System Sciences (Sapporo, Japan). Goat anti-human HNF4α polyclonal antibodies (S-20), rabbit anti-human GAPDH polyclonal antibodies, and mouse anti-HA monoclonal antibodies were from Santa Cruz Biotechnology (Santa Cruz, CA), IMGENEX (San Diego, CA), and COVANCE (Berkeley, CA), respectively. Alexa Fluor 680 donkey anti-goat IgG was from Invitrogen. IRDye 680 goat anti-rabbit IgG and goat anti-mouse IgG were from LI-COR Biosciences (Lincoln, NE). All other chemicals and solvents were of the highest grade commercially available.
Cell Culture
The human hepatocellular carcinoma cell line HepG2 was obtained from Riken Gene Bank (Tsukuba, Japan). The human embryonic kidney cell line HEK293 was obtained from American Type Culture Collection (Manassas, VA). HepG2 cells were cultured in Dulbecco's modified Eagle's medium (Nissui Pharmaceutical, Tokyo, Japan) supplemented with 0.1 mm nonessential amino acid (Invitrogen) and 10% fetal bovine serum (Invitrogen). HEK293 cells were cultured in Dulbecco's modified Eagle's medium supplemented with 4.5 g/liter glucose, 10 mm HEPES, and 10% fetal bovine serum. These cells were maintained at 37 °C under an atmosphere of 5% CO2, 95% air.
Transfection of miRNAs or siRNA into HepG2 Cells
Pre-miR miRNA precursor molecule and siRNA were transfected into HepG2 cells using Lipofectamine RNAiMAX. Unless otherwise specified, the pre-miR miRNA Precursor Molecule and siRNA were transfected at final concentrations of 50 and 5 nm, respectively. After 48 h, total RNA was isolated using RNAiso according to the manufacturer's protocol. Whole cell lysates were prepared by homogenization with lysis buffer (50 mm Tris-HCl, pH 8.0, 150 mm NaCl, 1 mm EDTA, 1% Nonidet P-40) containing protease inhibitors (0.5 mm (p-amidinophenyl)methanesulfonyl fluoride, 2 μg/ml aprotinin, 2 μg/ml leupeptin, 2 μg/ml pepstatin). The protein concentrations were determined using Bradford protein assay reagent (Bio-Rad) with γ-globulin as a standard.
Real Time RT-PCR for HNF4α, Its Target Genes, and miRNAs
The cDNAs were synthesized from total RNA using ReverTra Ace (Toyobo, Osaka, Japan). The primers used are shown in Table 1. The real time PCR was performed using the Mx3000P (Stratagene, La Jolla, CA) with the MxPro QPCR software as follows: after an initial denaturation at 95 °C for 2 min, the amplification was performed by denaturation at 95 °C for 15 s, annealing, and extension at 65 °C for 20 s for 40 cycles. The mRNA levels of HNF4α, phosphoenolpyruvate carboxykinase (PEPCK), p16, p21, p27, and CYPs were normalized with the GAPDH mRNA level, and the levels of pre-miR-24-1, pre-miR-24-2, pre-miR-34a, and mature miRNAs were normalized with the U6 small nuclear RNA level. For the quantification of mature miRNAs, reverse transcription was performed using the NCode miRNA first strand cDNA synthesis kit (Invitrogen) according to the manufacturer's protocol.
TABLE 1.
Primers for real time RT-PCR
The nucleotide sequences of miRNAs and the others were adopted from miRBase sequences and the GenBankTM database, respectively.
| Target gene | Accession No. | Forward (5′ to 3′) | Reverse (5′ to 3′) |
|---|---|---|---|
| HNF4α | NM_000457 | TGTCCCGACAGATCACCTC | CACTCAACGAGAACCAGCAG |
| CYP7A1 | NM_000780 | CAGTGCCTCCCTCAACATCC | GACATATTGTAGCTCCCGATCC |
| CYP8B1 | NM_004391 | CTACACGAAGGACAAGGAGCAGGAC | GTGGCTCACGGAGAGCATCTTGTG |
| CYP27A1 | NM_000784 | GGCAACGGAGCTTAGAGGAGATTC | CATCCACATTGGACCGTACTTGGC |
| PEPCK | NM_002591 | AGCTCGGTCGCTGGATGTCAGAG | GTAGGGTGAATCCGTCAGCTCGATG |
| p16 | NM_000077 | TGCCCAACGCACCGAATAGTTACG | TGCACGGGTCGGGTGAGAG |
| p21 | NM_000389 | CTGTCACTGTCTTGTACCCTTGTGC | GGAGAAGATCAGCCGGCGTTTG |
| p27 | NM_004064 | AGCAATGCGCAGGAATAAGGAAGCG | GTTTGACGTCTTCTGAGGCCAGG |
| GAPDH | NM_002046 | CCAGGGCTGCTTTTAACTC | GCTCCCCCCTGCAAATGA |
| U6 snRNA | NR_004394 | CGCTTCGGCAGCACATATACTAA | TATGGAACGCTTCACGAATTTGC |
| Pre-miR-24-1 | MI0000080 | TCCGGTGCCTACTGAGCTGATATC | CTGTTCCTGCTGAACTGAGCCA |
| Pre-miR-24-2 | MI0000081 | CGTGCCTACTGAGCTGAAACACAG | CTGTTCCTGCTGAACTGAGCCA |
| Pre-miR-34a | MI0000268 | CCAGCTGTGAGTGTTTCTTTGGCAG | CCCACAACGTGCAGCACTTCTAG |
| miR-24 | MIMAT0000080 | TGGCTCAGTTCAGCAGGAACAG | Universal qPCR primer |
| miR-34a | MIMAT0000255 | TGGCAGTGTCTTAGCTGGTTGT | Universal qPCR primer |
SDS-PAGE and Western Blot Analyses
The whole cell lysates (20 μg) were separated with 10% SDS-polyacrylamide gel electrophoresis and transferred to Immobilon-P transfer membrane (Millipore, Bedford, MA). The membranes were probed with goat anti-human HNF4α, rabbit anti-human GAPDH, or mouse anti-HA antibodies and the corresponding fluorescent dye-conjugated second antibodies. The band densities were quantified with an Odyssey infrared imaging system (LI-COR Biosciences). The HNF4α protein level was evaluated as the sum of the densities of two bands.
Construction of Plasmids
Human HNF4α cDNA including coding region and 3′-untranslated region (UTR) was amplified by PCR using cDNA prepared from HepG2 with the forward primer 5′-agaatgcgactctccaaaaccctc-3′ and the reverse primer 5′-tgaattctccttaatatttatcagcaaac-3′. From this fragment, the HNF4α coding region was digested with PmaCI. These cDNA fragments were cloned into the pTARGET vector (Promega), resulting in pTARGET/HNF4α+3′-UTR and pTARGET/HNF4α plasmids. HA-tagged GFP expression plasmid was constructed by PCR using pGSU6-GFP plasmid (Genlantis, San Diego, CA) as a template with the forward primer, 5′-tttacgcgtatgtacccctacgacgtgcccgactacgccatggctagcaaaggagaagaac-3′ (HA tag is underlined), and the reverse primer, 5′-tttgcggccgctcagttgtacagttcatccatgc-3′. To construct luciferase reporter plasmids, various fragments of the HNF4α coding region or 3′-UTR were inserted into the XbaI site downstream of the luciferase gene in the pGL3p vector. The nucleotide sequences of the constructed plasmids were confirmed by DNA sequencing analyses.
Transient Expression of HNF4α in HEK293 Cells and Transfection of miRNAs
The pTARGET/HNF4α and pTARGET/HNF4α+3′-UTR plasmids were transiently transfected with HA-tagged GFP expression plasmid and pre-miR miRNA precursor molecules into HEK293 cells. Briefly, the day before transfection, the cells were seeded into 24-well plates. After 24 h, 450 ng of the HNF4α expression plasmid, 50 ng of the pTARGET/HA-tagged GFP plasmid, and 50 nm of pre-miR miRNA precursor molecules were transfected using Lipofectamine 2000. After incubation for 48 h, the cells were harvested, and whole cell lysates were prepared as described above.
Luciferase Assay
Various luciferase reporter plasmids (pGL3p) were transiently transfected with pGL4.74-TK plasmid into HEK293 cells. Briefly, the day before transfection, the cells were seeded into 24-well plates. After 24 h, 90 ng of pGL3p plasmid, 10 ng of pGL4. 74-TK plasmid, and 10 nm of pre-miR miRNA precursor molecules were transfected into HEK293 cells using Lipofectamine 2000. After incubation for 48 h, the cells were resuspended in the passive lysis buffer, and then the luciferase activity was measured with a luminometer (Wallac, Turku, Finland) using a dual luciferase reporter assay system.
Treatment of HepG2 Cells with Chemicals
HepG2 cells were seeded into 12-well plates, and after 24 h, the cells were treated with 100 nm PMA or 500 μm H2O2 for the indicated times. The specific inhibitors for MAPK, U0126, SB202190, and SP600125 were co-treated with PMA for 1 h or with H2O2 for 6 h at a final concentration of 10 μm. Total RNA was isolated as described above.
Cell Cycle Analysis
HepG2 cells were fixed with 70% ethanol at 48 h after the transfection of pre-miR miRNA precursor molecules or siRNAs. The cells were washed with FACS buffer (phosphate-buffered saline containing 0.1% bovine serum albumin) and incubated with FACS buffer containing 50 μg/ml RNase A for 30 min at 37 °C. The cells were stained with 25 μg/ml propidium iodide and analyzed using FACSCalibur and Cell Quest Pro software (BD Biosciences, San Jose, CA). Synchronization of HepG2 cells were carried out by serum deprivation. After 24 h, the cells were restimulated with serum for the indicated time.
Statistical Analysis
Statistical significance was determined by analysis of variance followed by Dunnett multiple comparisons test or Tukey method test. A value of p < 0.05 was considered statistically significant.
RESULTS
miR-24 and miR-34a Down-regulate HNF4α
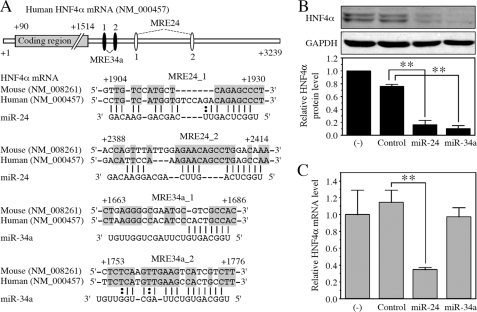
The length of the 3′-UTR of human HNF4α is ∼1.7 kb (Fig. 1A). Computational prediction using miRanda, PicTar, and TargetScan identified the potential recognition elements for various miRNAs including miR-1, miR-24, miR-34a, miR-326, and miR-485 in the 3′-UTR of HNF4α. Among them, we decided to investigate the effects of miR-24 and miR-34a on HNF4α expression, because they were predicted by two algorithms. Western blot analysis using whole cell lysates from HepG2 cells showed two bands of HNF4α, probably corresponding to variants 1 and 2 (Fig. 1B). Variant 2 is a natural splicing variant with 30 nucleotides inserted in the coding region. When pre-miR miRNA precursor molecules for miR-24 and miR-34a were transfected into HepG2 cells, the mature miR-24 and miR-34a levels were increased 10.6- and 6.1-fold, respectively (data not shown). Concomitantly, the HNF4α protein levels were dramatically decreased. To investigate whether the decrease of the HNF4α protein levels was accompanied by a decrease of the mRNA levels, we determined the HNF4α mRNA levels by real time RT-PCR analysis. As shown in Fig. 1C, the HNF4α mRNA level was significantly decreased with the overexpression of miR-24, but not with miR-34a. These results suggested that miR-24 and miR-34a down-regulate the HNF4α expression by different mechanisms, i.e. mRNA degradation and translational repression, respectively.
FIGURE 1.
The potential MREs in the 3′-UTR of HNF4α mRNA and the effects of miR-24 and miR-34a on the HNF4α level. A, schematic diagrams of human HNF4α mRNA and the predicted target sites of miR-24 and miR-34a in the 3′-UTR are shown (upper panel). The numbering refers to the 5′ end of mRNA as 1. Complementarity of miR-24 and miR-34a to the predicted target sequence of human HNF4α is shown (lower panel). The conserved nucleotides are highlighted in gray boxes. B and C, pre-miR miRNA precursor molecules were transfected into HepG2 cells at a concentration of 50 nm. After 48 h, total RNA and whole cell lysates were prepared. The HNF4α and GAPDH protein levels were determined by Western blot analyses (B). The HNF4α mRNA levels were determined by real time RT-PCR and normalized with the GAPDH mRNA level (C). The data are relative to no transfection (−). Each column represents the mean ± S.D. of three independent experiments. **, p < 0.01.
Identification of Functional MRE in Coding Region and 3′-UTR of HNF4α mRNA
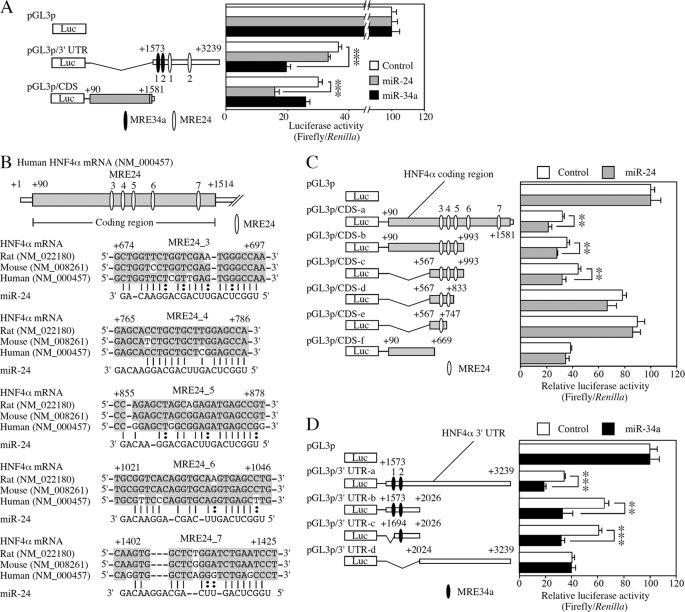
In the 3′-UTR of the HNF4α mRNA, two potential miRNA recognition elements for miR-24 (MRE24_1 and MRE24_2) and miR-34a (MRE34a_1 and MRE34a_2) were predicted (Fig. 1A). To investigate whether these MRE are functional in the down-regulation of the HNF4α, luciferase assays were performed using the pGL3p/3′-UTR plasmid containing 3′-UTR of HNF4α with HEK293 cells (Fig. 2A). The luciferase activity was significantly decreased by the overexpression of miR-34a, but not by miR-24. We next performed luciferase assays using the pGL3p/coding sequence (CDS) plasmid containing the coding region of HNF4α to examine the possibility that down-regulation of HNF4α by miR-24 might be mediated by elements in the coding region. The luciferase activity was significantly decreased by the overexpression of miR-24, although miR-34a did not affect the activity (Fig. 2A). These results prompted us to search for the potential recognition element of miR-24 in the coding region of HNF4α mRNA. Computational search using RNA22 identified five potential MRE24s (termed MRE24_3 to MRE24_7) in the coding region of HNF4α mRNA (Fig. 2B).
FIGURE 2.
Reporter analyses of MREs in the coding region and 3′-UTR of HNF4α mRNA. A, reporter plasmids and pre-miR miRNA precursor molecules were co-transfected into HEK293 cells, and luciferase assays were performed after 48 h. The data were the firefly luciferase activities normalized with the Renilla luciferase activities relative to that of pGL3p co-transfected with each miRNA. Each column represents the mean ± S.D. of three independent experiments. ***, p < 0.001. B, schematic diagrams of the coding region of human HNF4α mRNA and mapping of predicted miR-24 target sites are described. Complementarity of miR-24 to the predicted target sequence of human HNF4α is also indicated. The conserved nucleotides are highlighted in gray boxes. C and D, luciferase assays were performed using plasmids containing MRE24 in the coding region (C) or MRE34a in the 3′-UTR (D) of HNF4α mRNA. The data were relative to that of pGL3p co-transfected with each miRNA. Each column represents the mean ± S.D. of three independent experiments. **, p < 0.01; ***, p < 0.001.
To identify the functional MREs, we performed luciferase assay using a series of deleted reporter constructs. Overexpression of miR-24 significantly decreased the luciferase activities of reporter constructs pGL3/CDS-b and pGL3/CDS-c containing MRE24_3 to _5 but did not affect the activity of the pGL3/CDS-f (Fig. 2C), indicating that three MREs would be functional. The deletion of MRE24_4 and 5 (pGL3p/CDS-d and -e) resulted in the loss of repression, suggesting that MRE24_3, 4, and 5 function cooperatively. Overexpression of miR-34a significantly decreased the activity of reporter constructs pGL3/3′-UTR-b containing MRE34a_1 and 2 but did not affect the activity of the pGL3/3′-UTR-d (Fig. 2D). The deletion of MRE34a_1 did not affect the repressive effects (pGL3p/3′-UTR-c), indicating that MRE34a_2 plays a key role in the miR-34a-mediated repression. Collectively, MRE24s in the coding region and MRE34a in the 3′-UTR of HNF4α mRNA would be functional.
miR-24 and miR-34a Act on the Coding Region and the 3′-UTR of HNF4α, Respectively
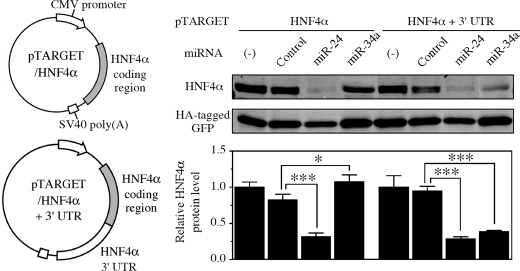
To verify that miR-24 and miR-34a act on the coding region and the 3′-UTR of HNF4α, respectively, we constructed expression systems of HNF4α that excluded or included the 3′-UTR. In the HEK293 cells transfected with pTARGET/HNF4α plasmid, the HNF4α protein level was significantly decreased by the overexpression of miR-24, but not by miR-34a (Fig. 3). In the HEK293 cells transfected with pTARGET/HNF4α+3′-UTR plasmid, the HNF4α protein level was significantly decreased by both miR-24 and miR-34a. These results support that miR-24 and miR-34a down-regulate the HNF4α expression through recognizing the elements in the coding region and the 3′-UTR of HNF4α mRNA, respectively.
FIGURE 3.
Effects of miRNAs on the exogenous HNF4α expression in HEK293 cells. The HNF4α expression plasmids including and excluding 3′-UTR used in this study are shown. These plasmids were transfected with HA-tagged GFP expression plasmid and pre-miR miRNA precursor molecules into HEK293 cells. After 48 h, whole cell lysates were prepared. The exogenously expressed HNF4α and HA-tagged GFP protein levels were determined by Western blot analyses. The data represent HNF4α protein level normalized with HA-tagged GFP level relative to that of no transfection (−). Each column represents the mean ± S.D. of three independent experiments. *, p < 0.05; ***, p < 0.001.
Regulation of miR-24 and miR-34a Expression
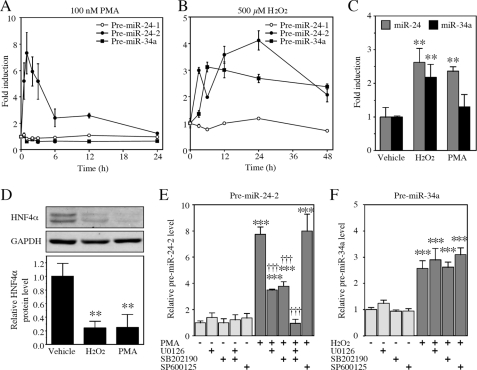
The mature miR-24 is produced from two precursors, pre-miR-24-1 and pre-miR-24-2, the genes of which are located on chromosome 9q22.32 and 19p13.12, respectively. The mature miR-34a is produced from a precursor pre-miR-34a, the gene of which is located on chromosome 1p36.22. Because the HNF4α expression and/or activity are changed in response to signals derived from bile acids, we examined whether bile acids affect the expression of miR-24 and miR-34a. First, we examined the effect of chenodeoxycholic acid on the expression of the precursors of miR-24 and miR-34a. We found that the treatment with chenodeoxycholic acid increased the pre-miR-24-2 level in HepG2 cells (3.4-fold) at a concentration of 200 μm (data not shown). Bile acids are known to activate protein kinase C (PKC) and reactive oxygen species (ROS) generation. We next investigated the effects of PKC activator PMA and ROS generator H2O2 on the expression of the precursors of miR-24 and miR-34a. The treatment with PMA for 0.5–3 h markedly increased the expression of the pre-miR-24-2 level (Fig. 4A). The treatment with H2O2 for a relatively longer time greatly increased the expression levels of pre-miR-24-2 and pre-miR-34a (Fig. 4B). This was accompanied by increases of the mature miR-24 and miR-34a levels (Fig. 4C). Interestingly, the HNF4α protein levels were significantly decreased (Fig. 4D). It was considered that PMA or H2O2 repressed the HNF4α expression though increasing the miR-24 and miR-34a levels.
FIGURE 4.
Regulation of miR-24 and miR-34a through MAPK and ROS pathway, respectively. A and B, HepG2 cells were treated with 100 nm PMA (A) or 500 μm H2O2 (B) for the indicated time. The pre-miRNA levels were determined by real time RT-PCR and normalized with the U6 small nuclear RNA level. The data are shown as fold changes compared with vehicle. Each point represents the mean ± S.D. of three independent experiments. C and D, HepG2 cells were treated with 100 nm PMA or 500 μm H2O2 for 48 h. The mature miR-24 and miR-34a levels were determined by real time RT-PCR and normalized with the U6 small nuclear RNA level (C). The HNF4α and GAPDH protein levels were determined by Western blot analyses (D). The data are relative to vehicle. Each column represents the mean ± S.D. of three independent experiments. **, p < 0.01, compared with vehicle. E and F, cells were co-treated with 100 nm PMA and 10 μm MAPK inhibitors for 1 h (E) or co-treated with 500 μm H2O2 and 10 μm MAPK inhibitors for 6 h (F). Each column represents the mean ± S.D. of three independent experiments. ***, p < 0.001, compared with nontreatment; †††, p < 0.001, compared with PMA-treated.
PKC activates MAPK pathway including ERK, JNK, and p38. The PMA-dependent induction of pre-miR-24-2 was decreased by co-treatment with MAPK/ERK kinase (MEK) inhibitor U0126 or p38 inhibitor SB202190 but not with JNK inhibitor SP600125 (Fig. 4E). In contrast, these MAPK inhibitors did not affect the H2O2-dependent induction of pre-miR-34a (Fig. 4F). These results suggest that the ERK and p38 MAPK pathways modulate the pre-miR-24-2 level. The decrease of the HNF4α expression via activation of MAPK or generation of ROS might partly be explained by the induction of miRNAs repressing HNF4α.
miR-24- and miR-34a-dependent Down-regulation of HNF4α Decreases the Expression of Target Genes
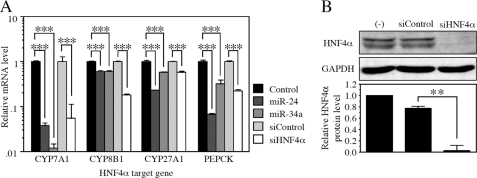
We next investigated the effects of the miRNA-dependent down-regulation of HNF4α on the expression of target genes (Fig. 5A). The overexpression of miR-24 and miR-34a drastically decreased the CYP7A1 mRNA level in HepG2 cells. In addition, the overexpression of miR-24 and miR-34a significantly decreased the CYP8B1, CYP27A1, and PEPCK mRNA levels. To investigate whether the decrease of these mRNAs resulted from the decrease of the HNF4α protein level but not the direct effects of miRNAs, we introduced siHNF4α into the HepG2 cells. It was clearly demonstrated that the HNF4α protein level was remarkably decreased by the transfection of siHNF4α (Fig. 5B). Under this condition, the mRNA levels of CYP7A1, CYP8B1, CYP27A1, and PEPCK were significantly decreased. These results suggest that the decrease of HNF4α by miR-24 and miR-34a caused the decrease of the expression of the target genes. Because they are key enzymes for the bile acid biosynthetic pathway and rate-limiting for gluconeogenesis, miR-24 and miR-34a may affect the hepatic functions through the regulation of HNF4α.
FIGURE 5.
Down-regulation of various HNF4α target genes by miR-24 and miR-34a as well as siHNF4α. A, the mRNA levels of various targets of HNF4α in HepG2 cells were examined by real time RT-PCR and normalized with the GAPDH mRNA level. The data are relative to that transfected with control or siControl. Each column represents the mean ± S.D. of three independent experiments. ***, p < 0.001. B, the HNF4α and GAPDH protein levels in HepG2 cells were determined by Western blot analyses. The data are relative to no transfection (−). Each column represents the mean ± S.D. of three independent experiments. **, p < 0.01.
miR-24- and miR-34a-dependent Down-regulation of HNF4α Is Associated with Changes of Morphology and Cell Cycle Population
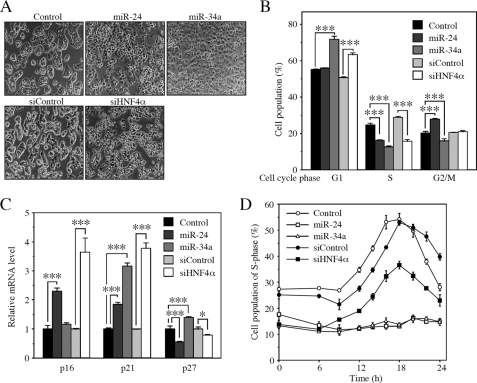
When miR-24 and miR-34a were overexpressed in the HepG2 cells, we noticed morphological changes including scattering and enlargement of the cells (Fig. 6A). Such morphological changes were also observed when the siHNF4α was transfected. It has been reported that HNF4α is involved in the control of differentiation, cell adhesion, and cell proliferation (15–17). We investigated the effects of overexpression of miR-24 and miR-34a on the cell cycle. The percentage of S phase cells was significantly decreased by the transfection with miR-24 or miR-34a into the HepG2 cells (Fig. 6B). The decrease was also observed by the transfection of siHNF4α. In addition, it was found that the transfection with miR-24 or miR-34a significantly induced the mRNA level of cyclin-dependent kinase inhibitor p21 (Fig. 6C), although there was no clear induction of p16 and p27. The induction of p21 and p16 was also observed when the siHNF4α was transfected. These results suggest that the changes of morphology and cell population by miR-24 and miR-34a might partly be due to the down-regulation of HNF4α. However, the transfection of siHNF4α did not cause cell cycle arrest at the G1/S transition, although the overexpression of miR-24 and miR-34a caused complete arrest at the G1/S transition, when the cells were synchronized by serum starvation (Fig. 6D). Thus, miR-24 and miR-34a may arrest the cell cycle through other mechanisms that are independent of HNF4α.
FIGURE 6.
Inhibition of G1/S transition by miR-24 and miR-34a in HepG2 cells. A, morphological change of HepG2 cells at 72 h after the transfection with pre-miRNA precursor molecules or siRNAs was visualized and photographed under a light microscope. B, cells were collected at 48 h after the transfection, and the cell population in each phase of cell cycle was analyzed by FACS. Each column represents the mean ± S.D. of three independent experiments. ***, p < 0.001. C, the p16, p21, and p27 mRNA levels were determined by real time RT-PCR and were normalized with the GAPDH mRNA level. The data are relative to that transfected with the control or siControl. Each column represents the mean ± S.D. of three independent experiments. *, p < 0.05; ***, p < 0.001. D, the time-dependent change of the percentages of cell population under S phase are shown. Twenty-four hours after the transfection with pre-miRNA precursor molecules or siRNAs, the cells were synchronized by serum deprivation for 24 h. Then the cells were restimulated with serum for the indicated time. Each point represents the mean ± S.D. of three independent experiments.
DISCUSSION
HNF4α is highly expressed in liver, although it is also expressed in extrahepatic tissues such as kidney, intestine, and pancreas (1). It is constitutively active and generally acts as a positive transcriptional regulator of the expression of various transcriptional factors and enzymes. It has been reported that knock-out of HNF4α disrupts the hepatic architecture and function (15). Mutations in HNF4α are a cause of type 1 maturity onset diabetes of the young, which is the monogenic form of diabetes that results from functional defects in islet β cells (18). Thus, HNF4α is critical for tissue development and for the maintenance of a number of metabolic pathways. In this study, we investigated the role of miRNAs in the regulation of HNF4α expression.
We found that both miR-24 and miR-34a negatively regulate the HNF4α expression. Generally, in vertebrates, miRNAs are believed to recognize elements in the 3′-UTR to repress the translation or to degrade mRNA. In this study, however, we found that the functional MREs for miR-24-dependent regulation are located in the coding region of HNF4α mRNA. This was not surprising because for other targets, it has been demonstrated the miRNA regulates through the coding region or 5′-UTR (19–21). miR-24 decreased the HNF4α mRNA level in addition to the protein level, suggesting that miR-24 is likely to repress the HNF4α expression through mRNA degradation rather than through translational repression. On the other hand, the functional MRE for miR-34a-dependent regulation is located in the 3′-UTR. miR-34a is likely to repress the HNF4α expression through translational repression, because it did not decrease the mRNA levels, although it did decrease the HNF4α protein level. Thus, it was considered that miR-24 and miR-34a regulate the human HNF4α expression through different mechanisms.
We found that the pre-miR-24-2 level was strongly increased by the treatment with PKC/MAPK activator PMA and ROS generator H2O2 in HepG2 cells. The activation of the PKC pathway induces cholestasis (22). The ROS pathway plays an important role in the pathogenesis of nonalcoholic steatohepatitis (23). Because the increase of the pre-miR-24-2 resulted in the increase of the mature miR-24 level, the mature miR-24 expression seems to be induced in these pathological conditions. Additionally, it has been reported that transforming growth factor-β, which is associated with fibrosis, increased the miR-24 level (24). Regarding HNF4α, it has been reported that cholestasis, hepatic steatosis, and fibrosis down-regulate the expression (25–27). Thus, the down-regulation of HNF4α in these diseases might be due to the induction of miR-24.
Previous studies revealed that miR-34a is regulated by p53, a tumor suppressor gene (28, 29). The present study demonstrated that the pre-miR-34a level was increased by the treatment with H2O2. The treatment with MAPK inhibitors failed to inhibit the induction of pre-miR-34a. ROS is known to activate p53 pathway, suggesting that the increase of pre-miR-34a might result from the p53 activation, but not MAPK pathways. It is known that chenodeoxycholic acid activates the PKC pathway and generates ROS, but it failed to increase the pre-miR-34a level in our study (data not shown). Although the reason for the discrepancy is unknown, it is surmised that miR-34a may be up-regulated directly by bile acids.
We found that the changes of morphology and cell population by miR-24 and miR-34a might be partly due to the down-regulation of HNF4α. However, detailed examination of the cell population revealed that cell cycle arrest might be caused by additional roles for miR-24 and miR-34a with other targets besides HNF4α. In fact, miR-34a is known to suppress cell cycle regulatory genes such as cyclin E2 and cyclin-dependent kinase 4, resulting in cell cycle arrest in the G1 phase (30). Meanwhile, miR-24 has been reported to promote the proliferation of transforming growth factor-β-treated HuH7 hepatocellular carcinoma cells (24) as well as A549 lung carcinoma cells (31). These findings might be consistent with a report showing that miR-24 suppressed the translation of p16, which arrests cells in the G1 phase (32). In contrast, Cheng et al. (31) have reported that miR-24 attenuated the proliferation in HeLa cells. Thus, miR-24 might function differently in different cells. In contrast to a previous study (33), the decrease of HNF4α by the transfection with siHNF4α resulted in the up-regulation of p21 gene expression. Because c-Myc interacts with HNF4α and blocks the activation of p21 promoter, the conflicting result might be due to the difference in the balance between c-Myc and HNF4α expression. Taken together, miR-24 and miR-34a would cause cell arrest through the regulation of multiple targets in global network for cell cycle.
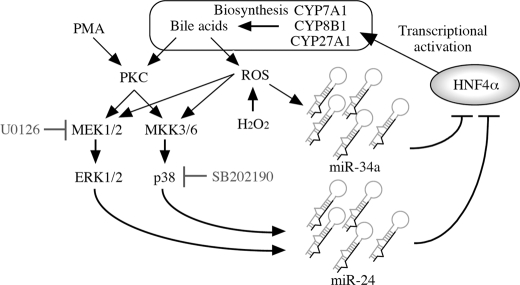
Of particular interest in our findings was that the miR-24- and miR-34a-dependent down-regulation of HNF4α resulted in decreases of the downstream genes. CYP7A1 catalyzes the first and rate-limiting step in the classical bile acid synthetic pathway (34). It is considered that the induction of miR-24 and miR-34a would result in decreased bile acid synthesis. In addition, gluconeogenic enzyme PEPCK was also down-regulated by the decrease of the HNF4α expression by miRNAs. Thus, miR-24 and miR-34a might affect the various hepatic functions through the negative regulation of HNF4α expression. Interestingly, we found that these miRNAs were induced by PKC/MAPK activator or ROS generator. Therefore, we propose a novel feedback regulation of bile acids synthesis (Fig. 7). Namely, bile acids activate PKC/MAPK and ROS pathways. The PKC/MAPK and ROS pathways increase the miR-24 and miR-34a expression, respectively. These miRNAs down-regulate the HNF4α expression. Accordingly, the expression of bile acid-synthesizing enzymes is decreased. Thus, we could provide new insight into the negative feedback regulation of bile acids synthesis.
FIGURE 7.
A proposal of the regulatory loop of miR-24, miR-34a, and HNF4α in bile acid synthesis. Bile acids are known to activate PKC and ROS generation, resulting in the activation of MAPK pathway. The miR-24 and miR-34a expression are induced by MAPK-dependent and -independent pathways, respectively. In turn, miR-24 and miR-34a negatively regulate the HNF4α. The down-regulation of HNF4α decreases the expression of bile acid-synthesizing enzymes CYP7A1 and CYP8B1, resulting in the decrease of bile acids.
In summary, we found that miR-24 and miR-34a regulate human HNF4α expression, resulting in the decrease of various downstream genes and aberrant cell cycle. Because these miRNAs are under the control of cellular stress, the miRNAs-dependent regulation of human HNF4α might contribute to pathology in liver.
Acknowledgment
We acknowledge Brent Bell for reviewing the manuscript.
This work was supported in part by a grant-in-aid for scientific research (B) from the Japan Society for the Promotion of Science and in part by a Health and Labor Science Research Grant from the Ministry of Health, Labor and Welfare of Japan.
- HNF
- hepatocyte nuclear factor
- RT
- reverse transcription
- UTR
- untranslated region
- miRNA
- microRNA
- CYP
- cytochrome P450
- MAPK
- mitogen-activated protein kinase
- ERK
- extracellular signal-regulated kinase
- JNK
- c-Jun NH2-terminal kinase
- PMA
- phorbol 12-myristate 13-acetate
- GAPDH
- glyceraldehyde-3-phosphate dehydrogenase
- HA
- hemagglutinin
- siRNA
- small interfering RNA
- PEPCK
- phosphoenolpyruvate carboxykinase
- pre-miR
- precursor miR
- GFP
- green fluorescent protein
- FACS
- fluorescence-activated cell sorter
- PKC
- protein kinase C
- ROS
- reactive oxygen species.
REFERENCES
- 1.Gonzalez F. J. (2008) Drug Metab. Pharmacokinet. 23, 2–7 [DOI] [PubMed] [Google Scholar]
- 2.Kamiyama Y., Matsubara T., Yoshinari K., Nagata K., Kamimura H., Yamazoe Y. (2007) Drug Metab. Pharmacokinet. 22, 287–298 [DOI] [PubMed] [Google Scholar]
- 3.Hylemon P. B., Zhou H., Pandak W. M., Ren S., Gil G., Dent P. (2009) J. Lipid Res. 50, 1509–1520 [DOI] [PMC free article] [PubMed] [Google Scholar]
- 4.Goodwin B., Jones S. A., Price R. R., Watson M. A., McKee D. D., Moore L. B., Galardi C., Wilson J. G., Lewis M. C., Roth M. E., Maloney P. R., Willson T. M., Kliewer S. A. (2000) Mol. Cell 6, 517–526 [DOI] [PubMed] [Google Scholar]
- 5.Lee Y. K., Dell H., Dowhan D. H., Hadzopoulou-Cladaras M., Moore D. D. (2000) Mol. Cell. Biol. 20, 187–195 [DOI] [PMC free article] [PubMed] [Google Scholar]
- 6.Hatzis P., Kyrmizi I., Talianidis I. (2006) Mol. Cell. Biol. 26, 7017–7029 [DOI] [PMC free article] [PubMed] [Google Scholar]
- 7.Li T., Jahan A., Chiang J. Y. (2006) Hepatology 43, 1202–1210 [DOI] [PMC free article] [PubMed] [Google Scholar]
- 8.Guo H., Gao C., Mi Z., Wai P. Y., Kuo P. C. (2006) Biochem. J. 394, 379–387 [DOI] [PMC free article] [PubMed] [Google Scholar] [Retracted]
- 9.Popowski K., Eloranta J. J., Saborowski M., Fried M., Meier P. J., Kullak-Ublick G. A. (2005) Mol. Pharmacol. 67, 1629–1638 [DOI] [PubMed] [Google Scholar]
- 10.Bartel D. P. (2004) Cell 116, 281–297 [DOI] [PubMed] [Google Scholar]
- 11.Chang J., Nicolas E., Marks D., Sander C., Lerro A., Buendia M. A., Xu C., Mason W. S., Moloshok T., Bort R., Zaret K. S., Taylor J. M. (2004) RNA Biol. 1, 106–113 [DOI] [PubMed] [Google Scholar]
- 12.Krützfeldt J., Rajewsky N., Braich R., Rajeev K. G., Tuschl T., Manoharan M., Stoffel M. (2005) Nature 438, 685–689 [DOI] [PubMed] [Google Scholar]
- 13.Hand N. J., Master Z. R., Le Lay J., Friedman J. R. (2009) Hepatology 49, 618–626 [DOI] [PMC free article] [PubMed] [Google Scholar]
- 14.Sekine S., Ogawa R., Mcmanus M. T., Kanai Y., Hebrok M. (2009) J. Pathol. 219, 365–372 [DOI] [PubMed] [Google Scholar]
- 15.Parviz F., Matullo C., Garrison W. D., Savatski L., Adamson J. W., Ning G., Kaestner K. H., Rossi J. M., Zaret K. S., Duncan S. A. (2003) Nat. Genet. 34, 292–296 [DOI] [PubMed] [Google Scholar]
- 16.Battle M. A., Konopka G., Parviz F., Gaggl A. L., Yang C., Sladek F. M., Duncan S. A. (2006) Proc. Natl. Acad. Sci. U.S.A. 103, 8419–8424 [DOI] [PMC free article] [PubMed] [Google Scholar]
- 17.Erdmann S., Senkel S., Arndt T., Lucas B., Lausen J., Klein-Hitpass L., Ryffel G. U., Thomas H. (2007) Biol. Chem. 388, 91–106 [DOI] [PubMed] [Google Scholar]
- 18.Stanger B. Z. (2008) Diabetes 57, 1461–1462 [DOI] [PubMed] [Google Scholar]
- 19.Forman J. J., Legesse-Miller A., Coller H. A. (2008) Proc. Natl. Acad. Sci. U.S.A. 105, 14879–14884 [DOI] [PMC free article] [PubMed] [Google Scholar]
- 20.Tay Y., Zhang J., Thomson A. M., Lim B., Rigoutsos I. (2008) Nature 455, 1124–1128 [DOI] [PubMed] [Google Scholar]
- 21.Lytle J. R., Yario T. A., Steitz J. A. (2007) Proc. Natl. Acad. Sci. U.S.A. 104, 9667–9672 [DOI] [PMC free article] [PubMed] [Google Scholar]
- 22.Kubitz R., Saha N., Kühlkamp T., Dutta S., vom Dahl S., Wettstein M., Häussinger D. (2004) J. Biol. Chem. 279, 10323–10330 [DOI] [PubMed] [Google Scholar]
- 23.Day C. P. (2002) Gut 50, 585–588 [DOI] [PMC free article] [PubMed] [Google Scholar]
- 24.Huang S., He X., Ding J., Liang L., Zhao Y., Zhang Z., Yao X., Pan Z., Zhang P., Li J., Wan D., Gu J. (2008) Int. J. Cancer 123, 972–978 [DOI] [PubMed] [Google Scholar]
- 25.Geier A., Zollner G., Dietrich C. G., Wagner M., Fickert P., Denk H., van Rooijen N., Matern S., Gartung C., Trauner M. (2005) Hepatology 41, 470–477 [DOI] [PubMed] [Google Scholar]
- 26.Xie X., Liao H., Dang H., Pang W., Guan Y., Wang X., Shyy J. Y., Zhu Y., Sladek F. M. (2009) Mol. Endocrinol. 23, 434–443 [DOI] [PMC free article] [PubMed] [Google Scholar]
- 27.Yue H. Y., Yin C., Hou J. L., Zeng X., Chen Y. X., Zhong W., Hu P. F., Deng X., Zhang J. P., Ning B. F., Shi J., Zhang X., Lin Y., Xie W. F. (2009) Gut, in press [DOI] [PubMed] [Google Scholar]
- 28.Raver-Shapira N., Marciano E., Meiri E., Spector Y., Rosenfeld N., Moskovits N., Bentwich Z., Oren M. (2007) Mol. Cell 26, 731–743 [DOI] [PubMed] [Google Scholar]
- 29.Chang T. C., Wentzel E. A., Kent O. A., Ramachandran K., Mullendore M., Lee K. H., Feldmann G., Yamakuchi M., Ferlito M., Lowenstein C. J., Arking D. E., Beer M. A., Maitra A., Mendell J. T. (2007) Mol. Cell 26, 745–752 [DOI] [PMC free article] [PubMed] [Google Scholar]
- 30.He L., He X., Lim L. P., de Stanchina E., Xuan Z., Liang Y., Xue W., Zender L., Magnus J., Ridzon D., Jackson A. L., Linsley P. S., Chen C., Lowe S. W., Cleary M. A., Hannon G. J. (2007) Nature 447, 1130–1134 [DOI] [PMC free article] [PubMed] [Google Scholar]
- 31.Cheng A. M., Byrom M. W., Shelton J., Ford L. P. (2005) Nucleic Acids Res. 33, 1290–1297 [DOI] [PMC free article] [PubMed] [Google Scholar]
- 32.Lal A., Kim H. H., Abdelmohsen K., Kuwano Y., Pullmann R., Jr., Srikantan S., Subrahmanyam R., Martindale J. L., Yang X., Ahmed F., Navarro F., Dykxhoorn D., Lieberman J., Gorospe M. (2008) PLoS One 3, e1864. [DOI] [PMC free article] [PubMed] [Google Scholar]
- 33.Hwang-Verslues W. W., Sladek F. M. (2008) Mol. Endocrinol. 22, 78–90 [DOI] [PMC free article] [PubMed] [Google Scholar]
- 34.Pikuleva I. A. (2006) Pharmacol. Ther. 112, 761–773 [DOI] [PubMed] [Google Scholar]


