Abstract
Age-related osteoporosis is accompanied by an increase in marrow adiposity and a reduction in serum insulin-like growth factor-1 (IGF-1) and the binding proteins that stabilize IGF-1. To determine the relationship between these proteins and bone marrow adiposity, we evaluated the adipogenic potential of marrow-derived mesenchymal stromal cells (MSCs) from mice with decreased serum IGF-1 due to knockdown of IGF-1 production by the liver or knock-out of the binding proteins. We employed 10–16-week-old, liver-specific IGF-1-deficient, IGFBP-3 knock-out (BP3KO) and acid-labile subunit knock-out (ALSKO) mice. We found that expression of the late adipocyte differentiation marker peroxisome proliferator-activated receptor γ was increased in marrow isolated from ALSKO mice. When induced with adipogenic media, MSC cultures from ALSKO mice revealed a significantly greater number of differentiated adipocytes compared with controls. MSCs from ALSKO mice also exhibited decreased alkaline-phosphatase positive colony size in cultures that were stimulated with osteoblast differentiation media. These osteoblast-like cells from ALSKO mice failed to induce osteoclastogenesis of control cells in co-culture assays, indicating that impairment of IGF-1 complex formation with ALS in bone marrow alters cell fate, leading to increased adipogenesis.
Keywords: Cell/Stromal, Cell/Differentiation, Cell/Mutant, Hormones/Growth Factors, Tissue/Organ Systems/Adipocyte, Tissue/Organ Systems/Bone, Acid-Labile Subunit, IGF-Binding Proteins
Introduction
In bone marrow (BM),3 cell fate determination is dependent on the local microenvironment. Cell-cell interactions, hormones, and cytokines all play a role in establishing the timing and magnitude of lineage commitment and cellular differentiation into adipocytes, osteoblasts (OBs), or osteoclasts (OCs). OCs and OBs, cells that are essential for bone remodeling, differentiate from stem cells of hematopoietic and mesenchymal origin, respectively (1). Marrow adipocytes are also thought to arise from mesenchymal precursor cells. Interestingly, osteoclastogenesis is closely associated with both osteoblastogenesis and adipogenesis. In the former, OBs produce receptor activator of the NF-κβ ligand (RANKL) and osteoprotegerin, two critical factors in the OC differentiation scheme. In the latter, mature adipocytes secrete adipokines and cytokines that promote OC recruitment and differentiation (2). Moreover, in many circumstances, commitment of mesenchymal stromal cells (MSCs) down the adipogenic lineage precludes OB differentiation. Thus, several lines of evidence support the tenet that osteoclastogenesis is related to adipogenesis in the BM (3, 4).
Increased osteoclastogenesis and BM adiposity are hallmarks of age-related osteoporosis, a syndrome associated with rapid bone loss and architectural deterioration that predisposes individuals to fracture (5). Significant reductions in serum insulin-like growth factor (IGF-1) levels and osteogenesis are also associated with aging (6, 7). However, the relationship between bioavailable IGF-1 and BM cell fate is largely unknown. Recent studies in animal models and humans have demonstrated an important role for the growth hormone/IGF-1 axis in bone growth and remodeling (8, 9), and lipid metabolism (10).
In vitro, IGF-1 and growth hormone induce proliferative and differentiative effects on OCs, OBs, and adipocytes (11, 12). Growth hormone also has lipolytic effects, including induction of hepatic LDL receptors, inhibition of lipoprotein lipase in adipose tissue, and stimulation of triglyceride hydrolysis to glycerol and free fatty acids (13). IGF-1 increases preadipocyte replication and differentiation (14). In general, patients with either growth hormone or IGF-1 deficiencies have increased fat mass and low bone mass. Turnover indices suggest these individuals have increased osteoclastogenesis and decreased osteoblastogenesis (8, 15–17). This paradox appears to be due, at least in part, to the physiological bioactivity of IGF-1 that is modulated by the family of high affinity binding proteins, and an acid-labile subunit (ALS) that together form IGF binary and ternary complexes.
To investigate the possible relationship between BM cell fate and IGF-1 bioavailability, we employed mouse models of IGF-1 deficiency: liver-specific IGF-1-deficient (LID), IGFBP-3 knock-out (BP3KO), and ALS knock-out (ALSKO). These mouse models were previously characterized in vivo, and all show decreased indices of bone formation in the distal femur (18) with normal igf1 gene expression in extrahepatic tissues but variable reductions in circulating levels of total IGF-I (LID, 75%; BP3KO, 40%; and ALSKO, 60%). These reductions are due to lower production of liver IGF-1 in LID, increased peptide degradation in the absence of the IGF-1 ternary complex (IGF-1·IGFBP-3·ALS) in both BP3KO and ALSKO, as well as reduced stability of the remaining binary complex (IGF-1·IGFBP-3) in ALSKO (19–21). In the current study, we evaluated the potential of marrow-derived hematopoietic and mesenchymal stem cells from each model to differentiate into osteoclastogenic, osteogenic, and adipogenic pathways in vitro.
EXPERIMENTAL PROCEDURES
Animals
All mouse strains in this study were backcrossed at least six generations to a C57BL6/J background. Mice were housed 4 per cage in a clean mouse facility, fed standard mouse chow (Purina Laboratory Chow 5001; Purina Mills, St. Louis, MO), and water ad libitum and kept on a 12-h light/dark cycle. Animal care and maintenance were provided through Mount Sinai School of Medicine, an accredited facility (Association for Assessment and Accreditation of Laboratory Animal Care). The Institutional Animal Care and Use Committee of the Mount Sinai School of Medicine approved all procedures.
Marrow Extraction
BM cells were flushed out from femurs of male mice using a 26-gauge needle and collected in α-modified minimum essential medium (αMEM) culture. An 18-gauge needle was used to achieve single cell suspension. Cells were then washed in αMEM culture and cultured in adipogenic or osteogenic conditions (see below).
Adipogenesis
Adipogenesis was performed using Millipore's MSC adipogenesis kit according to the manufacturer's instructions. Briefly, 106 BM derived MSCs were plated on a 24-well plate and maintained overnight in MSC expansion media at 37 °C in a 5% CO2 humidified incubator. When cells reached 100% confluency, adipogenesis induction media (90% Dulbecco's modified Eagle's medium low glucose, 10% fetal bovine serum, 1 μm dexamethasone, 0.5 mm isobutylmethylxanthine, 10 μg/ml insulin, 100 μm indomethacin, and 1× penicillin/streptomycin) was added and replaced every other day. Recombinant human (rh)IGF-1 (10 nm), rhALS (0.01 μg/ml), or rhIGFBP-3 (0.01 μg/ml) were added to cultures as indicated. After 14 days in culture, adipocytes were visualized by oil red staining; medium was aspirated, and cells were fixed in 4% paraformaldehyde for 40 min at room temperature. Fixed cells were then washed twice with 1× phosphate-buffered saline and incubated with oil red solution for 50 min at room temperature. Oil red solution was washed twice with water.
OB Cultures
3 × 10⁶ MSCs were cultured in αMEM supplemented with 10% heat-inactivated fetal bovine serum with β-glycerolphosphate (10 mm) and ascorbic acid (50 mm). Cellular alkaline phosphatase activity was determined using a para-nitrophenol phosphate-based colorimetric assay. Cultures were carried out for different time points as indicated. Alkaline phosphate staining was performed using an alkaline phosphatase kit according to the manufacturer's instructions (Sigma-Aldrich). Results were documented using digital image capture on a microscope (Carl Zeiss AxioCam HRm, AxioVision version 4.4 software, and SteREO Discovery.V12 microscope). Tiled images were assembled into merged figures using Adobe Photoshop CS4. Colony counts and area measurements were made in ImageJ (NIH Image, version 1.42q, JAVA 1.6.0_10).
Co-cultures
MSC cultures derived from 10–16-week-old control, LID, ALSKO, and BP3KO male mice were established as above and plated 3 × 10⁶ cells/well in 6-well plates. Medium was replaced every 3 days, and cells were harvested after 14 days in culture and reseeded 1 × 10⁵ cells/96-well plate in αMEM supplemented with 10% fetal bovine serum. On the following day, BM-nonadherent cells cultured overnight with αMEM were spun down, counted, and co-cultured with the above MSC cultures in a 96-well plate (3 × 10⁴ cells/well) in αMEM supplemented with 10% fetal bovine serum. Co-cultures were then fixed and stained for tartrate-resistant acid phosphatase (TRAP) activity 7 days after replating, and TRAP+ cells containing ≥3 nuclei under light microscopy were counted as mature OCs.
TRAP Staining
Cultures were washed two times with 1× phosphate-buffered saline and fixed with 2.5% glutaraldehyde solution for 15 min at 37 °C. Following two washes with 1× phosphate-buffered saline, a 37 °C warmed TRAP staining solution (0.05 m sodium acetate, 0.025 m sodium tartrate, 0.125 mg/ml Fast Red Violet LB salt, and 0.125 mg/ml naphthol AS-MX phosphate) was added for 10–15 min, and then cells were washed with water.
Gene Expression
Total RNA from BM was extracted using TRIzol reagent according to the manufacturer's instructions (Invitrogen). RNA integrity was verified using Bioanalyzer (Agilent Technologies 2100 Bioanalyzer-Bio Sizing, version A.02.12 SI292). One μg of RNA was reverse-transcribed to cDNA using oligo(dT) primers with a reverse transcription-PCR kit according to the manufacturer's instructions (Invitrogen). Quantitative reverse transcription-PCR was performed with the QuantiTectTM SYBR® green PCR kit (Qiagen) according to the manufacturer's instructions in ABI PRISM 7900HT sequence detection systems (Applied Biosystems, Foster City, CA). Each transcript in each sample was assayed three times, and the fold change ratios between experimental and control samples were calculated relative to β-actin. Sequences of primers are listed in Table 1.
TABLE 1.
Primer sequences
| Gene | Primers | Product size |
|---|---|---|
| c/ebpα | Forward: 5′-TGTTGGGGATTTGAGTCTGTG-3′ | 126 bp |
| Reverse: 5′-GGAAACCTGGCCTGTTGTAAG-3′ | ||
| ap2 | Forward: 5′-AGGAAGGTGAAGAGCATCATA-3′ | 125 bp |
| Reverse: 5′-CATAACACATTCCACCACCAG-3′ | ||
| pparγ | Forward: 5′-AGGCCGAGAAGGAGAAGCTGTTG-3′ | 276 bp |
| Reverse: 5′-TGGCCACCTCTTTGCTCTGCTC-3′ | ||
| rankl | Forward: 5′-GCTCCGAGCTGGTGAAGAAA-3′ | 82 bp |
| Reverse: 5′-CCCCAAAGTACGTCGCATCT-3′ |
Purification of rhALS
Chinese hamster ovary cells were transfected with full-length human ALS cDNA that had been prepared from a human hepatocyte cDNA library using PCR. The PCR primers were constructed such that the 3′ primer contained a polyhistidine tag. The PCR product was ligated into pLenti D/TOPO/V5, transfected into 293 cells, and virus-prepared and purified. The virus was used to directly transfect the Chinese hamster ovary/K1 cells. After determining expression of the protein by immunoblotting, 3 liters of serum-free conditioned medium was collected, and the protein was precipitated using 70% ammonium sulfate. The pellet was reconstituted in 0.05 m phosphate, 4 mm EDTA (pH 7.2) and passed over a phenyl-Sepharose column that had been equilibrated with the same buffer. Fractions containing ALS were eluted with the same buffer containing 2 mm NaCl. This material, diluted until the salt concentration was 0.4 m, was applied to a wheat germ agglutinin affinity column and eluted with 0.5 m N-acetyl-d-glucosamine. The N-acetyl-d-glucosamine was removed from the solution using batch extraction with phenyl-Sepharose. The purified material was then applied to a nickel agarose column in the same buffer supplemented with 10 mm imidazole. It was eluted in the same buffer containing 250 mm imidazole. The eluted protein was analyzed by immunoblotting for ALS and silver staining. A single band was detected on silver staining that migrated at the same electrophoretic mobility as the band that was detected by immunoblotting.
Statistical Analysis
Significant differences among groups were assessed by one-way analysis of variance. The type I error rate (α) was set at 0.05. Differences between groups were compared using post hoc Bonferroni-adjusted multiple comparisons (SYSTAT software, SPSS Science).
RESULTS
Effects of Gene Inactivation on OB Differentiation
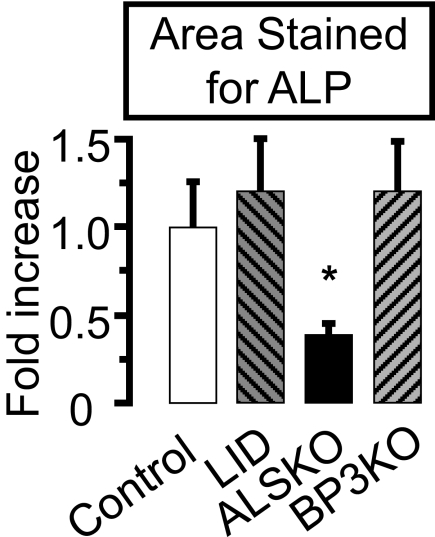
To understand whether OB cellular behavior is altered in states of IGF-1 complex alterations, we cultured MSCs derived from the different mouse groups. Cultures from ALSKO mice exhibited similar numbers of OB-like colonies with a 2.5-fold smaller area of alkaline phosphatase staining compared with the control (Fig. 1). In contrast, neither colony number nor area in OB-like cultures derived from the other mutant mice differed from the control.
FIGURE 1.
Effects of als and igfbp-3 gene inactivation on primary osteoblast cultures. Osteoblast cultures derived from control, LID, ALSKO, and BP3KO 16-week-old male mice were maintained for 14 days and stained for alkaline phosphatase activity. Stained area was normalized to the control value. Data are presented as mean ± S.E. of n > 5 mice per genotype. *, p < 0.05 versus control.
Adipogenesis in BM-derived MSC Is Altered by ALS
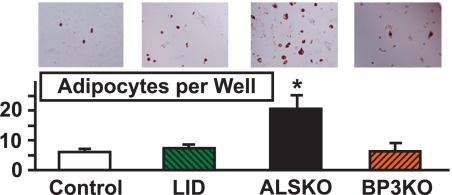
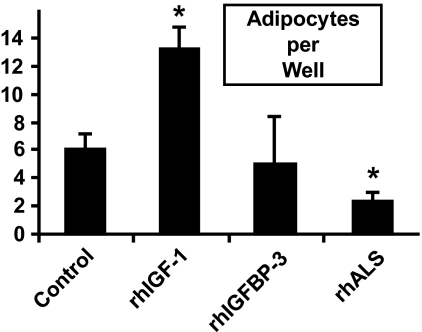
To determine the adipogenic potency of MSC derived from each of the four groups, cells were plated in adipogenesis induction media and the number of adipocytes was determined on day 14. MSC cultures derived from ALSKO had significantly more oil red positive cells as compared with cultures derived from controls (Fig. 2). Next, we tested whether addition of rhALS or rhIGFBP-3 proteins can inhibit adipogenesis of MSC cells derived from control mice. rhIGF-1, rhALS, or rhIGFBP-3 was added to 14-day adipocyte cultures derived from MSC of control mice. Whereas addition of rhIGF-1 led to increased number of adipocytes as expected, rhALS inhibited the differentiation to adipocytes (Fig. 3). In these conditions, ALS, and not IGFBP-3, appeared to modulate adipocyte differentiation.
FIGURE 2.
Effects of als and igfbp-3 gene inactivation on bone marrow-derived adipocyte differentiation. Bone marrow cells were isolated from 8–10-week-old control (n = 5), LID (n = 5), ALSKO (n = 4), and BP3KO (n = 4) mice and cultured in adipogenic media, as described under “Experimental Procedures.” Adipocytes were detected by Oil-Red-O staining 14 days following adipogenesis induction and are presented as number of adipocytes per well. Data are expressed as mean ± S.E. *, p < 0.05 versus control.
FIGURE 3.
Recombinant ALS inhibits adipogenesis of MSC cells. MSC cultures derived from 8–10-week-old control mice (n = 5) were induced with adipogenic media in the presence of insulin (10 μg/ml) and rhIGF-1 (10 nm), rhIGFBP-3 (1 μg/ml), or rhALS (0.01 μg/ml). Data are expressed as mean ± S.E. *, p < 0.05 versus control.
Increased Adipogenic Transcription Factor Peroxisome Proliferator-activated Receptor γ (PPARγ) in BM from ALS-deficient Mice
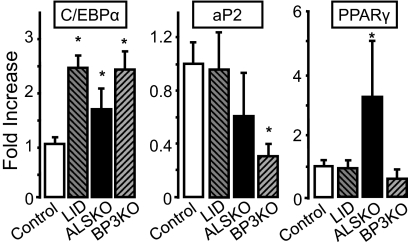
To understand the reason for increased adipogenic potential of ALSKO-derived MSCs, we assessed gene expression levels of CCAAT/enhancer-binding protein-α (C/EBP-α), adipocyte protein 2 (aP2), and PPARγ transcription factors, in BM extracted from LID, ALSKO, BP3KO, and control mice (Fig. 4). Whereas expression levels of the C/EBP-α gene were greater than the control in all mutants, only ALSKO mice showed a greater BM expression of PPARγ, a late marker of adipocyte differentiation.
FIGURE 4.
Expression of adipogenic markers in bone marrow of IGF mutant mice. Gene expression of c/ebp-α, ap2, and pparγ was assessed by real-time PCR in marrow taken from 8–16-week-old control (n = 4), LID (n = 3), ALSKO (n = 5), and BP3KO (n = 4) mice. Data are expressed as mean ± S.E. *, p < 0.05 versus control mice.
Co-culture of OBs Derived from ALSKO with Nonadherent Cells Derived from Control Fails to Support Osteoclastogenesis
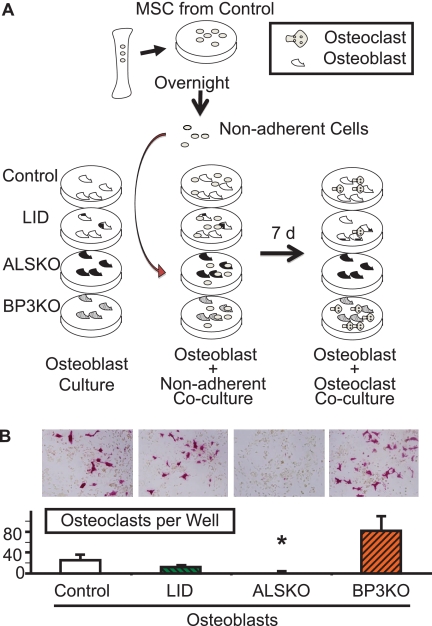
In view of increased adipogenesis in MSC cultures derived from ALSKO mice, we explored the potential of ALSKO-derived OB to support osteoclastogenesis. We established co-cultures of OBs derived from each of the four groups, with BM-nonadherent cells (enriched in hematopoietic stem cells that give rise to osteoclasts) derived from control mice (Fig. 5A). We found that OB cultures derived from ALSKO mice failed to support osteoclastogenesis, as evident by few TRAP+ cells in co-cultures (Fig. 5B). These data are also supported by primary osteoclast cultures derived from ALSKO mice, which show reduced numbers of osteoclasts in culture (supplemental Fig. 1A). Importantly, addition of rhALS rescued osteoclastogenesis in these cultures (supplemental Fig. 1B), whereas addition of IGF-1 failed to attain a rescue (supplemental Fig. 1C). Unlike ALSKO, OBs derived from BP3KO or LID mice supported osteoclastogenesis and showed similar numbers of OCs per well as compared with the control. Together, these data suggest that ALS has a role in the determination of cell fate in marrow.
FIGURE 5.
Co-culture of osteoblasts derived from ALSKO mice with BM-nonadherent cells derived from control mice failed to support osteoclastogenesis. A, schematic of the co-culture protocol. B, osteoblast-like cells derived from 8–10-week-old control (n = 5), LID (n = 5), ALSKO (n = 4), and BP3KO (n = 4) mice were co-cultured with BM-nonadherent cells derived from control mice and stained for TRAP after 7 days in culture. TRAP+ cells were counted in 3 wells per mouse per genotype. Data are expressed as mean ± S.E. *, p < 0.05 versus control.
DISCUSSION
Although the stabilizing influence of the binary and ternary complexes on insulin-like growth factor-1 (IGF-1) in serum are well known, little effort has been devoted to determining what possible autocrine/paracrine roles the IGF-1 binding proteins have in marrow (22–25). Binding proteins, such as IGFBP-3 and the ALS, are found locally in tissue and fluid compartments, in and out of serum in both mice and humans (18, 26). Locally produced IGF-1 predominates over circulating IGF-1 in maintaining skeletal integrity (27), and both ALS and IGFBP-3 play crucial roles in regulating skeletal function (18).
In the present study, we found that induction of OB-like cultures derived from the BM MSCs of ALSKO mice exhibited similar numbers of colonies but significantly decreased area of alkaline phosphatase activity compared with all other groups. Therefore, despite greater IGF-1 bioavailability, in the absence of ALS, OB differentiation, and/or proliferation was significantly lower. The alkaline phosphatase assay is the gold standard for measuring OB activity in MSC culture induced for osteoblastogenesis. However, the possibility exists that the assay captures MSC, pre-OB, or even preadiopocyte alkaline phosphatase activity. In fact, a recent study demonstrated that pre-adipocytes exhibit alkaline phosphatase activity at relatively high levels (28). Regardless, the decreased proliferation observed in this current in vitro study combined with the OB/adipocyte lineage allocation proposal, led us to investigate BM markers of differentiation in IGF-deficient mice.
Marrow adipocytes also differentiate from MSCs. In a study where C/EBP-α was expressed in a dose-dependent manner, it was shown that OB differentiation occurs with low C/EBP-α levels, whereas adipocyte formation begins as C/EBP-α expression increases (29). We found that BM expression of C/EBP-α was increased ∼2-fold in all IGF-deficient models. However, PPARγ expression, a late marker of adipogenesis, was increased only in BM of ALSKO mice. These data suggest that BM cells, derived from ALSKO mice, completed adipogenesis, whereas cells derived from LID and/or BP3KO mice were arrested in an early preadipogenic stage. Our findings are also in accordance with a previous study showing that decreased igf1 expression and translation in MSCs associated with activation of PPARγ transcription factor and suppressed bone formation by regulating OB/adipocyte lineage allocation to enhance BM adipogenesis (30). Low IGF-1 associated with polymorphisms in the human pparγ gene has been linked to low bone mineral density and obesity (31, 32). A recent study also demonstrated that reducing IGF-1 by activating pparγ in mice with rosiglitazone increased BM adiposity and suppressed bone formation, another indication of the importance of BM cell fate (33).
Our results further suggest that in addition to significant alteration in serum IGF-1, differences in BM levels of ALS may lead to the preferential differentiation of MSC into adipocytes that accompany an increase in marrow adiposity. Ex vivo studies with MSC cultures derived from ALSKO mice revealed significantly more adipocytes as compared with cultures derived from all other mice. Moreover, we found that addition of rhALS significantly inhibited adipocyte differentiation in MSC-derived cultures from control mice. Together, these findings suggest that IGF-1 binding to ALS, affects adipocyte progenitor differentiation.
Another important finding of our study was that OB-like cultures derived from ALSKO mice failed to support osteoclastogenesis of BM nonadherent cells derived from control mice. This was in sharp contrast to OB-like cultures derived from BP3KO or LID mice, where TRAP-positive, multinucleated cells were detected. These in vitro data may be viewed in light of fluorescence-activated cell sorter data demonstrating that receptor activator of NF-κβ ligand (RANKL) gene expression in pre-B (B220+) cells from BM of ALSKO was significantly less than that of the control (supplemental Fig. 2). Meanwhile, compared with the control, monocyte differentiation does not appear to be affected by a lack of ALS (supplemental Fig. 3) and ALSKO OC function on hydroxyapatite is not inhibited in vitro (supplemental Fig. 4). When combined with the previous results, these data implicate ALS as an important regulator of the adipogenic program directly and OC indirectly.
Our observations could be clinically important because marrow adiposity is a well recognized phenotype observed during growth and aging in both humans and mice. Recent clinical imaging studies have revealed inverse relationships between BM adiposity and both age of the individual and the amount of bone in the axial and appendicular skeleton (34, 35). Similar observations have also been made in girls with anorexia nervosa and in mice. In both cases marrow adiposity does not correlate with body adiposity but is inversely related to levels of bone formation (36, 37). Decreases in IGF-1 levels during aging are associated with increases in adiposity in both humans and mice (21). Due to the difficulties inherent in measuring ALS, scarce reports of their levels exist in the literature (22). However, it seems likely that they are also decreased during aging as has been described in cancer patients (23). Whether BM adipogenesis has a direct role in age-related bone loss and increased fracture risk is a matter of debate. In advanced age, BM adipocytes may reflect passive accumulation of fat as bone is lost and marrow space increases. Alternatively, MSCs may actively favor differentiation to the adipogenic over the osteoblastic lineage with aging.
This study has two limitations of note. First, it was performed in vitro and may not reflect accurately the in vivo environment. Second, the experiments were performed on BM isolated from long bones of adult (10–16-week-old) male mice; age, gender, and skeletal site may be critical covariates.
Despite the limitations, we have now demonstrated a link between the reduced IGF-1 complex formation and increased adipogenic potential of MSC in vitro. The mutant mice reported in this study exhibit low bone mineral density (9, 18, 19, 21), which may result from preferential differentiation of MSCs to the adipogenic lineage. However, extensive studies demonstrating an essential role for IGF-1 in adipocyte differentiation in vitro have not yet clearly demonstrated why states of reduced serum IGF-1 levels should be more permissive for adipocyte differentiation in vivo. Our study further reinforces the tenet that the BM micro-environment includes a strong interaction among hematopoietic stem cells, OBs, and adipocytes and raises the possibility that ALS plays a more active role in the assignment of cell fate in BM than previously thought.
Supplementary Material
Acknowledgment
We thank Dr. David Lagunoff, head of the Histology and Imaging Core Facility at the University of Medicine and Dentistry of New Jersey for imaging assistance.
This work was supported, in whole or in part, by National Institutes of Health Grants AR054919 and AR055141 (to S. Y.), AG02331 (to D. C.), and AR045433, AR053853, and AR054604 (to C. J. R.). This work was also supported by a Charles H. Revson Foundation Fellowship (to J. C. F.).

The on-line version of this article (available at http://www.jbc.org) contains supplemental Figs. 1–4.
- BM
- bone marrow
- ALS
- acid-labile subunit
- αMEM
- α-modified minimum essential medium
- aP2
- adipocyte protein 2
- C/EBP
- CCAAT/enhancer-binding protein
- IGF
- insulin-like growth factor
- BP3KO
- IGF binding protein-3 knock-out
- LID
- liver IGF-1-deficient
- MSC
- mesenchymal stromal cell
- OB
- osteoblast
- OC
- osteoclast
- PPAR
- peroxisome proliferator-activated receptor
- RANKL
- receptor activator of NF-κβ ligand
- rh
- recombinant human
- TRAP
- tartrate-resistant acid phosphatase.
REFERENCES
- 1.Prockop D. J. (1997) Science 276, 71–74 [DOI] [PubMed] [Google Scholar]
- 2.Boyle W. J., Simonet W. S., Lacey D. L. (2003) Nature 423, 337–342 [DOI] [PubMed] [Google Scholar]
- 3.Nuttall M. E., Patton A. J., Olivera D. L., Nadeau D. P., Gowen M. (1998) J. Bone Miner. Res. 13, 371–382 [DOI] [PubMed] [Google Scholar]
- 4.Shockley K. R., Lazarenko O. P., Czernik P. J., Rosen C. J., Churchill G. A., Lecka-Czernik B. (2009) J. Cell Biochem. 106, 232–246 [DOI] [PMC free article] [PubMed] [Google Scholar]
- 5.Meunier P., Aaron J., Edouard C., Vignon G. (1971) Clin. Orthop. Relat. Res. 80, 147–154 [DOI] [PubMed] [Google Scholar]
- 6.Kasukawa Y., Miyakoshi N., Mohan S. (2004) Curr. Pharm. Des. 10, 2577–2592 [DOI] [PubMed] [Google Scholar]
- 7.Niu T., Rosen C. J. (2005) Gene 361, 38–56 [DOI] [PubMed] [Google Scholar]
- 8.Ueland T. (2004) Growth Horm. IGF Res. 14, 404–417 [DOI] [PubMed] [Google Scholar]
- 9.Yakar S., Rosen C. J., Beamer W. G., Ackert-Bicknell C. L., Wu Y., Liu J. L., Ooi G. T., Setser J., Frystyk J., Boisclair Y. R., LeRoith D. (2002) J. Clin. Invest. 110, 771–781 [DOI] [PMC free article] [PubMed] [Google Scholar]
- 10.Nam S. Y., Lobie P. E. (2000) Obes. Rev. 1, 73–86 [DOI] [PubMed] [Google Scholar]
- 11.Giustina A., Mazziotti G., Canalis E. (2008) Endocr. Rev. 29, 535–559 [DOI] [PMC free article] [PubMed] [Google Scholar]
- 12.Shang C. A., Waters M. J. (2003) Mol. Endocrinol. 17, 2494–2508 [DOI] [PubMed] [Google Scholar]
- 13.Rudling M., Norstedt G., Olivecrona H., Reihnér E., Gustafsson J. A., Angelin B. (1992) Proc. Natl. Acad. Sci. U.S.A. 89, 6983–6987 [DOI] [PMC free article] [PubMed] [Google Scholar]
- 14.Hausman D. B., DiGirolamo M., Bartness T. J., Hausman G. J., Martin R. J. (2001) Obes. Rev. 2, 239–254 [DOI] [PubMed] [Google Scholar]
- 15.Laron Z., Ginsberg S., Lilos P., Arbiv M., Vaisman N. (2006) Clin. Endocrinol. (Oxf.) 65, 114–117 [DOI] [PubMed] [Google Scholar]
- 16.Bachrach L. K., Marcus R., Ott S. M., Rosenbloom A. L., Vasconez O., Martinez V., Martinez A. L., Rosenfeld R. G., Guevara-Aguirre J. (1998) J. Bone Miner. Res. 13, 415–421 [DOI] [PubMed] [Google Scholar]
- 17.Misra M., Bredella M. A., Tsai P., Mendes N., Miller K. K., Klibanski A. (2008) Am. J. Physiol. Endocrinol. Metab. 295, E385–392 [DOI] [PMC free article] [PubMed] [Google Scholar]
- 18.Yakar S., Rosen C. J., Bouxsein M. L., Sun H., Mejia W., Kawashima Y., Wu Y., Emerton K., Williams V., Jepsen K., Schaffler M. B., Majeska R. J., Gavrilova O., Gutierrez M., Hwang D., Pennisi P., Frystyk J., Boisclair Y., Pintar J., Jasper H., Domene H., Cohen P., Clemmons D., LeRoith D. (2009) FASEB J. 23, 709–719 [DOI] [PMC free article] [PubMed] [Google Scholar]
- 19.Yakar S., Bouxsein M. L., Canalis E., Sun H., Glatt V., Gundberg C., Cohen P., Hwang D., Boisclair Y., Leroith D., Rosen C. J. (2006) J. Endocrinol. 189, 289–299 [DOI] [PubMed] [Google Scholar]
- 20.Yakar S., Liu J. L., Stannard B., Butler A., Accili D., Sauer B., LeRoith D. (1999) Proc. Natl. Acad. Sci. U.S.A. 96, 7324–7329 [DOI] [PMC free article] [PubMed] [Google Scholar]
- 21.Domené H. M., Bengolea S. V., Jasper H. G., Boisclair Y. R. (2005) J. Endocrinol. Invest. 28, 43–46 [PubMed] [Google Scholar]
- 22.Garnero P., Sornay-Rendu E., Delmas P. D. (2000) Lancet 355, 898–899 [DOI] [PubMed] [Google Scholar]
- 23.Domené H. M., Hwa V., Argente J., Wit J. M., Camacho-Hübner C., Jasper H. G., Pozo J., van Duyvenvoorde H. A., Yakar S., Fofanova-Gambetti O. V., Rosenfeld R. G. (2009) Horm. Res. 72, 129–141 [DOI] [PubMed] [Google Scholar]
- 24.Sztefko K., Hodorowicz-Zaniewska D., Popiela T., Richter P. (2009) Adv. Med. Sci. 54, 51–58 [DOI] [PubMed] [Google Scholar]
- 25.Chan S. S., Schedlich L. J., Twigg S. M., Baxter R. C. (2009) Am. J. Physiol. Endocrinol. Metab. 296, E654–E663 [DOI] [PubMed] [Google Scholar]
- 26.Labarta J. I., Gargosky S. E., Simpson D. M., Lee P. D., Argente J., Guevara-Aguirre J., Rosenfeld R. G. (1997) Clin. Endocrinol. (Oxf.) 47, 657–666 [DOI] [PubMed] [Google Scholar]
- 27.Fritton J. C., Emerton K., Sun H., Kawashima Y., Mejia W., Wu Y., Rosen C. J., Panus D., Bouxsein M., Majeska R. J., Schaffler M. B., Yakar S. (2010) J. Bone Miner. Res., in press [DOI] [PMC free article] [PubMed] [Google Scholar]
- 28.Ali A. T., Penny C. B., Paiker J. E., van Niekerk C., Smit A., Ferris W. F., Crowther N. J. (2005) Clin. Chim. Acta 354, 101–109 [DOI] [PubMed] [Google Scholar]
- 29.Fux C., Mitta B., Kramer B. P., Fussenegger M. (2004) Nucleic Acids Res. 32, e1–9 [DOI] [PMC free article] [PubMed] [Google Scholar]
- 30.Lecka-Czernik B., Ackert-Bicknell C., Adamo M. L., Marmolejos V., Churchill G. A., Shockley K. R., Reid I. R., Grey A., Rosen C. J. (2007) Endocrinology 148, 903–911 [DOI] [PMC free article] [PubMed] [Google Scholar]
- 31.Ristow M., Müller-Wieland D., Pfeiffer A., Krone W., Kahn C. R. (1998) N. Engl. J. Med. 339, 953–959 [DOI] [PubMed] [Google Scholar]
- 32.Ogawa S., Urano T., Hosoi T., Miyao M., Hoshino S., Fujita M., Shiraki M., Orimo H., Ouchi Y., Inoue S. (1999) Biochem. Biophys. Res. Commun. 260, 122–126 [DOI] [PubMed] [Google Scholar]
- 33.Rzonca S. O., Suva L. J., Gaddy D., Montague D.C., Lecka-Czernik B. (2004) Endocrinology 145, 401–406 [DOI] [PMC free article] [PubMed] [Google Scholar]
- 34.Di Iorgi N., Rosol M., Mittelman S. D., Gilsanz V. (2008) J. Clin. Endocrinol. Metab. 93, 2281–2286 [DOI] [PMC free article] [PubMed] [Google Scholar]
- 35.Liney G. P., Bernard C. P., Manton D. J., Turnbull L. W., Langton C. M. (2007) J. Magn. Reson. Imaging 26, 787–793 [DOI] [PubMed] [Google Scholar]
- 36.Ackert-Bicknell C. L., Shockley K. R., Horton L. G., Lecka-Czernik B., Churchill G. A., Rosen C. J. (2009) Endocrinology 150, 1330–1340 [DOI] [PMC free article] [PubMed] [Google Scholar]
- 37.Verma S., Rajaratnam J. H., Denton J., Hoyland J. A., Byers R. J. (2002) J. Clin. Pathol. 55, 693–698 [DOI] [PMC free article] [PubMed] [Google Scholar]
Associated Data
This section collects any data citations, data availability statements, or supplementary materials included in this article.


