Abstract
The existence of cancer stem cells (CSCs) or stem-like cancer cells (SLCCs) is regarded as the cause of tumor formation and recurrence. However, the origin of such cells remains controversial with two competing hypotheses: CSCs are either transformed from tissue adult stem cells or dedifferentiated from transformed progenitor cells. Compelling evidence has determined the chromosomal aneuploidy to be one of the hallmarks of cancer cells, indicating genome instability plays an important role in tumorigenesis, for which CSCs are believed to be the initiator. To gain direct evidence that genomic instability is involved in the induction of SLCCs, we utilized multiple approaches to enhance genomic instability and monitored the percentage of SLCC in cultured cancer cells. Using side population (SP) cells as a marker for SLCC in human nasopharyngeal carcinoma (NPC) and CD133 for human neuroblastoma cells, we found that DNA damage inducers, UV and mitomycin C were capable of increasing SP cells in NPC CNE-2 and neuroblastoma SKN-SH cells. Likewise, either overexpression of a key regulator of cell cycle, Mad2, or knock down of Aurora B, an important kinase in mitosis, or Cdh1, a key E3 ligase in cell cycle, resulted in a significant increase of SP cells in CNE-2. More interestingly, enrichment of SP cells was observed in recurrent tumor tissues as compared with the primary tumor in the same NPC patients. Our study thus suggested that, beside transformation of tissue stem cells leading to CSC generation, genomic instability could be another potential mechanism resulting in SLCC formation, especially at tumor recurrence stage.
Keywords: Cancer, Cell/Cycle, DNA/Damage, Gene, Genetics/Somatic Cell, Stem Cells, Tumor, Cancer Stem Cells, Stem-like Cancer Cells
Introduction
Current evidence suggests that only a small fraction of cells within a tumor are responsible for the initiation, growth, and development of tumor pending on the animal model (1, 2), and such cells have been designated to be “cancer stem cells” (CSCs)4 (3, 4), or “stem-like cancer cells” (SLCCs) (2). Indeed, such tumor-maintaining or -initiating stem cells have been isolated from hematological malignancies (5, 6) and from a number of solid tumors, including breast (7), brain (8), prostate (9), and colon cancer (10, 11). However, the origin of CSCs or SLCCs has been little explored, although there are two controversial hypotheses in the literature. One is that adult stem cells in various tissues could be transformed into malignancies through multiple steps, during which multiple genes are involved in. Another one is that dedifferentiation of transformed malignant cells results in production of CSCs or SLCCs (2). In fact, both hypotheses have been challenged to be firmly supported by empirical evidence. Recent reports have demonstrated that the pluripotent stem cells could be generated from somatic cells by defined factors, including Oct4, Sox2, c-Myc, Klf4, Nanog, and Lin28 (12–14), and that the cells with epithelial-mesenchymal transition also have the characteristics of stem cells (15, 16). Collectively, stem cells or stem-like cells, including CSCs or SLCCs, may be inducible under certain circumstances, such as genetic or epigenetic alteration in somatic cells.
Recently, a correlation between CSCs and genomic instability has been suggested (17, 18). Cancer is considered to be a genetic disease with multiple genetic mutations or epigenetic changes, including chromosome deletion and amplification, gene mutation and DNA hypermethylation, which may eventually cause genomic instability (19). Two critical physiological mechanisms, DNA repair and apoptosis, play critical roles in preventing such alternation and even cancer occurrence (19). Subsequently, any particular tumor cells are highly heterogeneous. For instance, the number of chromosomes varies from 17 to 107, and the size of nuclei differs from 5 to 58 μm in nasopharyngeal carcinoma (NPC) cells (20). Cancer cells, therefore, could be considered as a highly heterogenetic population at both genomic and phenotype levels, whereas certain cells may possess growth advantage over other cancer cells owing to their specific genotypes and stronger survival capacity. Based on these observations, we hypothesized that genomic instability could be a potential mechanism for SLCC formation, especially at the tumor recurrence stage after chemotherapy with genotoxic agents.
EXPERIMENTAL PROCEDURES
Cell Culture and Clone Selection
A human NPC cell line CNE-2 and a human neuroblastoma cell line SKN-SH (from the ATCC and stored in our laboratory) and their clones were maintained in Dulbecco's modified Eagle's medium or RPMI 1640 medium (Invitrogen) supplemented with 10% fetal bovine serum, 100 units/ml penicillin G, and 100 μg/ml streptomycin at 37 °C in 5% CO2. The individual clones derived from CNE-2 or SKN-SH cells were isolated from a single cell by limited dilution methods.
Flow Cytometry
The CNE-2 cells and its single clone were harvested and resuspended at a concentration of 1 × 10⁶ cells/ml. The DNA binding dye, Hoechst 33342 (Sigma-Aldrich), was then added to a final concentration of 5 μg/ml and incubated for 90 min in the dark with interval mixing. After washed twice with PBS, the cells were kept at 4 °C in the dark before flow cytometry (EPICS ALTRA Flow Cytosorter, Beckman Coulter) using dual-wavelength analysis. On the other hand, a subset of the cells was incubated with 5 μm fumitremorgin C (FTC, a specific inhibitor of ABCG2, Sigma-Aldrich) for 5 min at 37 °C prior to adding Hoechst 33342 to determine whether this would block the fluorescent efflux of SP cells in CNE-2. We selected two single cell clones (SP) cells, CNE-2-S22 and CNE-2-S26 (a kind gift from Dr. Chao-Nan Qian, China) (21), for further experiments. Similarly, each clone from SKN-SH was harvested and added with CD133-PE monoclonal antibody (Miltenyi Biotec) at 4 °C in the dark before flow cytometric analysis. We selected a single cell clone, SKN-SH-C8, for further experiments.
UV Light and Mitomycin C Treatment
Before treatment with UV light, the medium was changed for PBS. The cells were under UV light irradiation for 15 s, and then PBS was removed and replaced with culture medium. After 24–48 h, the cells were harvested for flow cytometry analysis. For mitomycin C treatment, mitomycin C was added to the medium at the final concentration of 2.5 μg/ml for 24–48 h, and then the cells were harvested for flow cytometry analysis and immunocytochemistry staining.
Transfection of Mad2, Aurora Kinase B, and Cdh1
The plasmids of 6×Myc-Mad2 (a kind gift from Dr. Sasakawa, Japan) (22) and HA-Aurora kinase B (a kind gift from Dr. Jun Zhou, China) (23) were used previously as indicated. The plasmid of Myc-Cdh1 was constructed in our laboratory. Lipofectamine 2000 (Invitrogen) was used for transfecting these plasmids into CNE-2-S22 (for Mad2 stable transfection) or S26 cells (for Aurora B and Cdh1 rescue experiment) as described in the manufacturer's protocol. After 24 h, the transfected CNE-2-S22 cells were transferred into p100 dishes, and G418 (Calbiochem) was added at the final concentration of 600 μg/ml. After selection for 2 weeks, multiple clones were picked up and transferred into 24-well plates, and then Western blot was performed to check the expression of exogenous genes in the stable CNE-2-S22-Mad2 cell clone.
Suspension Culture and Colony Formation Assay
CNE-2-S22 and CNE-2-S22-Mad2 cells were counted, plated in triplicate at 300 cells per well in ultra-low attachment 6-well plates (Corning), and cultured with Dulbecco's modified Eagle's medium/F-12 medium mixed with 20 ng/ml epidermal growth factor (R&D Systems), 20 ng/ml basic fibroblast growth factor (R&D Systems), and B-27 supplement (Invitrogen) for ∼2 weeks. The spheroids, also named nasospheres, were counted with microscope. The nasosphere formation efficiency was the ratio of the nasosphere number to the planted cell number.
For colony formation assays, CNE-2-S22 and CNE-2-S22-Mad2 cells were counted and plated in triplicate at 100 cells per well in 6-well plates, and cultured with Dulbecco's modified Eagle's medium supplemented with 10% fetal bovine serum for ∼10 days. After most cell clones had expanded to >50 cells, they were washed twice with PBS, fixed in methanol for 15 min, and dyed with crystal violet for 15 min at room temperature. After washing out the dye, we counted the colony number that contained >50 cells and compared the results. The colony formation efficiency was the radio of the colony number to the planted cell number.
Spectral Karyotyping
Metaphase chromosome spreads were prepared according to the methods reported (24). For spectral karyotyping (SKY), the slide was treated with DNase-free RNase solution (0.1 mg/ml) at 37 °C for 1 h, washed in 2 × SSC (sodium chloride and sodium citrate) for 10 min at room temperature, dehydrated in 70%, 85, and 95% ethanol at room temperature for 2 min, and air dried. Next, the slide was treated with proteinase K (0.05 g/ml) at 37 °C, washed in 2 × SSC at room temperature, fixed in 1% paraformaldehyde, and washed in 2 × SSC at room temperature, for 10 min each, followed by dehydration in ethanol as above. The slide was placed in 70% formamide/2 × SSC at 70 °C for 4 min and dehydrated in ethanol. Four microliters of SKY probe from Applied Spectral Imaging (Migdal Ha'Emek, Israel) was denatured at 80 °C for 7 min. The denatured probe was incubated at 37 °C for 1 h. The timing was controlled such that the incubated SKY probe was added onto the slide right after the denatured slide was dehydrated. The probed slide was incubated in a humidified chamber at 37 °C for over 36 h. The procedures for detection followed the recommendations of Applied Spectral Imaging. SKY images were captured using the SkyVision Imaging System equipped with a Zeiss Axioplan 2 fluorescence microscope. Karyotyping was performed using the special software provided by Applied Spectral Imaging (SKY View 2.0).
RNA Interference of Mad2, Aurora B Kinase, and Cdh1
The siRNA targeting Mad2 (5′-AAGAGUCGGGACCACAGUUUA-3′) (25), Aurora B (ON-TARGETplus SMARTpool, Dharmacon), and Cdh1 (5′-UGAGAAGUCUCCCAGUCAGUU-3′, Dharmacon) at the final concentration of 50 nm was transfected into CNE-2-S22 or CNE-2-S26 at 30–50% confluence using Lipofectamine 2000 (Invitrogen). Cells were harvested after siRNA transfection for 96 h.
Western Blotting
Cells were lysed in the presence of 50 mm Tris, pH 7.5, 150 mm NaCl, and 0.5% Nonidet P-40 on ice. Fifty micrograms of total protein from each sample was resolved on a 12% Bis-Tris gel with MOPS running buffer and transferred to nitrocellulose membranes. The blots were then incubated with various antibodies, including anti-glyceraldehyde-3-phosphate dehydrogenase (Abcam), anti-Myc (Santa Cruz Biotechnology), anti-Cdh1 (Abcam), and anti-Aurora B and anti-Sox2 (Cell Signaling Technology).
Immunocytochemistry Staining of ABCG2 and CD133 in Cultured Cells
All the cells after UV or mitomycin C treatment were span down on slides and fixed with cold acetone. The slides were immersed in 3% H2O2 for 10 min and washed with PBS for three times. The tissue sections were then blocked with goat serum for 20 min, and the primary antibody, anti-ABCG2 (Novus) and anti-CD133 (Abcam), diluted in primary antibody diluting buffer (Dako) at 1:50 was added and incubated at 4 °C overnight in a wet container. After washed with PBS for three times, the tissue slides were treated with non-biotin horseradish peroxidase detection system (Dako) and washed with PBS for three times. Afterward, the tissue sections were stained with 3,3-diaminobenzidine and hematoxylin was applied for counterstaining.
Immunohistochemistry Staining of ABCG2 in NPC Tumor Tissues
The tissue sections of NPC were paraffin-embedded. After deparaffinization and rehydration, the tissue sections were processed with antigen retrieval by boiling the slides in sodium citrate buffer (10 mm, pH 6.0). Other steps followed standard immunocytochemistry staining.
Copy Number Variation Analysis
Two recurrent NPC tissues as well as matched primary tissues were formalin-fixed and paraffin-embedded. Those four tissues were dewaxed in xylene, and DNA was isolated by using a NucleoSpin Tissue kit (Macherey-Nagel) according to the manufacturer's instructions. After amplification, extracted DNA was hybridized on Affymetrix Genome-Wide Human SNP 6.0 array following the manufacturer's protocol. The data of hybridization was analyzed by a Segmentation algorithm of Partek Genomics Suite. Experiment process and data analysis were performed by CapitalBio Corp. in Beijing, China.
RESULTS
SLCCs Were Induced by DNA Damage
The SP cells, as observed in several normal tissues and tumors, including glioblastoma (26) and gastrointestinal system tumor (27), have been showed to have the characteristics of stem cells (28, 29). In a previous study, we tested whether there were SP cells in NPC cell lines, and five such cell lines were examined using Hoechst 33342, a DNA binding dye, which effluxes DNA out of membrane. The results showed that the SP cell populations differed from 0.1% to 6.8% in the cell lines. Furthermore, we demonstrated that these SP cells had stem cell characteristics, such as self-renewal, differentiation, strong tumorigenesis ability in vivo, and resistance to chemotherapy or radiotherapy (30). Thus, we considered these SP cells as SLCCs for NPC cells, and CD133 was regarded as a marker for SLCCs for neuroblastoma cells in this study.
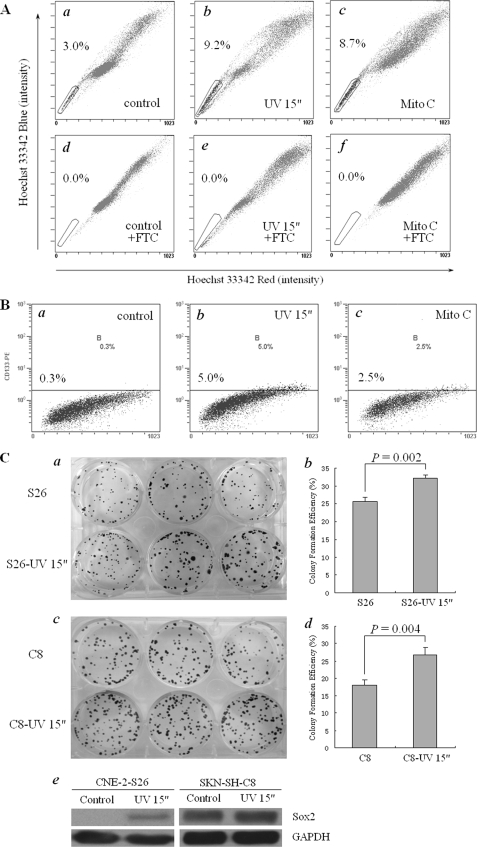
We used a single cell clone CNE-2-S26, which was derived from a commonly used NPC cell line CNE-2, to test the hypothesis that genomic instability may contribute to generation of SLCCs. The CNE-2 cells, as we detected in our previous study, had 2.6% of SP cells (30). By limited dilution method, a single cell clone, CNE-2-S26, was established (21). We detected the cells with 3.0% for positive staining by Hoechst 33342 dye (Fig. 1A, panel a). This result suggests that, even a single cancer cell, at in vitro culture condition, may develop into either SP or non-SP cells. Then, CNE-2-S26 cells were treated with UV light for 15 s, the time to effectively induce DNA damage, and cultured for 24 h. As a result, a remarkably increased percentage of SP cells (9.2%, Fig. 1A, panel b) were observed in these treated cells. Likewise, 8.7% of SP cells were also detected when CNE-2-S26 cells were treated with mitomycin C, a chemical reagent that caused DNA damage, at a final concentration of 2.5 μg/ml for 24 h (Fig. 1A, panel c). Collectively, the results demonstrate that DNA damage could significantly enhance the formation of SP cells in CNE-2. Importantly, both UV light and mitomycin C-induced SP cells were blocked by FTC at a final concentration of 5 μm, an specific inhibitor of ATP-binding cassette transporter member 2 of G protein family (ABCG2, Fig. 1A, panels d–f), indicating that the induction of SP cells was mediated by ABCG2.
FIGURE 1.
SLCC induction in human NPC cells with DNA damage treatment. A, SP cells were induced by UV light or mitomycin C in human NPC cells. a–f, NPC CNE-2 cells were single cell cloned, and a single cell clone CNE-2-S26 was selected and expanded for UV light or mitomycin C treatment and Hoechst 33342 staining. a, without treatment; b, treated with UV light for 15 s and cultured for 24 h; c, treated with 2.5 μg/ml mitomycin C for 24 h; d–f, the same as a–c, except that FTC at a final concentration of 5 μm was added for 5 min before Hoechst 33342 staining. The percentage of SP cells is indicated. B, CD133-positive cells were induced with UV light or mitomycin C in human neuroblastoma cells. a–c, human neuroblastoma SKN-SH cells were single cell cloned, and a single cell clone SKN-SH-C8 was selected for treatment and CD133-positive cell counting. a, without treatment; b, treated with UV radiation for 15 s and cultured for 24 h; c, treated with 2.5 μg/ml mitomycin C for 24 h. The percentage of CD133-positive cells was indicated in the figures. C, the properties of SLCCs was enhanced by UV treatment in both NPC cells and neuroblastoma cells. a and b, colony formation assay of CNE-2-S26 cells before/after UV treatment. a, colony formation results; b, statistical analysis. c to d: Colony formation assay of SKN-SH-C8 cells before/after UV treatment. c, colony formation results; d, statistical analysis. The p value was indicated in the figures. e, the protein level of Sox2 in both CNE-2-S26 cells and SKN-SH-C8 cells before/after UV treatment.
To further confirm this notion, we also used a human neuroblastoma cell line, SKN-SH, and from which a single cell lone, called SKN-SH-C8 negative for CD133, was generated based upon CD133, which is considered to be one of the specific markers for SLCCs in brain tumors (8). Using the same strategies to induce DNA damage, 5.0% and 2.5% of SKN-SH-C8 cells were positive for CD133 after UV light or mitomycin C treatment as described for the NPC cell line CNE-2-S26, respectively (Fig. 1B).
Furthermore, we performed other typical assays used for SLCCs evaluation, including colony formation assay and the expression of Oct4 and Sox2, to check the self-renewal capability of SLCCs induced by UV light. After UV light treatment, the colony formation efficiency of CNE-2-S26 cells was significantly increased from ∼25% to 32% (Fig. 1C, panels a and b). Likewise, the colony-formation ability of SKN-SH-C8 cells was similarly dramatically enhanced by UV light (Fig. 1C, panels c and d). In addition, both cell clones were observed with up-regulation of Sox2 protein expression after UV light treatment (Fig. 1C, panel e). However, we could not detect any expression of Oct4 in the cells with or without UV light treatment (data not shown).
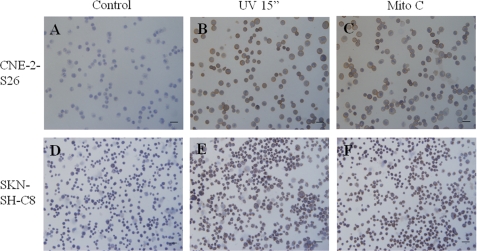
We also used immunocytochemistry assay to check the amount of SLCCs after DNA damage. As expected, the expression of ABCG2 in CNE-2-S26 cells was enhanced by DNA damage induced by UV light or mitomycin C treatment (Fig. 2, A–C). Likewise, the expression of CD133 of SKN-SH-C8 cells was similarly increased after UV light or mitomycin C treatment (Fig. 2, D–F).
FIGURE 2.
The expression of ABCG2 or CD133 was induced by DNA damage treatment. A–C, the expression of ABCG2 of CNE-2-S26 was enhanced after UV light or mitomycin C treatment. A, without treatment; B, treated with UV radiation for 15 s and cultured for 24 h; C, treated with 2.5 μg/ml mitomycin C for 24 h. D–F, the expression of CD133 of SKN-SH-C8 was enhanced after UV light or mitomycin C treatment. D, without treatment; E, treated with UV radiation for 15 s and cultured for 24 h; F, treated with 2.5 μg/ml mitomycin C for 24 h.
Genomic Instability, Induced by Overexpression of Mad2 or Knockdown of Aurora B or Cdh1, Led to Generation of SLCCs
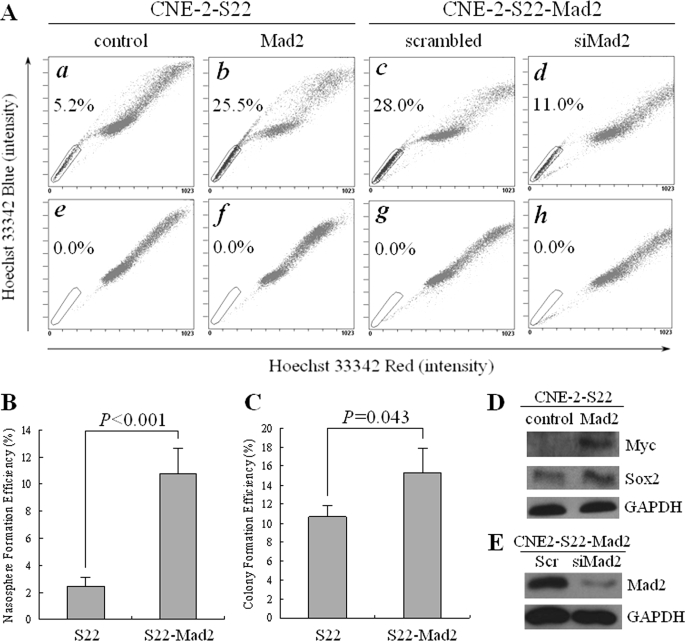
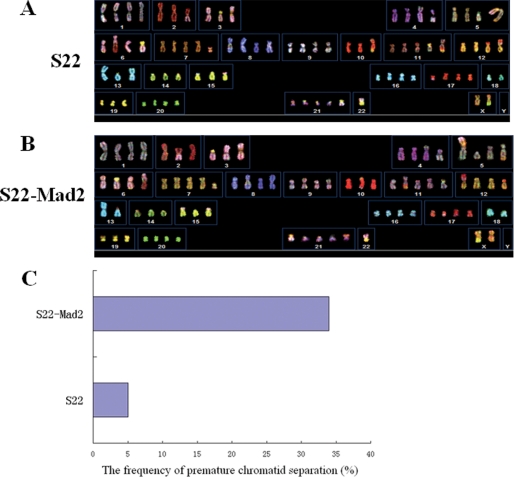
Based on the results above, and DNA damage might eventually cause genomic instability, we sought to check if inducement of genomic instability could produce SLCCs. Mad2 is a key regulator of cell cycle, and overexpression of Mad2 was reported to generate aneuploidy (31). To induce genomic instability, a stable transfection of Mad2, CNE-2-S22-Mad2, was generated using the single cell clone CNE-2-S22. This cell clone was also derived from the NPC CNE-2 cell line but had a relatively higher basal level of SP cells (Fig. 3A, panel a), as compared with CNE-2-S26 (Fig. 1A, panel a). Interestingly, increase of SP cells (up to 25.5%, Fig. 3A, panel b) was evident in the CNE-2-S22-Mad2 cells stably overexpressing 6×Myc-Mad2 (Fig. 3D) compared with the parental cells (5.2%, Fig. 3A, panel a), and those SP cells were completely blocked by FTC at a final concentration of 5 μm (Fig. 3A, panels e and f). To further validate the role of Mad2 in induction of SP cells, we did a loss-of-function assay to check its contribution to SP phenotype. We used siRNA to knock down Mad2 in the CNE-2-S22-Mad2 stable cell line and found that the percentage of SP cells decreased evidently from 28.0% to 11.0% (Fig. 3A, panels c and d), whereas the protein level of Mad2 was obviously decreased accordingly (Fig. 3E), suggesting that the induction of SP cells was specifically caused by overexpression of Mad2. The results of spheroid and colony formation, which were performed in suspension culture circumstance and in adherent culture circumstance, respectively, demonstrated that the self-renewal capability in vitro of S22-Mad2 was significantly stronger than that of parental S22 cells (Fig. 3, B and C). Moreover, the expression of Sox2 in CNE-2-S22-Mad2 cells was higher than that in parental CNE-2-S22 cells (Fig. 3D). To detect genomic instability of CNE-2-S22-Mad2 cells, we performed SKY (Fig. 4, A and B) and counted the cells with premature chromatid separation, which was a sign of chromosomal instability. As expected, CNE-2-S22-Mad2 cells appeared to be more unstable than parental CNE-2-S22 cells, evidenced by the variation in chromosome numbers and additional structural aberrations (data not shown). In addition, 34% of metaphases of CNE-2-S22-Mad2 had premature chromatid separation, whereas only 5% of CNE-2-S22 had similar phenotype (Fig. 4C).
FIGURE 3.
SP cells induction with stable transfection of Mad2 in human NPC cells. A, Hoechst 33342 staining was performed in human NPC CNE-2-S22-Mad2 cells. a, parental CNE-2-S22 cells; b, Mad2-transfected CNE-2-S22 cells; c, CNE-2-S22-Mad2 cells transfected with scrambled siRNA; d, CNE-2-S22-Mad2 cells transfected with siMad2. e–h, the same as a–d, except that FTC at a final concentration of 5 μm was added before Hoechst 33342 staining. The percentage of SP cells is indicated. B, spheroid (nasosphere) formation assay of CNE-2-S22 and CNE-2-S22-Mad2 in suspension culture circumstance. C, colony formation assay of CNE-2-S22 and CNE-2-S22-Mad2 in adherent culture circumstance. The p value was indicated in the figures. D, Western blot analysis of exogenous Mad2 tagged with Myc and endogenous Sox2 in CNE-2-S22 and CNE-2-S22-Mad2 stable cell lines. E, Western blot analysis of endogenous Mad2. Glyceraldehyde-3-phosphate dehydrogenase (GAPDH) was used as a loading control.
FIGURE 4.
Genomic instability induced by stable overexpression of Mad2 in human NPC cells. A and B, SKY of human NPC CNE-2-S22 cells before/after stable overexpression of Mad2. A, parental CNE-2-S22 cells; B, CNE-2-S22-Mad2 cells. C, the frequency of premature chromatid separation of CNE-2-S22 cells and CNE-2-S22-Mad2 cells.
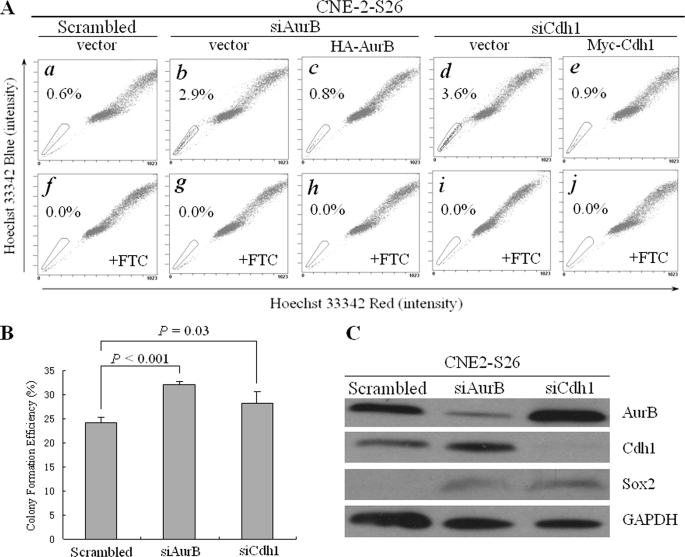
Another way to induce genomic instability is to knock down the key regulators for mitosis, such as Aurora kinases and Cdh1. We attempted to transiently knock down Aurora B or Cdh1 by siRNA in CNE-2-S26 cells with a relatively low percentage of SP cells. The siRNA efficiently down-regulated expression level of Aurora B and Cdh1 (Fig. 5C). Accordingly, an obvious increase of SP cells was detected from 0.6% to 2.9% for Aurora B and from 0.6% to 3.6% for Cdh1, respectively (Fig. 5A, panels a–d). The increase of SP cells was further evidenced by an enhanced efficiency of colony formation in CNE-2-S26 cells after knockdown of Aurora B or Cdh1, indicating an induction of SLCC formation (Fig. 5B). Rescue experiments were performed to reintroduce the expression of Aurora B or Cdh1 into Aurora B or Cdh1 knockdown cells. By cotransfection of their siRNA and rescue plasmids, we observed a decreased percentage of SP cells: from 2.9% to 0.8% for Aurora B and from 3.6% to 0.9% for Cdh1, respectively (Fig. 5A, panels c and e). This result suggested that the induction of SP cells was specifically caused by knockdown of Aurora B or Cdh1.
FIGURE 5.
Transient RNA interference of Aurora B or Cdh1 increased the percentage of SP cells in human NPC cells. A, Hoechst 33342 staining was performed in human NPC CNE-2-S26 cells after cotransfection of Aurora B/Cdh1 siRNA and rescue plasmids. a, scrambled siRNA and vector plasmids; b, Aurora B siRNA and vector plasmid; c, Aurora B siRNA and HA-Aurora B rescue plasmid; d, Cdh1 siRNA and vector plasmid; e, Cdh1 siRNA and Myc-Cdh1 rescue plasmid. f–j, the same as a–e, except that FTC at a final concentration of 5 μm was added before Hoechst 33342 staining. The percentage of SP cells is indicated. B, the colony formation efficiency after Aurora B/Cdh1 siRNA was transfected, compared with the scrambled siRNA. The p values are indicated. C, Western blot analysis of Aurora B, Cdh1, and Sox2 after Aurora B or Cdh1 was knocked down. Glyceraldehyde-3-phosphate dehydrogenase (GAPDH) was used as a loading control.
Recurrence Correlates with Enrichment of SLCCs in Vivo
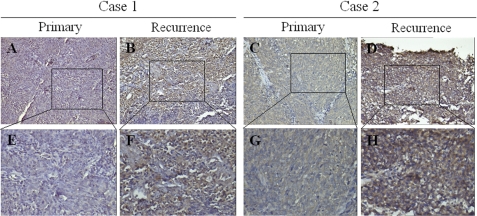
It is well documented that genomic instability is one of the characteristics that cancer cells possess in vivo (32). Therefore, it is plausible that non-SLCCs might become SLCCs if genomic instability occurs in vivo. If this is the case, we speculated that the amount of SLCCs may vary in human tumor tissues. Therefore, two pairs of NPC primary and recurrent tumor tissues were collected, and the percentage of SLCCs was checked by immunostaining ABCG2. As shown in Fig. 6, the expression of ABCG2 was significantly higher in recurrent tissues than that in the matched primary tissues, indicating that SLCCs may be enriched in the recurrent tissues.
FIGURE 6.
Spontaneous emergence of ABCG2-positive cells in recurrent NPC tissues. A, C, E, and G, representative immunohistochemistry staining of ABCG2 in primary tumors of two NPC patients. A, Case 1; C, Case 2; E and G, the magnification of A and C, respectively. B, D, F, and H, representative immunohistochemistry staining of ABCG2 in recurrent tumors of the same patients. B, Case 1; D, Case 2; F and H, the magnification of B and D, respectively.
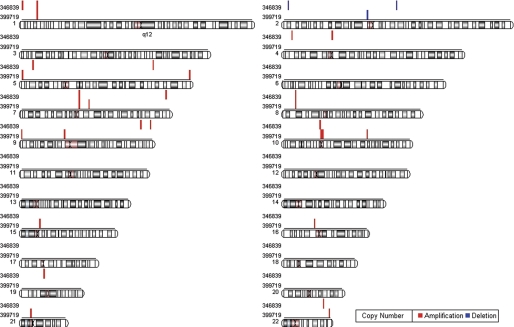
To compare the genomic instability in the matched primary NPC tumor tissues and recurrent tissues, we checked the genome-wide copy number variation of the two NPC cases, which were immunostained for ABCG2 expression (Fig. 6). The result in Fig. 7 showed that, compared with the primary tumor tissues, both amplification and deletion were detected in the recurrent tissues, indicating that genomic instability more frequently occurs in recurrent tissues than in primary cancer cells.
FIGURE 7.
The genome-wide CNV of two couples of primary and recurrent NPC tissues. Using the copy number of the primary tissues as controls, relative copy number of the matched recurrent tissues was calculated and is shown as red lines (amplification) or blue lines (deletion). The sample numbers of the two NPC cases are indicated.
DISCUSSION
In this report, we provide direct evidence that genomic instability is involved in the induction of SLCCs. By increasing genomic instability through inducing DNA damage, overexpressing of Mad2, or knockdown of aurora B or Cdh1, the cultured cancer cells produce more SLCCs, which is dependent on ABCG2. More interestingly, recurrence correlates with the enrichment of SLCCs in clinical NPC tissues.
Early studies on acute myelogenous leukemia have suggested that one probable origin of CSCs was the transformation of normal tissue stem cells because of genetic mutation (33), especially in the process of tumor formation. Recently, more and more studies have provided evidence supporting such a hypothesis in solid tumors, including cutaneous and intestinal cancer (34, 35), indicating that the transformation of tissue stem cells may be a key event in the early stage of carcinogenesis. Due to abnormal activation of oncogenes and/or dysfunction of tumor suppressor genes, normal tissue stem cells obtain the capability of unlimited proliferation, transforming themselves to CSCs and resulting in tumorigenesis.
Recently, the correlation between CSCs and genomic instability has been suggested (17, 18). Ionizing radiation and/or chemotherapy are still the main tools for cancer patient treatment, especially for later stage patients. A major mechanism for both treatments is extensive DNA damage even at clinical doses, although radiation is basically focused on the tumor site and some chemotherapy drugs are much milder in terms of causing DNA damage. Heterogeneity is a characteristic of cancer cells that is manifest as different chromosome numbers, various chromosome deletions or amplifications at genetic level, and correspondingly as different biological behaviors at phenotype level, such as growth advantage, self-renewal capacity, drug or radiation resistance. The molecular basis to support such phenomenon has been widely considered to be genomic instability, and an example is the high frequency of loss of function mutation of p53, the genome guardian, in various types of clinical tumor tissues. Theoretically, cancer cells possess a potential to develop into any kind of genotypes because of genomic instability. Under the selection pressure of human body, certain types of cancer cells with growth advantage are eventually expanded, and this might be one of the origins of cancer cells with stem cell properties (for those cells, we would prefer to call them stem-like cancer cells (SLCCs)). If this is the case, any DNA damage inducers, through enhancement of the existing genomic instability, may further promote the formation of SLCCs.
In fact, our results obtained from this study provided evidence that physical, UV lighting, and chemical DNA damage and mitomycin C treatment could induce a significant increase of SLCCs in two types of tumor cells, namely, NPC CNE-2 and neuroblastoma SKN-SH. Not surprisingly, our results also showed that DNA damage-induced SLCCs were abrogated by FTC, a specific inhibitor of ABCG2. One could argue that UV light or mitomycin C might simply up-regulate the expression of ABCG2 and result in a drug resistance phenotype. However, a more probable explanation is that a defined genotype for SLCCs consists of many necessary factors, and high level of ABCG2 expression is one of them. In other words, high ABCG2 expression is required for SLCC formation at least in some cancer types, but high ABCG2 expression alone may not be enough to define an SLCC phenotype. Therefore, we could consider ABCG2 high expression (SP cells by flow cytometry analysis) as a marker for SLCCs. Certainly, more specific markers like CD133 (10) will further facilitate cancer stem research.
A number of documents have showed that many oncogenes or tumor suppressors are overexpressed or down-regulated in tumor tissues (19, 36). Among those genes, many of them are actually involved in maintaining genomic stability. We tested a couple of such genes, and found that overexpression of Mad2 or knockdown of Aurora B or Cdh1 were able to induce SLCCs, which also depended on the ABCG2 expression level, because FTC could completely block the increase of SP cells (Figs. 3A and 5A). This result actually provided additional evidence that genomic instability was an important cause of SLCC formation.
To obtain in vivo evidence, we collected paired primary and recurrent NPC tumor tissues. By immunostaining, we found an obvious stronger staining of ABCG2 in recurrent NPC tissues (Fig. 6). Although we could not conclude that genotoxic therapeutics, radiation therapy, and chemotherapy, and spontaneous gene mutations in the tumor tissues under circumstantial pressure may also lead to ABCG2 high expression, a marker for SLCCs, our observation still showed that SLCCs could originate from genomic instability, either by treatment of DNA damage or spontaneous DNA mutation. Similarly, a recent study revealed that stresses like hypoxia in tumor microenvironment enriched SP cells in cancer cell lines (37).
One could argue that the observed increases in the SP percentages of NPC cells, either cultivated in vitro or within patients' samples after the indicated treatments, could be derived from a possible sparing effect of these treatments on SP cell survival and/or proliferation, or from a mechanism independent of DNA damage. Indeed, a sparing effect of treatment (chemotherapy or radiation therapy) on a tumor mass could eventually enrich SP cells. This mechanism could partially explain the observed increase of SP cells in recurrent NPC tissues as compared with the matched primary NPC tissues (Fig. 6). However, this mechanism could not explain our findings with the single NPC cell clone, CNE-2-S26. We detected 3.0% cells positive for SP in the expanded singe cell clone (Fig. 1A, panel a) and a remarkable increase to 9.2% and 8.7% for SP after UV or mitomycin C treatment, respectively (Fig. 1A, panels b and c). This result indicates that a single cancer cell (with genomic instability already present) could spontaneously develop into either SP or non-SP phenotypes without any treatment, and, importantly, DNA damage treatment could enhance such a transition.
To address the question of whether UV or mitomycin C treatment induced SP phenotype independent of DNA damage, we attempted to knock down the key regulators for cell mitosis, namely Aurora B and Cdh1, in the NPC cell line, CNE-2-S26, by siRNA strategy, and a significant increase of SP cells was observed (Fig. 5A). A similar result was also detected when Mad2 was overexpressed in the NPC cell line (Fig. 3A). To further confirm the genomic instability induced by Mad2 overexpression, we performed spectral karyotyping (Fig. 4) and counted the cells with premature chromatid separation, which is a sign of chromosomal instability. As expected, CNE-2-S22-Mad2 cells appeared to be more unstable than parental CNE-2-S22 cells, evidenced by the variation in chromosome numbers and additional structural aberrations. These findings strongly support a change in SP cell percentage closely related to genomic instability.
In summary, our findings, for the first time, provided direct evidence that genomic instability could be an important cause for SLCC formation and those SLCCs were derived from the “common” cancer cells. This could be a different mechanism from transformation of tissue stem cells into cancerous stem cells, which may be more suitably termed as CSCs and may play a more important role in cancer initiation. Our results also imply that future cancer therapy should not only target the common cancer cells, but also prevent SLCC formation by maintaining genome stability and/or restoring DNA repair machinery.
Acknowledgments
We give our thanks to Dr. Liang Zhang and CapitalBio Corp. for technical assistance.
The work was supported by the Chinese National 973 Program (Grants 2006CB910104 and 2010CB912201), the Chinese National 863 Program (Grant 2006AA02A404), and the Guangdong Province-National Natural Science Foundation of China Cooperation Program (Grant u0732005).
- CSC
- cancer stem cell
- SP
- side population
- SLCC
- stem-like cancer cell
- ABCG2
- ATP-binding cassette transporter member 2 of G protein family
- NPC
- nasopharyngeal carcinoma
- PBS
- phosphate-buffered saline
- FTC
- fumitremorgin C
- SKY
- spectral karyotyping
- siRNA
- small interference RNA
- Bis-Tris
- 2-[bis(2-hydroxyethyl)amino]-2-(hydroxymethyl)propane-1,3-diol
- MOPS
- 4-morpholinepropanesulfonic acid.
REFERENCES
- 1.Quintana E., Shackleton M., Sabel M. S., Fullen D. R., Johnson T. M., Morrison S. J. (2008) Nature 456, 593–598 [DOI] [PMC free article] [PubMed] [Google Scholar]
- 2.Reya T., Morrison S. J., Clarke M. F., Weissman I. L. (2001) Nature 414, 105–111 [DOI] [PubMed] [Google Scholar]
- 3.Bapat S. A. (2007) Semin. Cancer Biol. 17, 204–213 [DOI] [PubMed] [Google Scholar]
- 4.Houghton J., Morozov A., Smirnova I., Wang T. C. (2007) Semin. Cancer Biol. 17, 191–203 [DOI] [PubMed] [Google Scholar]
- 5.Huntly B. J., Gilliland D. G. (2005) Nat. Rev. Cancer 5, 311–321 [DOI] [PubMed] [Google Scholar]
- 6.Wang J. C., Dick J. E. (2005) Trends Cell Biol. 15, 494–501 [DOI] [PubMed] [Google Scholar]
- 7.Al-Hajj M., Wicha M. S., Benito-Hernandez A., Morrison S. J., Clarke M. F. (2003) Proc. Natl. Acad. Sci. U.S.A. 100, 3983–3988 [DOI] [PMC free article] [PubMed] [Google Scholar]
- 8.Singh S. K., Clarke I. D., Terasaki M., Bonn V. E., Hawkins C., Squire J., Dirks P. B. (2003) Cancer Res. 63, 5821–5828 [PubMed] [Google Scholar]
- 9.Collins A. T., Berry P. A., Hyde C., Stower M. J., Maitland N. J. (2005) Cancer Res. 65, 10946–10951 [DOI] [PubMed] [Google Scholar]
- 10.O'Brien C. A., Pollett A., Gallinger S., Dick J. E. (2007) Nature 445, 106–110 [DOI] [PubMed] [Google Scholar]
- 11.Ricci-Vitiani L., Lombardi D. G., Pilozzi E., Biffoni M., Todaro M., Peschle C., De Maria R. (2007) Nature 445, 111–115 [DOI] [PubMed] [Google Scholar]
- 12.Park I. H., Zhao R., West J. A., Yabuuchi A., Huo H., Ince T. A., Lerou P. H., Lensch M. W., Daley G. Q. (2008) Nature 451, 141–146 [DOI] [PubMed] [Google Scholar]
- 13.Takahashi K., Tanabe K., Ohnuki M., Narita M., Ichisaka T., Tomoda K., Yamanaka S. (2007) Cell 131, 861–872 [DOI] [PubMed] [Google Scholar]
- 14.Yu J., Vodyanik M. A., Smuga-Otto K., Antosiewicz-Bourget J., Frane J. L., Tian S., Nie J., Jonsdottir G. A., Ruotti V., Stewart R., Slukvin, Thomson J. A. (2007) Science 318, 1917–1920 [DOI] [PubMed] [Google Scholar]
- 15.Mani S. A., Guo W., Liao M. J., Eaton E. N., Ayyanan A., Zhou A. Y., Brooks M., Reinhard F., Zhang C. C., Shipitsin M., Campbell L. L., Polyak K., Brisken C., Yang J., Weinberg R. A. (2008) Cell 133, 704–715 [DOI] [PMC free article] [PubMed] [Google Scholar]
- 16.Morel A. P., Lièvre M., Thomas C., Hinkal G., Ansieau S., Puisieux A. (2008) PLoS ONE 3, e2888. [DOI] [PMC free article] [PubMed] [Google Scholar]
- 17.Lagasse E. (2008) Gene Ther. 15, 136–142 [DOI] [PubMed] [Google Scholar]
- 18.Li L., Borodyansky L., Yang Y. (2009) Cell Cycle 8, 1000–1002 [DOI] [PubMed] [Google Scholar]
- 19.Vogelstein B., Kinzler K. W. (2004) Nat. Med 10, 789–799 [DOI] [PubMed] [Google Scholar]
- 20.Sizhong Z., Xiukung G., Yi Z. (1983) Int. J. Cancer 31, 587–590 [DOI] [PubMed] [Google Scholar]
- 21.Qian C. N., Berghuis B., Tsarfaty G., Bruch M., Kort E. J., Ditlev J., Tsarfaty I., Hudson E., Jackson D. G., Petillo D., Chen J., Resau J. H., Teh B. T. (2006) Cancer Res. 66, 10365–10376 [DOI] [PubMed] [Google Scholar]
- 22.Iwai H., Kim M., Yoshikawa Y., Ashida H., Ogawa M., Fujita Y., Muller D., Kirikae T., Jackson P. K., Kotani S., Sasakawa C. (2007) Cell 130, 611–623 [DOI] [PubMed] [Google Scholar]
- 23.Sun L., Gao J., Dong X., Liu M., Li D., Shi X., Dong J. T., Lu X., Liu C., Zhou J. (2008) Proc. Natl. Acad. Sci. U.S.A. 105, 7153–7158 [DOI] [PMC free article] [PubMed] [Google Scholar]
- 24.Deng W., Tsao S. W., Lucas J. N., Leung C. S., Cheung A. L. (2003) Cytometry A 51, 46–51 [DOI] [PubMed] [Google Scholar]
- 25.Lampson M. A., Kapoor T. M. (2005) Nat. Cell Biol. 7, 93–98 [DOI] [PubMed] [Google Scholar]
- 26.Kondo T., Setoguchi T., Taga T. (2004) Proc. Natl. Acad. Sci. U.S.A. 101, 781–786 [DOI] [PMC free article] [PubMed] [Google Scholar]
- 27.Haraguchi N., Utsunomiya T., Inoue H., Tanaka F., Mimori K., Barnard G. F., Mori M. (2006) Stem Cells 24, 506–513 [DOI] [PubMed] [Google Scholar]
- 28.Goodell M. A., Rosenzweig M., Kim H., Marks D. F., DeMaria M., Paradis G., Grupp S. A., Sieff C. A., Mulligan R. C., Johnson R. P. (1997) Nat. Med. 3, 1337–1345 [DOI] [PubMed] [Google Scholar]
- 29.Hirschmann-Jax C., Foster A. E., Wulf G. G., Nuchtern J. G., Jax T. W., Gobel U., Goodell M. A., Brenner M. K. (2004) Proc. Natl. Acad. Sci. U.S.A. 101, 14228–14233 [DOI] [PMC free article] [PubMed] [Google Scholar]
- 30.Wang J., Guo L. P., Chen L. Z., Zeng Y. X., Lu S. H. (2007) Cancer Res. 67, 3716–3724 [DOI] [PubMed] [Google Scholar]
- 31.Sotillo R., Hernando E., Díaz-Rodríguez E., Teruya-Feldstein J., Cordón-Cardo C., Lowe S. W., Benezra R. (2007) Cancer Cell 11, 9–23 [DOI] [PMC free article] [PubMed] [Google Scholar]
- 32.Lengauer C., Kinzler K. W., Vogelstein B. (1998) Nature 396, 643–649 [DOI] [PubMed] [Google Scholar]
- 33.Bonnet D., Dick J. E. (1997) Nat. Med. 3, 730–737 [DOI] [PubMed] [Google Scholar]
- 34.Barker N., Ridgway R. A., van Es J. H., van de Wetering M., Begthel H., van den Born M., Danenberg E., Clarke A. R., Sansom O. J., Clevers H. (2009) Nature 457, 608–611 [DOI] [PubMed] [Google Scholar]
- 35.Malanchi I., Peinado H., Kassen D., Hussenet T., Metzger D., Chambon P., Huber M., Hohl D., Cano A., Birchmeier W., Huelsken J. (2008) Nature 452, 650–653 [DOI] [PubMed] [Google Scholar]
- 36.Hanahan D., Weinberg R. A. (2000) Cell 100, 57–70 [DOI] [PubMed] [Google Scholar]
- 37.Tavaluc R. T., Hart L. S., Dicker D. T., El-Deiry W. S. (2007) Cell Cycle 6, 2554–2562 [DOI] [PubMed] [Google Scholar]


