Abstract
Tight junctions (TJs) and adherens junctions (AJs) are major junctional apparatuses in epithelial cells. Claudins and junctional adhesion molecules (JAMs) are major cell adhesion molecules (CAMs) at TJs, whereas cadherins and nectins are major CAMs at AJs. Claudins and JAMs are associated with ZO proteins, whereas cadherins are associated with β- and α-catenins, and nectins are associated with afadin. We previously showed that nectins first form cell-cell adhesions where the cadherin-catenin complex is recruited to form AJs, followed by the recruitment of the JAM-ZO and claudin-ZO complexes to the apical side of AJs to form TJs. It is not fully understood how TJ components are recruited to the apical side of AJs. We studied the roles of afadin and ZO-1 in the formation of TJs in Madin-Darby canine kidney (MDCK) cells. Before the formation of TJs, ZO-1 interacted with afadin through the two proline-rich regions of afadin and the SH3 domain of ZO-1. During and after the formation of TJs, ZO-1 dissociated from afadin and associated with JAM-A. Knockdown of afadin impaired the formation of both AJs and TJs in MDCK cells, whereas knockdown of ZO-1 impaired the formation of TJs, but not AJs. Re-expression of full-length afadin restored the formation of both AJs and TJs in afadin-knockdown MDCK cells, whereas re-expression of afadin-ΔPR1–2, which is incapable of binding to ZO-1, restored the formation of AJs, but not TJs. These results indicate that the transient interaction of afadin with ZO-1 is necessary for the formation of TJs in MDCK cells.
Keywords: Cell/Adhesion, Cell/Cell-Cell Interaction, Membrane/Proteins, Protein/Assembly, Protein/Domains, Protein/Protein-Protein Interactions
Introduction
In epithelial cells, cell-cell adhesion is mediated through a junctional complex composed of tight junctions (TJs)3 and adherens junctions (AJs) (1). These junctional structures are typically aligned from the apical to the basal sides. TJs are likely to serve as barriers that prevent solutes and water from passing through the paracellular pathway and as fences between the apical and basolateral plasma membranes in epithelial cells. However, the fence function of TJs is recently controversial, because the apical marker proteins and the basolateral ones are normally distributed on the plasma membrane even in the epithelial cells in which TJs are completely disrupted (2). On the other hand, AJs are composed of closely apposed plasma membrane domains reinforced by a dense cytoplasmic plaque with actin filament (F-actin) bundles underneath. The formation and disruption of these junctional complexes are dynamically regulated by many extracellular and intracellular signals, and AJs play key roles in the formation and maintenance of TJs (3). However, the mechanisms responsible for the dynamic organization of these junctional complexes are not fully understood.
At TJs, claudins and JAMs are important cell adhesion molecules (CAMs) that exert cell adhesion activity in a Ca2+-independent manner (4, 5). These CAMs are associated with the actin cytoskeleton through peripheral membrane proteins, such as ZO proteins including ZO-1, -2, and -3 (6, 7). At AJs, E-cadherin, a member of the cadherin superfamily consisting of more than 100 members, is a key Ca2+-dependent CAM (8, 9). E-Cadherin is associated with the actin cytoskeleton through peripheral membrane proteins, including β- and α-catenins, and this association strengthens the cell-cell adhesion of AJs (10). p120ctn also binds to the juxtamembrane region of E-cadherin and stabilizes it on the cell surface plasma membrane by inhibiting the endocytosis of E-cadherin (11). Among other CAMs, nectins also localize at AJs (12–14). Nectins constitute a family with four members, designated nectin-1, -2, -3, and -4. They have three immunoglobulin-like loops in their extracellular regions and homophilically or heterophilically trans-interact with each other in a Ca2+-independent manner. A series of our studies have revealed that nectins first form cell-cell adhesion where cadherins are recruited to form AJs, followed by the recruitment of claudins and JAMs to the apical side of AJs to form TJs (12–14). The nectin-based cell-cell adhesion, but not the E-cadherin-based cell-cell adhesion, is essential for the formation of TJs (15).
All nectins are anchored to the actin cytoskeleton through the F-actin-binding protein afadin. Afadin has multiple domains: two Ras-binding (RA) domains, a forkhead-associated (FHA) domain, a dilute (DIL) domain, a PDZ domain, three proline-rich (PR) domains, and an F-actin-binding domain are found in that order from the N terminus (14). The PDZ domain binds to the C-terminal four amino acids of nectins, and the F-actin-binding domain binds to F-actin (16, 17). Afadin interacts with α-catenin, and both afadin and α-catenin are necessary for the recruitment of cadherins to the nectin-based cell-cell adhesion sites to form AJs (18). Afadin and canoe, a Drosophila ortholog of afadin, also bind to ZO-1 (19, 20). ZO-1 is a membrane-associated guanylate kinase (MAGUK) protein composed of the three PDZ domains, an SH3 domain, a GUK domain, and an F-actin-binding domain in that order from the N terminus (21). The first PDZ domain of ZO-1 binds to JAMs and claudins, and this binding is necessary for the formation of TJs. However, the molecular mechanisms underlying the formation of TJs, especially the roles of afadin and ZO-1 in the formation of TJs, are not fully understood. Therefore, in the present study, we examined how afadin and ZO-1 are involved in the formation of TJs in cultured MDCK cells.
EXPERIMENTAL PROCEDURES
Cell Culture and Transfection
MDCK cells were supplied by Dr. W. Birchmeier (Max-Delbruck-Center for Molecular Medicine, Berlin, Germany). These cells were maintained in Dulbecco's modified Eagle's medium (DMEM) supplemented with 10% fetal bovine serum. For DNA transfection, the Lipofectamine 2000 reagent (Invitrogen) and an Amaxa Nucleofector kit (Amaxa) were used.
Antibodies and Expression Vectors
A mouse anti-afadin monoclonal antibody (mAb) and a rabbit anti-afadin polyclonal Ab (pAb) were prepared as described (16, 22). A rat anti-E-cadherin mAb (ECCD2) was supplied by Dr. M. Takeichi (Center for Developmental Biology, RIKEN, Kobe, Japan). All of the Abs listed below were purchased from commercial sources: a mouse anti-FLAG M2 mAb (Sigma-Aldrich), anti-HA mAb (Babco), a rabbit anti-ZO-1 pAb (Zymed Laboratories Inc.), a rabbit anti-JAM-A pAb (Zymed Laboratories Inc.), a mouse anti-ZO-1 mAb (Sanko Junyaku), a rat anti-occludin mAb (Sanko Junyaku), and a mouse anti-actin mAb (Chemicon). Horseradish peroxidase-conjugated and fluorophore-conjugated secondary Abs were purchased from Amersham Biosciences and Chemicon, respectively. The full-length cDNA for rat afadin (amino acids 1–1829) and cDNAs for the fragments N-PDZ (amino acids 1–1100), PDZ-C (amino acids 1016–1829), PDZ (amino acids 1015–1100), CN (amino acids 1101–1531), CC (amino acids 1532–1829), and PR1-2 (amino acids 1219–1399) were subcloned into pCMV-FLAG, which was provided by Dr. K. Matsumoto (Nagoya University, Nagoya, Japan). cDNAs encoding full-length afadin and the ΔPR1-2 fragment (amino acids 1–1218 and 1400–1829) were subcloned into pCMV-HA, which was provided by Dr. K. Matsumoto, and pEGFP-C1 (Clontech). The full-length cDNA for mouse ZO-1 was supplied by S. Tsukita (Kyoto University, Kyoto, Japan). cDNAs encoding full-length ZO-1 (amino acids 1–1745) and the fragments N (amino acids 1–862), C (amino acids 863–1745), NN (amino acids 1–455), SH3-GUK (amino acids 518–794), GUK (amino acids 619–794), and SH3 (amino acids 518–583) were subcloned into pCMV-HA. The full-length ZO-1 cDNA was also subcloned into pCMV-FLAG.
Knockdown Experiments
For knocking down expression of ZO-1 and afadin by a short hairpin RNA (shRNA) method, pBS-H1 (a kind gift from Dr. H. Shibuya at Tokyo Medical and Dental University, Tokyo, Japan) containing the H1 promoter was used for expression of the shRNAs. To generate a vector for knockdown of ZO-1 (pBS-H1-ZO-1) or afadin (pBS-H1-afadin), a specific insert for ZO-1 or afadin was subcloned into pBS-H1 as described (23). The inserts for canine ZO-1 and afadin were 5′-GATATTGTTCGGTCTAATC-3′ and 5′- GACAATCCTGCTGTCTACC-3′, respectively (24, 25). For the control experiments, the luciferase (pBS-H1-luciferase) sequence was subcloned into pBS-H1. The cells were co-transfected with pBS-H1 and pEGFP-C1 (GFP). The GFP-positive cells were monitored as a marker for co-transfection. For rescue experiments, expression vectors for RNAi-resistant GFP-afadin (pEGFP-afadin*) and GFP-afadinΔPR1–2 (pEGFP-afadinΔPR1–2*) were created by alteration of several nucleotides in the RNAi target sequence by mutagenesis.
Ca2+ Switch Experiments
Ca2+ switch experiments using MDCK cells were carried out as described (26). Briefly, the cells (1 × 10⁵) were plated on 18-mm glass coverslips in 12-well culture dishes. At 48–72 h after transfection, the cells were washed with phosphate-buffered saline (PBS) and cultured in the presence of 2 mm Ca2+ in DMEM without serum for 1 h. Next, the cells were pre-cultured at 2 μm Ca2+ in DMEM containing 5 mm EGTA for 3 h and then re-cultured in the presence of 2 mm Ca2+ for the indicated periods of time. For the 12-O-tetradecanoyl-phorbol-13-acetate (TPA) treatment, 100 nm TPA was added to the medium after the cells had been cultured at 2 μm Ca2+ (in DMEM containing 5 mm EGTA) for 3 h.
Immunoprecipitation Experiments
Co-immunoprecipitation experiments using HEK293 cells were performed as follows. HEK293 cells were transfected with various combinations of expression plasmids. The cells were washed with PBS and then suspended in 1 ml of Buffer A (20 mm Tris-HCl, pH 7.5, 150 mm NaCl, 1% Triton X-100, 1 mm EDTA, 1 mm Na3VO4, 10 mm 4-amidinophenylmethylsulfonyl fluoride hydrochloride, 10 μg/ml aprotinin, 10 μg/ml leupeptin, and phosphatase inhibitor cocktail (Sigma)). The cell extract was obtained by centrifugation at 100,000 × g for 15 min. The cell extract was then incubated with 20 μg of anti-FLAG M2 mAb- or anti-HA mAb-coated protein G-Sepharose 4 Fast Flow beads (Amersham Biosciences) at 4 °C for 4 h. After the beads were extensively washed with Buffer A, the bound proteins were eluted by boiling the beads in SDS sample buffer (60 mm Tris-HCl, pH 6.7, 3% SDS, 2% 2-mercaptoethanol, and 5% glycerol) for 10 min. The samples were then subjected to SDS-PAGE, followed by Western blotting with the anti-FLAG and anti-HA mAbs. Co-immunoprecipitation experiments using MDCK cells were performed as follows. Subconfluent MDCK cells were subjected to the Ca2+ switch experiment. After the Ca2+ switch experiment, the cells were washed with PBS and then suspended in 1 ml of Buffer A, followed by centrifugation at 100,000 × g for 15 min. The cell extract was incubated with anti-afadin mAb-coated protein G-Sepharose 4 Fast Flow beads at 4 °C for 18 h. After the beads were extensively washed with Buffer A, the bound proteins were eluted by boiling the beads in SDS sample buffer for 10 min. The samples were then subjected to SDS-PAGE, followed by Western blotting with the anti-afadin and ZO-1 Abs.
Immunofluorescence Microscopy
Cells were fixed in a mixture of 50% acetone and 50% methanol at −20 °C for 1 min or in PBS containing 1% formaldehyde for 15 min, followed by PBS containing 0.2% Triton X-100 for 15 min at room temperature. After being blocked in Tris-buffered saline (TBS) containing 1% bovine serum albumin and 1 mm Ca2+ for 1 h, the cells were incubated in the same buffer containing various combinations of Abs for 1–2 h. The samples were washed three times with TBS containing 1 mm Ca2+ for 5 min and incubated for 0.5–1 h in TBS containing 1% bovine serum albumin and 1 mm Ca2+ with the secondary pAbs. The samples were then washed three times with TBS containing 1 mm Ca2+ for 5 min and mounted in GEL/MOUNT (Biomedia) or FluorSave Reagent (Calbiochem). The samples were analyzed using a Radiance 2100 (Bio-Rad Laboratories) or LSM510 META (Carl Zeiss) confocal microscope. All of the immunofluorescence images shown in the present study are representative of three independent experiments. The immunostaining integrity of cell-cell junction components at the intercellular adhesion sites was digitally quantified as described previously (24). Briefly, images in which cells were immunostained with Abs against ZO-1, JAM-A, or E-cadherin were inverted in the pixel values. Randomly selected GFP-positive or -negative intercellular adhesion sites in each image were traced using ImageJ software (National Institutes of Health), which generates a value between 0 and 255 for each pixel along the traced line. The mean pixel value of each trace at GFP-positive or -negative cell-cell boundaries was collected in each image. The relative immunofluorescence intensity was defined as the ratio of the average of the mean pixel values at GFP-positive cell-cell boundaries to that at GFP-negative ones. Values from multiple images and experiments were pooled to obtain means ± S.E. as shown in the graph and were statistically evaluated using an unpaired, two-tailed Student's t test.
Other Procedures
Protein concentrations were determined with bovine serum albumin as a reference protein (27). The paracellular diffusion was measured using MDCK cells grown on Transwell filters as described previously (28).
RESULTS
Interaction of Afadin with ZO-1 during the Formation of Cell-Cell Junctions
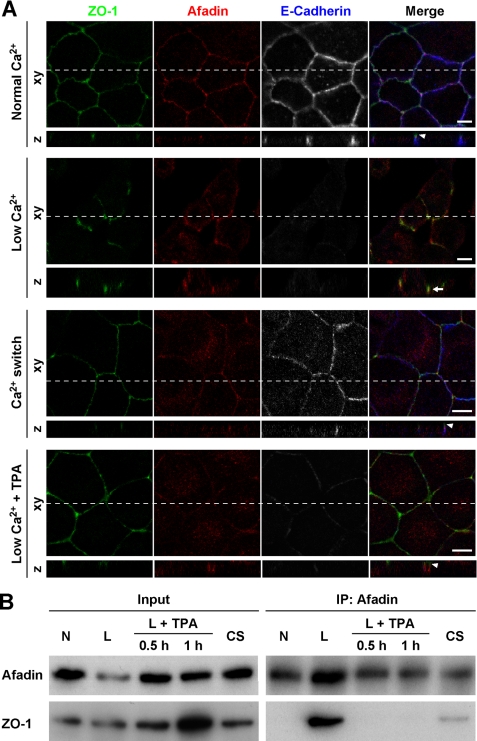
Because it was previously shown that afadin directly interacts with ZO-1 (20), we assessed the co-localization and interaction of ZO-1 and afadin during the formation of cell-cell junctions using the Ca2+ switch assay. When MDCK cells were cultured in the presence of 2 mm Ca2+ (normal Ca2+), cells formed AJs and TJs at the cell-cell adhesion sites. The immunofluorescence signal for ZO-1, a TJ component, was concentrated at the apical side of the signals for the AJ components afadin and E-cadherin (Fig. 1A, Normal Ca2+). Thus, the localization of ZO-1 was separate from those of afadin and E-cadherin under this condition. Next, when the concentration of Ca2+ in the culture medium was reduced to 2 μm (low Ca2+), TJs were disrupted and the signal for E-cadherin was no longer detected at the residual cell-cell contact sites, whereas the signal for afadin still remained there, consistent with the findings of previous studies (29, 30) (Fig. 1A, Low Ca2+ and data not shown). The signal for ZO-1 co-localized with that for afadin at these residual cell-cell contact sites. Then, when MDCK cells were re-cultured in the presence of 2 mm Ca2+ (Ca2+ switch), AJs, and TJs were re-formed, and the signal for ZO-1 accumulated at the apical side of the signals for afadin and E-cadherin, resulting in a separated localization of ZO-1 from AJ components (Fig. 1A, Ca2+ switch).
FIGURE 1.
Association of afadin with ZO-1 in cells cultured at a low Ca2+ concentration. A, immunofluorescence staining for ZO-1, afadin, and E-cadherin in MDCK cells. MDCK cells cultured in the presence of 2 mm Ca2+ (Normal Ca2+) were precultured at 2 μm Ca2+ for 3 h (Low Ca2+). The cells were then re-cultured in the presence of 2 mm Ca2+ for 4 h (Ca2+ switch) or cultured at 2 μm Ca2+ containing 100 nm TPA for 1 h (Low Ca2++TPA). Cells under each condition were triple stained with the anti-ZO-1, anti-afadin, and anti-E-cadherin Abs. Arrowheads indicate the localization of ZO-1, which was separate from those of afadin and E-cadherin, and an arrow indicates the co-localization of ZO-1 and afadin. Scale bars, 10 μm. B, binding of afadin and ZO-1 in MDCK cells. Cell extracts of MDCK cells cultured under each condition were immunoprecipitated with the anti-afadin mAb and subjected to Western blotting using the anti-afadin and anti-ZO-1 Abs. IP, immunoprecipitation; N, Normal Ca2+; L, Low Ca2+; L+TPA, Low Ca2++TPA; CS, Ca2+ switch.
Our previous studies showed that the pharmacological activation of protein kinase C by TPA in MDCK cells cultured at a low Ca2+ concentration (Low Ca2++TPA) induced the formation of a TJ-like structure without the formation of E-cadherin-based AJs (28, 31, 32). Under this condition, the signal for ZO-1 also localized at the apical side of the signal for afadin at cell-cell adhesions (Fig. 1A, Low Ca2++TPA). The signal for E-cadherin was hardly detected, in agreement with previous studies (28, 31, 32).
We further confirmed the interaction of endogenous afadin with ZO-1 in MDCK cells in a co-immunoprecipitation assay. Although ZO-1 was not co-immunoprecipitated with afadin from extracts of MDCK cells cultured at a normal Ca2+ concentration, it was clearly co-immunoprecipitated with afadin from extracts of cells cultured at a low Ca2+ concentration (Fig. 1B). However, this ability to co-immunoprecipitate ZO-1 was almost completely lost when the Ca2+ switch or low Ca2++TPA procedure was performed. Collectively, these results indicate that the interaction of afadin with ZO-1 is transient during the formation of cell-cell junctions.
Necessity of ZO-1 for the Formation of TJs
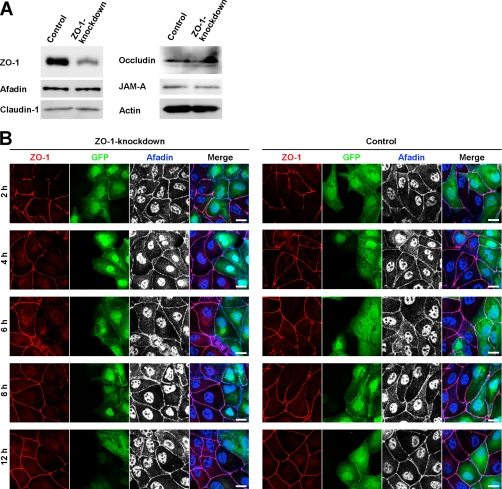
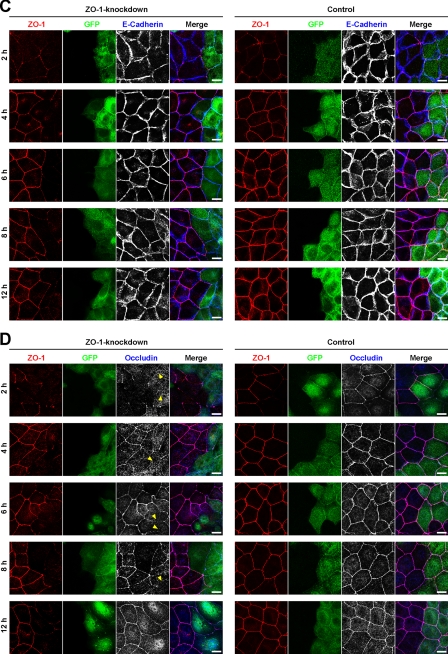
It was reported that ZO-1 was involved in the formation of TJs in Eph4 cells in the Ca2+ switch assay (33). We confirmed this earlier observation in MDCK cells. MDCK cells were transfected with pBS-H1-ZO-1 for knockdown of ZO-1 or with pBS-H1-luciferase as a control. The cells were co-transfected with pEGFP-C1 vector to visualize the pBS-H1-transfected cells in immunofluorescence microscopy. Western blotting showed that the amount of ZO-1 was markedly reduced in ZO-1-knockdown MDCK cells compared with control MDCK cells (Fig. 2A). The expression levels of afadin, claudin-1, occludin, and JAM-A were not affected by knockdown of ZO-1. In ZO-1-knockdown MDCK cells, the immunofluorescence signal for ZO-1 was barely detectable at the interface between the neighboring GFP-positive cells throughout the experimental period after the Ca2+ switch (Fig. 2, B–D). By contrast, the accumulation of the signals for AJ markers afadin and E-cadherin was observed there even at 2 h after the Ca2+ switch and lasted at least for 12 h (Fig. 2, B and C). Although the signal for afadin was visible at perinuclear and nuclear regions in addition to the cell-cell adhesion sites in Fig. 2B, the perinuclear and nuclear staining is most likely to be nonspecific as described (Refs. 16, 34 and data not shown). As for a TJ marker occludin, this signal was barely detectable for 8 h after the Ca2+ switch but was observed at 12 h. In control MDCK cells, the signals for afadin and E-cadherin were accumulated at the cell-cell adhesion sites throughout the experimental period, and the signal for ZO-1 was weak or patchy at 2 h and gradually became clear at 4 h and later. These results are consistent with earlier observations (24, 33) and indicate that ZO-1 controls the velocity for the formation of TJs, but not AJs.
FIGURE 2.
Requirement of ZO-1 for the formation of TJs, but not AJs. A, expression levels of AJ and TJ markers in ZO-1-knockdown MDCK cells. Cell extracts of control and ZO-1-knockdown MDCK cells were separated by SDS-PAGE and subjected to Western blotting using the indicated Abs. Actin was immunoblotted as a loading control. B–D, delay in the assembly of the immunofluorescence signal for occludin, but not afadin or E-cadherin, at cell-cell adhesion sites in ZO-1-knockdown MDCK cells. At the indicated time points after the Ca2+ switch, control and ZO-1-knockdown MDCK cells were fixed and stained with the indicated Abs. Arrowheads indicate the absence of the signal for occludin. Scale bars, 10 μm.
ZO-1-binding Region of Afadin
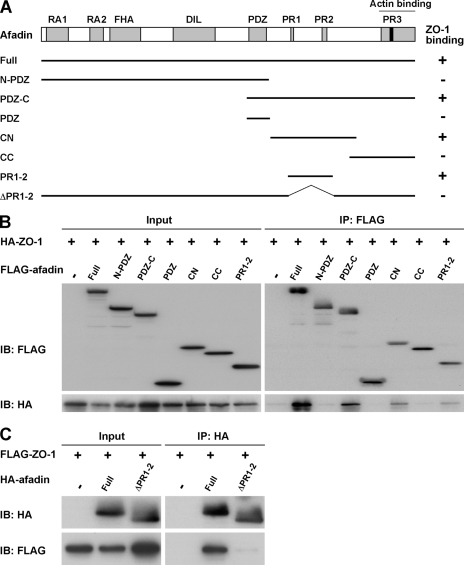
We then determined the ZO-1-binding region of afadin. Various afadin fragments were constructed as shown in Fig. 3A. When each fragment was co-expressed with HA-tagged full-length ZO-1 in HEK293 cells and immunoprecipitated with the anti-FLAG mAb, HA-ZO-1 was co-immunoprecipitated with FLAG-afadin-Full, -PDZ-C, -CN, and -PR1–2. However, the fragments FLAG-afadin-N-PDZ, -PDZ, and -CC did not interact with HA- ZO-1 (Fig. 3B). In addition, when HA-afadin-ΔPR1–2, which was missing the PR1–2 region of afadin, was co-expressed with FLAG-ZO-1 in HEK293 cells and immunoprecipitated with the anti-HA mAb, FLAG-ZO-1 was not co-immunoprecipitated (Fig. 3C). These results indicate that the PR1–2 region of afadin is necessary for its binding to ZO-1.
FIGURE 3.
The ZO-1-binding region of afadin. A, schematic diagram of afadin fragments. Afadin fragments were tagged with a FLAG or HA epitope at the N terminus. +, positive for the interaction with ZO-1; −, negative for the interaction with ZO-1. B and C, co-immunoprecipitation of ZO-1 with the PR1–2 region of afadin. Cell extracts of HEK293 cells transfected with various combinations of the indicated vectors were immunoprecipitated with the anti-FLAG or anti-HA mAb. Immunoprecipitates and cell extracts were subjected to Western blotting using the anti-FLAG and anti-HA mAbs.
Afadin-binding Region of ZO-1
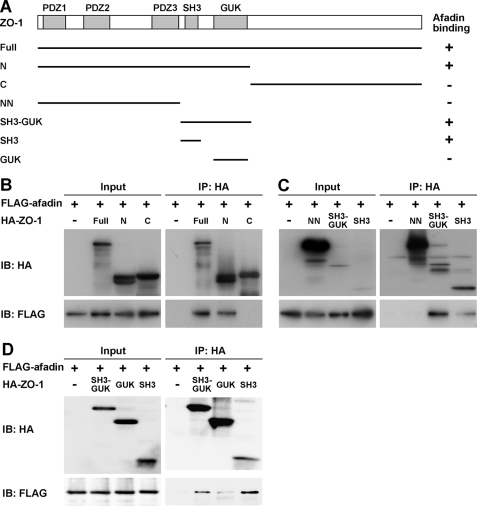
We next determined the afadin-binding region of ZO-1. Various HA-tagged ZO-1 fragments were constructed as shown in Fig. 4A. When each HA-tagged ZO-1 fragment was co-expressed with FLAG-afadin in HEK293 cells and immunoprecipitated with the anti-HA mAb, FLAG-afadin was co-immunoprecipitated with HA-ZO-1-Full, -N, -SH3-GUK, and -SH3, but not with HA-ZO-1-C, or -NN (Fig. 4, B and C), and the co-immunoprecipitation of FLAG-afadin with HA-ZO-1-GUK was faint (Fig. 4D). These results indicate that the SH3 domain of ZO-1 is essential for binding to afadin. Taken together, the findings reveal that the PR1–2 region of afadin and the SH3 domain of ZO-1 are important for the interaction of these proteins.
FIGURE 4.
The afadin-binding region of ZO-1. A, schematic diagram of ZO-1 fragments. All ZO-1 fragments were tagged with an HA epitope at the N terminus. +, positive for the interaction with afadin; −, negative for the interaction with afadin. B–D, co-immunoprecipitation of afadin with the SH3 domain of ZO-1. The immunoprecipitation experiment using HEK293 cells transfected with various combinations of the indicated vectors was performed as described in the legend to Fig. 3.
Necessity of the Interaction of Afadin with ZO-1 for the Formation of TJs
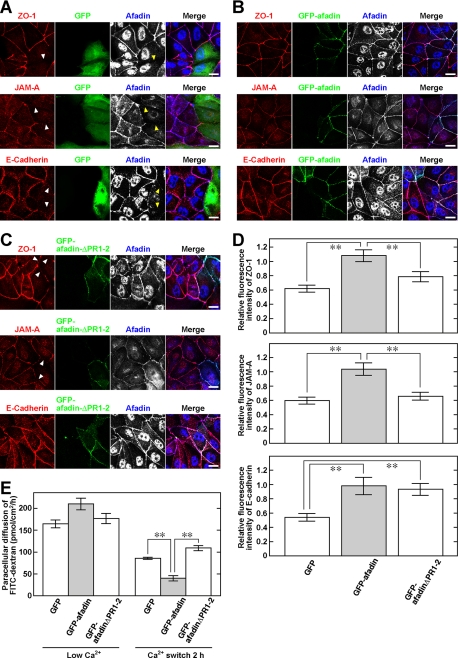
We then examined whether the interaction of afadin with ZO-1 is necessary for the formation of TJs. For this purpose, MDCK cells were co-transfected with pBS-H1-afadin for the knockdown of afadin and pEGFP-afadin* (GFP-afadin) for the recovery of afadin, with pBS-H1-afadin and pEGFP-afadin-ΔPR1–2* (GFP-afadin-ΔPR1–2), which is incapable of binding to ZO-1, or with pBS-H1-afadin and pEGFP (GFP) as a control. The Ca2+ switch procedure was then performed using cells co-transfected with these combinations of expression vectors. Because GFP-negative cells under each condition were not transfected with pBS-H1-afadin, the immunofluorescence signals for ZO-1, JAM-A, and E-cadherin in these cells were used as a control to assess the relative fluorescence intensities of these molecules in GFP-positive, co-transfected cells. In MDCK cells co-transfected with pBS-H1-afadin and pEGFP, the immunofluorescence signals for ZO-1, JAM-A, and E-cadherin were barely detectable at the cell-cell adhesion sites, consistent with previous results (35) (Fig. 5,A and D). However, the signals for ZO-1, JAM-A, and E-cadherin, as well as GFP-afadin, were distributed at the cell-cell adhesion sites in GFP-afadin-rescued MDCK cells (Fig. 5, B and D). By contrast, the signals for ZO-1 and JAM-A were localized discontinuously at the cell-cell adhesion sites in GFP-afadin-ΔPR1–2-rescued MDCK cells, although the signals for GFP-afadin-ΔPR1–2 and E-cadherin were continuously detected there (Fig. 5, C and D). The expression levels of GFP-afadin and GFP-afadin-ΔPR1–2 were roughly equal to that of endogenous afadin, considering the immunofluorescence signals determined by the anti-afadin Abs (Fig. 5, B and C). Furthermore, the measurement of paracellular diffusion of a nonionic solute, FITC-conjugated dextran (FITC-dextran), showed that the re-expression of GFP-afadin, but not that of GFP-afadin-ΔPR1–2, in afadin-knockdown MDCK cells significantly reduced the leakage of FITC-dextran through the MDCK cell monolayer (Fig. 5E). These results indicate that the interaction of afadin with ZO-1 is necessary for the formation of TJs, but not AJs, and is also involved in the establishment of TJ barrier function.
FIGURE 5.
Requirement of the interaction of afadin with ZO-1 for the formation of TJs. Discontinuous localization of TJ components at cell-cell adhesion sites in afadin-knockdown MDCK cells re-expressing GFP-afadin-ΔPR1–2. After the Ca2+ switch, MDCK cells were fixed and stained in the combination with the anti-ZO-1 mAb and anti-afadin pAb, the anti-JAM-A pAb and anti-afadin mAb, or the anti-E-cadherin mAb and anti-afadin pAb. A, afadin-knockdown MDCK cells expressing GFP. B, afadin-knockdown MDCK cells re-expressing GFP-afadin. C, afadin-knockdown MDCK cells re-expressing GFP-afadin-ΔPR1–2. Arrowheads indicate the absence of the signals for ZO-1, JAM-A, or E-cadherin. Scale bars, 10 μm. D, bars in the graph represent the relative immunofluorescence intensities of ZO-1, JAM-A, and E-cadherin at the interface between GFP-, GFP-afadin-, or GFP-afadinΔPR1–2-expressing cells as compared with the values at the interface between GFP-negative cells, which are expressed as 1. E, paracellular diffusion of FITC-dextran (average 40 kDa) in afadin-knockdown MDCK cells re-expressing GFP, GFP-afadin, or GFP-afadin-ΔPR1–2. Error bars in D and E indicate S.E. **, p < 0.01.
DISCUSSION
We first showed here that the interaction of afadin with ZO-1 is transient during the formation of cell-cell junctions in MDCK cells. This interaction is more markedly observed before TJs are formed. During and after the formation of TJs, ZO proteins appear to be dissociated from afadin, which associates with nectins at AJs, and to be translocated to the apical side of AJs, eventually binding to JAMs and claudins. These results are consistent with the earlier observations that ZO-1 is concentrated at the nectin-based cell-cell adhesion sites in a manner dependent on afadin and independent of α-catenin before TJs are formed in MDCK cells, and that ZO-1 is then accumulated at TJs after TJs are formed (36).
We also determined the binding sites within afadin and ZO-1 for each other. The first and second proline-rich regions of afadin and the SH3 domain of ZO-1 are necessary for the interaction of these two proteins, consistent with the earlier observation that the SH3 domain binds to a proline-rich domain (37). Then, by use of the deletion mutant of afadin, which does not interact with ZO-1, we showed that the interaction of afadin with ZO-1 is necessary for the formation of TJs, but not AJs. These results are consistent with earlier observations: both afadin and ZO-1 are necessary for the formation of TJs, and afadin, but not ZO-1, is important for the formation of AJs (25, 33). Expression of ZO-1 in which the SH3 domain was point mutated did not restore the formation of TJs in ZO-1-knockdown MDCK cells (24). On the other hand, there is a report that showed the importance of ZO-1 for the formation of mature belt-like AJs (38). The reason for the discrepancy concerning the effect of ZO-1 on the AJ formation remains to be clarified, but the difference of cell lines used might be involved in such discrepancy.
The detailed mechanism of how the interaction of afadin with ZO-1 is involved in the formation of TJs remains unknown, but we propose here the following model based on the present and previous observations. The nectin-afadin complex first forms a cell-cell adhesion between apposing cells, and then both α-catenin and ZO-1 are recruited to the nectin-afadin complex-mediated initial cell-cell adhesion sites by directly binding to afadin. Thereafter, the cadherin-β-catenin complex is recruited to these cell-cell adhesion sites by directly binding to α-catenin. Because ZO-1 has been shown to bind to α-catenin (39), ZO-1 may bind to both afadin and α-catenin at AJs. Even after AJs are formed by the nectin-afadin and cadherin-catenin complexes, ZO-1 is associated with afadin and α-catenin, because ZO-1 is highly concentrated at AJs in fibroblasts, which have no TJs (40). One afadin molecule may bind to both ZO-1 and α-catenin. Another possibility is that, because nectins form cis-dimers, each of which bind to two afadin molecules, one afadin molecule might bind to ZO-1, whereas the other binds to α-catenin. However, once TJs start to be formed, JAMs and claudins may also bind to ZO-1, which is involved in the preexisting nectin-afadin-ZO-1 protein complex, and are recruited to the apical side of AJs, followed by the dissociation of ZO-1 from afadin to form the JAM-ZO-1 and claudin-ZO-1 complexes. Alternatively, ZO-1 might be first dissociated from afadin of the nectin-afadin-ZO-1 protein complex, and this free ZO-1 could bind to JAMs and claudins and recruit these TJ CAMs to the apical side of AJs. It remains unknown which case is more likely, but it is obvious that ZO-1 is dissociated from afadin once TJs start to be formed, and that it is translocated from AJs to TJs after TJs are established.
TJs are formed at the apical side of AJs. It was reported that in MDCK cells, expression of ZO-1 constructs lacking the unique-6 motif, which localizes at the immediately C-terminal position of the GUK domain, inhibited the proper localization of TJs, but distributed the TJ strands diffusely along the lateral region of cell-cell adhesion sites (41). This observation also suggests that ZO-1 plays important roles in both the formation and localization of TJs, although little is known of how ZO-1 performs these roles. MDCK cells express three ZO family proteins: ZO-1, ZO-2, and ZO-3 (42–44). In this study, we focused on ZO-1 among these ZO proteins, because the previous reports showed that silencing of the ZO-1 gene or expression of a ZO-1 mutant significantly impaired the assembly of TJs in MDCK cells and that depletion of ZO-2 did not affect the formation of TJs in these cells (24, 41). It seems unclear why functional redundancy does not work in ZO-1-knockdown MDCK cells despite the presence of ZO-2 and ZO-3, but because ZO-2 and ZO-3 interact with ZO-1, the proper intracellular localizations and functions of ZO-2 and ZO-3 might be abrogated in the absence of ZO-1. More studies in the future will be required to address this issue.
Acknowledgments
We thank Drs. W. Birchmeier, K. Matsumoto, H. Shibuya, M. Takeichi, and S. Tsukita for generous gifts of reagents.
This work was supported by a grant-in-aid for scientific research and for Cancer Research and by Targeted Proteins Research Program (TPRP) from the Ministry of Education, Culture, Sports, Science, and Technology, Japan (2007–2009), and by Hyogo Science and Technology Association.
- TJ
- tight junction
- AJ
- adherens junction
- F-actin
- actin filament
- CAM
- cell adhesion molecule
- RA
- Ras-binding
- FHA
- forkhead-associated
- DIL
- dilute
- PR
- proline-rich
- DMEM
- Dulbecco's modified Eagle's medium
- mAb
- monoclonal antibody
- pAb
- polyclonal antibody
- TPA
- 12-O-tetradecanoyl-phorbol-13-acetate
- TBS
- Tris-buffered saline
- PBS
- phosphate-buffered saline
- FITC
- fluorescein isothiocyanate
- JAM
- junctional adhesion molecule
- GFP
- green fluorescent protein
- HA
- hemagglutinin
- MDCK
- Madin-Darby canine kidney.
REFERENCES
- 1.Farquhar M. G., Palade G. E. (1963) J. Cell Biol. 17, 375–412 [DOI] [PMC free article] [PubMed] [Google Scholar]
- 2.Umeda K., Ikenouchi J., Katahira-Tayama S., Furuse K., Sasaki H., Nakayama M., Matsui T., Tsukita S., Furuse M. (2006) Cell 126, 741–754 [DOI] [PubMed] [Google Scholar]
- 3.Yap A. S., Brieher W. M., Gumbiner B. M. (1997) Annu. Rev. Cell Dev. Biol. 13, 119–146 [DOI] [PubMed] [Google Scholar]
- 4.Tsukita S., Furuse M., Itoh M. (2001) Nat. Rev. Mol. Cell Biol. 2, 285–293 [DOI] [PubMed] [Google Scholar]
- 5.Ebnet K., Suzuki A., Ohno S., Vestweber D. (2004) J. Cell Sci. 117, 19–29 [DOI] [PubMed] [Google Scholar]
- 6.Itoh M., Furuse M., Morita K., Kubota K., Saitou M., Tsukita S. (1999) J. Cell Biol. 147, 1351–1363 [DOI] [PMC free article] [PubMed] [Google Scholar]
- 7.Bazzoni G., Martinez-Estrada O. M., Orsenigo F., Cordenonsi M., Citi S., Dejana E. (2000) J. Biol. Chem. 275, 20520–20526 [DOI] [PubMed] [Google Scholar]
- 8.Takeichi M. (2007) Nat. Rev. Neurosci. 8, 11–20 [DOI] [PubMed] [Google Scholar]
- 9.Yagi T., Takeichi M. (2000) Genes Dev. 14, 1169–1180 [PubMed] [Google Scholar]
- 10.Nagafuchi A. (2001) Curr. Opin. Cell Biol. 13, 600–603 [DOI] [PubMed] [Google Scholar]
- 11.Davis M. A., Ireton R. C., Reynolds A. B. (2003) J. Cell Biol. 163, 525–534 [DOI] [PMC free article] [PubMed] [Google Scholar]
- 12.Takai Y., Miyoshi J., Ikeda W., Ogita H. (2008) Nat. Rev. Mol. Cell Biol. 9, 603–615 [DOI] [PubMed] [Google Scholar]
- 13.Takai Y., Ikeda W., Ogita H., Rikitake Y. (2008) Annu. Rev. Cell Dev. Biol. 24, 309–342 [DOI] [PubMed] [Google Scholar]
- 14.Takai Y., Nakanishi H. (2003) J. Cell Sci. 116, 17–27 [DOI] [PubMed] [Google Scholar]
- 15.Yamada A., Fujita N., Sato T., Okamoto R., Ooshio T., Hirota T., Morimoto K., Irie K., Takai Y. (2006) Oncogene 25, 5085–5102 [DOI] [PubMed] [Google Scholar]
- 16.Mandai K., Nakanishi H., Satoh A., Obaishi H., Wada M., Nishioka H., Itoh M., Mizoguchi A., Aoki T., Fujimoto T., Matsuda Y., Tsukita S., Takai Y. (1997) J. Cell Biol. 139, 517–528 [DOI] [PMC free article] [PubMed] [Google Scholar]
- 17.Takahashi K., Nakanishi H., Miyahara M., Mandai K., Satoh K., Satoh A., Nishioka H., Aoki J., Nomoto A., Mizoguchi A., Takai Y. (1999) J. Cell Biol. 145, 539–549 [DOI] [PMC free article] [PubMed] [Google Scholar]
- 18.Tachibana K., Nakanishi H., Mandai K., Ozaki K., Ikeda W., Yamamoto Y., Nagafuchi A., Tsukita S., Takai Y. (2000) J. Cell Biol. 150, 1161–1176 [DOI] [PMC free article] [PubMed] [Google Scholar]
- 19.Takahashi K., Matsuo T., Katsube T., Ueda R., Yamamoto D. (1998) Mech. Dev. 78, 97–111 [DOI] [PubMed] [Google Scholar]
- 20.Yamamoto T., Harada N., Kano K., Taya S., Canaani E., Matsuura Y., Mizoguchi A., Ide C., Kaibuchi K. (1997) J. Cell Biol. 139, 785–795 [DOI] [PMC free article] [PubMed] [Google Scholar]
- 21.González-Mariscal L., Betanzos A., Avila-Flores A. (2000) Semin. Cell Dev. Biol. 11, 315–324 [DOI] [PubMed] [Google Scholar]
- 22.Sakisaka T., Nakanishi H., Takahashi K., Mandai K., Miyahara M., Satoh A., Takaishi K., Takai Y. (1999) Oncogene 18, 1609–1617 [DOI] [PubMed] [Google Scholar]
- 23.Yamada A., Irie K., Hirota T., Ooshio T., Fukuhara A., Takai Y. (2005) J. Biol. Chem. 280, 6016–6027 [DOI] [PubMed] [Google Scholar]
- 24.McNeil E., Capaldo C. T., Macara I. G. (2006) Mol. Biol. Cell 17, 1922–1932 [DOI] [PMC free article] [PubMed] [Google Scholar]
- 25.Sato T., Fujita N., Yamada A., Ooshio T., Okamoto R., Irie K., Takai Y. (2006) J. Biol. Chem. 281, 5288–5299 [DOI] [PubMed] [Google Scholar]
- 26.Kartenbeck J., Schmelz M., Franke W. W., Geiger B. (1991) J. Cell Biol. 113, 881–892 [DOI] [PMC free article] [PubMed] [Google Scholar]
- 27.Bradford M. M. (1976) Anal. Biochem. 72, 248–254 [DOI] [PubMed] [Google Scholar]
- 28.Fukuhara A., Irie K., Yamada A., Katata T., Honda T., Shimizu K., Nakanishi H., Takai Y. (2002) Genes Cells 7, 1059–1072 [DOI] [PubMed] [Google Scholar]
- 29.Fukuhara A., Irie K., Nakanishi H., Takekuni K., Kawakatsu T., Ikeda W., Yamada A., Katata T., Honda T., Sato T., Shimizu K., Ozaki H., Horiuchi H., Kita T., Takai Y. (2002) Oncogene 21, 7642–7655 [DOI] [PubMed] [Google Scholar]
- 30.Honda T., Shimizu K., Kawakatsu T., Yasumi M., Shingai T., Fukuhara A., Ozaki-Kuroda K., Irie K., Nakanishi H., Takai Y. (2003) Genes Cells 8, 51–63 [DOI] [PubMed] [Google Scholar]
- 31.Asakura T., Nakanishi H., Sakisaka T., Takahashi K., Mandai K., Nishimura M., Sasaki T., Takai Y. (1999) Genes Cells 4, 573–581 [DOI] [PubMed] [Google Scholar]
- 32.Okamoto R., Irie K., Yamada A., Katata T., Fukuhara A., Takai Y. (2005) Genes Cells 10, 435–445 [DOI] [PubMed] [Google Scholar]
- 33.Umeda K., Matsui T., Nakayama M., Furuse K., Sasaki H., Furuse M., Tsukita S. (2004) J. Biol. Chem. 279, 44785–44794 [DOI] [PubMed] [Google Scholar]
- 34.Ikeda W., Nakanishi H., Miyoshi J., Mandai K., Ishizaki H., Tanaka M., Togawa A., Takahashi K., Nishioka H., Yoshida H., Mizoguchi A., Nishikawa S., Takai Y. (1999) J. Cell Biol. 146, 1117–1132 [DOI] [PMC free article] [PubMed] [Google Scholar]
- 35.Ooshio T., Fujita N., Yamada A., Sato T., Kitagawa Y., Okamoto R., Nakata S., Miki A., Irie K., Takai Y. (2007) J. Cell Sci. 120, 2352–2365 [DOI] [PubMed] [Google Scholar]
- 36.Yokoyama S., Tachibana K., Nakanishi H., Yamamoto Y., Irie K., Mandai K., Nagafuchi A., Monden M., Takai Y. (2001) Mol. Biol. Cell 12, 1595–1609 [DOI] [PMC free article] [PubMed] [Google Scholar]
- 37.Li S. S. (2005) Biochem. J. 390, 641–653 [DOI] [PMC free article] [PubMed] [Google Scholar]
- 38.Ikenouchi J., Umeda K., Tsukita S., Furuse M. (2007) J. Cell Biol. 176, 779–786 [DOI] [PMC free article] [PubMed] [Google Scholar]
- 39.Itoh M., Nagafuchi A., Moroi S., Tsukita S. (1997) J. Cell Biol. 138, 181–192 [DOI] [PMC free article] [PubMed] [Google Scholar]
- 40.Yonemura S., Itoh M., Nagafuchi A., Tsukita S. (1995) J. Cell Sci. 108, 127–142 [DOI] [PubMed] [Google Scholar]
- 41.Fanning A. S., Little B. P., Rahner C., Utepbergenov D., Walther Z., Anderson J. M. (2007) Mol. Biol. Cell 18, 721–731 [DOI] [PMC free article] [PubMed] [Google Scholar]
- 42.Gumbiner B., Lowenkopf T., Apatira D. (1991) Proc. Natl. Acad. Sci. U.S.A. 88, 3460–3464 [DOI] [PMC free article] [PubMed] [Google Scholar]
- 43.Haskins J., Gu L., Wittchen E. S., Hibbard J., Stevenson B. R. (1998) J. Cell Biol. 141, 199–208 [DOI] [PMC free article] [PubMed] [Google Scholar]
- 44.Stevenson B. R., Siliciano J. D., Mooseker M. S., Goodenough D. A. (1986) J. Cell Biol. 103, 755–766 [DOI] [PMC free article] [PubMed] [Google Scholar]


