

Abstract
We investigated the predictive value of arterial stiffness to assess cardiovascular risk in elderly community-dwelling people by means of a multivariate Cox model. In 298 people older than 75 years (120 men and 178 women, average age: 79.6 years), brachial-ankle pulse wave velocity (baPWV) was measured between the right arm and ankle in a supine position. The LILAC study started on July 25, 2000, consultation was repeated yearly, and the last follow-up ended on November 30, 2004. During this follow-up span of 1227 days, there were nine cardiovascular deaths, the cause of death being myocardial infarction for two men and three women or stroke for two men and two women. In Cox proportional hazard models, baPWV as well as age, Mini-Mental State Examination (MMSE), Hasegawa Dementia Scale Revised (HDSR) and the low-frequency/high-frequency (LF/HF) ratio showed a statistically significant association with the occurrence of cardiovascular death. A two-point increase in MMSE and HDSR score significantly protected against cardiovascular death, the relative risk (RR) being 0.776 (P = 0.0369) and 0.753 (P = 0.0029), respectively. The LF/HF ratio also was significant (P = 0.025), but the other indices of HRV were not. After adjustment for age and HDSR, a 200 cm/s increase in baPWV was associated with a 30.2% increase in risk (RR = 1.302, 95% CI: 1.110-1.525), and a 500 cm/s increase in baPWV with a 93.3% increase in risk (RR = 1.933, 95% CI: 1.300-2.874, P = 0.0011), whereas the LF/HF ratio was no longer associated with a statistically significant increase in cardiovascular mortality. In elderly community-dwelling people, arterial stiffness measured by means of baPWV predicted the occurrence of cardiovascular death beyond the prediction provided by age, gender, blood pressure and cognitive functions, baPWV should be added to the cardiovascular assessment in various clinical settings, including field medical surveys and preventive screening. The early detection of risk by chronomics allows the timely institution of prophylactic measures, thereby shifting the focus from rehabilitation to prehabilitation medicine, as a public service to several Japanese towns.
Keywords: Pulse wave velocity, Cardiovascular risk, Cognitive function, Elderly community-dwelling people
1. Introduction
As the incidence of myocardial infarction has increased in Japan and since cardiovascular disease, including stroke is the leading cause of mortality and morbidity, the prevention of these conditions is a major goal. Atherosclerosis is an important cause of morbidity and mortality in the elderly, and arterial stiffness may predict cardiovascular events [1]. Several cardiovascular indices, such as blood pressure (BP), heart rate (HR) and heart rate variability (HRV) are predictors of vascular disease risk [2]. This study aimed at assessing their role in association with arterial stiffness in predicting cardiovascular mortality. Arterial stiffness can be assessed non-invasively by measuring pulse wave velocity (PWV), which is a simple and reproducible endpoint.
Recent cohort studies suggested that PWV might be a strong predictor of atherosclerotic cardiovascular events, cardiovascular mortality, and all-cause mortality, independently of age and conventional atherosclerotic risk factors [3-5]. Most studies, however, focused on patients of occidental ancestry, often affected by specific diseases, rather than on Japanese populations. In 2000, we began a community-based study to longitudinally investigate the longevity and aging of a rural population in Hokkaido County (LILAC), and to evaluate this population’ s neurocardiological function. Our goal was the prevention of cardiovascular events, including strokes and myocardial ischemic events, and to prevent the associated decline in cognitive function of the elderly in this community dwelling.
As the first step of the LILAC study, we focused on the relationship between aortic stiffness measured by PWV and cardiovascular mortality, We assessed the predictive value of arterial stiffness in predicting cardiovascular risk in an elderly population using a multivariate Cox model.
2. Methods
2.1. Subjects and LILAC study design
We examined 298 people older than 75 years (average age, 79.6 years). BP was measured in a sitting position at the beginning of the study, and brachial-ankle PWV (baPWV) was measured between the right arm and ankle in a supine position, using an ABI/Form instrument (Nippon Colin Co., Ltd., Komaki, Japan). The baPWV was measured using a volume-plethysmographic method. ECG electrodes were placed on both wrists, a microphone for detecting heart sounds was placed on the left edge of the sternum, and cuffs were wrapped on both arms and ankles. The cuffs were connected to a plethysmographic sensor that determines the volume pulse form and oscillometric pressure waveforms were recorded using a semiconductor pressure sensor (the sample acquisition frequency for PWV was set at 1200 Hz). baPWV was measured in duplicate after at least a 5-min rest in each case. Only baPWV measures from participants showing an ankle/brachial pressure index (ABI) value above 0.90 were used for analysis.
We used the first hour of ambulatory ECG recording obtained during routine medical examinations conducted each year in July. The data were processed for HRV using a Fukuda-Denshi Holter analysis system (SCM-280-3). Time-domain measures (SDNN, pNN50, SDANN and Lorenz plot indices: Length (L), Width (W), and L/W ratio) and frequency-domain measures (spectral power in the “very low frequency”—VLF: 0.003-0.04 Hz, “low frequency”—LF: 0.04-0.15 Hz, and “high frequency”—HF: 0.15-0.40 Hz regions, and the LF/HF ratio) were determined. Except for SDNN and HR, calculated over the whole 1-h record, all indices were computed as averages over consecutive 5-min intervals. Spectral indices were obtained by the maximum entropy method (MEM) with the MemCalc/CHIRAM program (Suwa Trust Co., Ltd., Tokyo, Japan).
The Japanese versions of the Mini-Mental State Examination (MMSE) and the Hasegawa Dementia Scale Revised (HDSR) tests were used to measure the overall cognitive function, including verbal orientation, memory, and constructional ability (Kohs’ block test). The Up and Go test measured, in seconds, the time it took the subject to stand up from a chair, walk a distance of 3 m, turn, walk back to the chair, and sit down again. This test is a simple measure of physical mobility and demonstrates the subject’s balance, gait speed, and functional ability. A lower time score indicates better physical mobility. Functional Reach (FR), used to evaluate balance, represents the maximal distance a subject can reach forward beyond arm’s length while maintaining a fixed base of support in the standing position. A higher score indicates better balance. Manual dexterity was assessed using a panel with combinations of 10 hooks, 10 big buttons, and five small buttons. There were three discrete measurements of time recorded for each participant (10 “hook-on”s, 10 big “button-on-and-off”s, and five small “button-on-and-off”s). The total manual dexterity time in seconds, defined as the button score (Button-S), was calculated by adding the average times for one hook-on and one big or small button-on-and-off. A lower button score indicates better manual dexterity.
2.2. Cardiovascular mortality
The LILAC study was started on July 25, 2000 and consultations were repeated every year (end of July, or beginning of August). In addition, one or two doctors of our team visited every 3 months and offered several kinds of health consultation, rehabilitation of disordered function, healthy lifestyle modification by promoting complete cessation of smoking, weight reduction, reduction of salt intake, moderation in the consumption of fruits and vegetables and alcohol intake, as well as providing prescription advice to the local general medical practitioner.
In this investigation, the follow-up ended on November 30, 2004. During this follow-up span, there were nine cardiovascular deaths, the cause of death being myocardial infarction or stroke. Follow-up time was defined as the time elapsed between the first (reference) examination and the time of first cardiovascular event or death.
2.3. Statistical analysis
All data were analyzed with the Statistical Software for Windows (StatFlex Ver.5.0, Artec, Osaka, http://www.statflex.net). The effects of classic risk factors on baPWV were assessed by a multivariate regression analysis. We used Cox’s regression analysis to calculate the unadjusted and adjusted relative risks (RRs) and 95% confidence intervals (CIs) for cardiovascular death. To identify independent predictors of cardiovascular death in relation to baPWV, we used a multivariate Cox regression analysis with stepwise selection. Variables included in the multivariate models were age, gender, BP, HR, HRV, MMSE, HDSR and Kohs’ block test.
An abnormal value of baPWV (>2500 crn/sec) was independently assessed by logistic regression analysis. Kaplan-Meier event probability curves were computed with two groups, stratified by the abnormal value of baPWV, and the cumulative probability of events of two groups was compared by means of the log-rank test. Statistical significance was considered at a value of P < 0.05.
3. Results
The characteristics of the 298 subjects at the start of study (reference) are given in Table 1. The sample comprises 120 men and 178 women. The mean age of participants at entry was 79.6 years. The mean follow-up time was 1227.2 days, during which 9 subjects died (myocardial infarction: 2 men and 3 women; stroke: two men and two women).
Table 1.
Reference characteristics of subjects
| Endpoint | Mean | SD |
|---|---|---|
| Gender | 0.403 | |
| Age | 79.0 | 4.75 |
| BMI | 23.4 | 3.74 |
| SBP | 141.2 | 19.56 |
| DBP | 75.5 | 10.57 |
| PP | 65.8 | 16.41 |
| HR | 70.8 | 11.46 |
| PWV | 2097 | 504.6 |
| ABI | 1.02 | 0.14 |
| Up&Go | 16.5 | 6.54 |
| FR | 25.6 | 7.77 |
| Button | 15.7 | 7.16 |
| MMSE | 24.2 | 4.43 |
| HDSR | 23.6 | 5.30 |
| Kohs | 19.1 | 11.17 |
| GDS | 4.8 | 2.96 |
| VLF | 912.3 | 743.3 |
| LF | 207.2 | 299.0 |
| HF | 102.7 | 250.3 |
| LF/HF | 2.84 | 1.70 |
| pNN50 | 4.36 | 8.87 |
| CVRR | 5.04 | 1.95 |
| RMSSD | 22.6 | 12.5 |
| SDNN | 37.4 | 16.0 |
Gender: Man = 1, Woman = 0 (120 men and 178 women)
Out of the 298 participants, baPWV was measured in 245 subjects, and a baPWV above 2500 cm/s was observed in 33 subjects, five of whom died (three from a myocardial infarction and two from a stroke). Their reference characteristics are given in Table 2, which shows that an increased baPWV is associated with older age, higher systolic and diastolic BP, increased pulse pressure and shorter FR. Subjects with an increased value of baPWV included fewer event-free survivors. Kaplan-Meier curves for event-free survival revealed a significant difference between the two groups stratified by a baPWV of 2500 cm/s (P < 0.00005, log-rank test) (Fig. 1).
Table 2.
Reference Characteristics of Subjects with Acceptable or Increased baPWV
| n=212 | n=33 | |||||
|---|---|---|---|---|---|---|
| Endpoint | baPWV <2500 | baPWV >2500 | t-value | p-value | ||
| Mean | S.D. | Mean | S.D. | |||
| Gender | 0.396 | 0.424 | 0.304 | N.S. | ||
| Age | 78.7 | 4.39 | 80.4 | 4.54 | 2.045 | 0,0420 |
| BMI | 23.5 | 3.88 | 23.0 | 3.41 | -0.722 | N.S. |
| SBP | 139.2 | 18.14 | 154.2 | 25.81 | 4.087 | 0,0001 |
| DBP | 74.3 | 9.82 | 79.6 | 14.33 | 2.635 | 0,0090 |
| PP | 64.9 | 15.80 | 74.7 | 18.66 | 3.158 | 0,0018 |
| HR | 70.1 | 11.24 | 72.5 | 12.77 | 1.090 | N.S. |
| PWV | 1949 | 292.0 | 3045 | 555.0 | 17.298 | 0,0000 |
| ABI | 1.03 | 0.12 | 0.99 | 0.17 | -1.704 | N.S. |
| Up&Go | 16.1 | 6.36 | 17.5 | 6.77 | 1.128 | N.S. |
| FR | 26.2 | 7.66 | 22.5 | 7.64 | -2.533 | 0,0120 |
| Button | 15.2 | 7.05 | 16.1 | 4.53 | 0.682 | N.S. |
| MMSE | 24.3 | 5.18 | 23.7 | 5.33 | -0.827 | N.S. |
| HDSR | 24.0 | 5.18 | 22.6 | 5.13 | -1.444 | N.S. |
| Kohs | 19.6 | 11.08 | 17.1 | 10.42 | -1.177 | N.S. |
| GDS | 4.8 | 2.85 | 4.8 | 3.16 | 0.125 | N.S. |
| VLF | 938.7 | 788.5 | 738.6 | 440.9 | -1.187 | N.S. |
| LF | 211.1 | 303.7 | 133.2 | 113.7 | 1.216 | N.S. |
| HF | 98.8 | 235.1 | 63.8 | 52.1 | -0.711 | N.S. |
| LF/HF | 2.88 | 1.70 | 2.70 | 1.51 | -0.482 | N.S. |
| pNN50 | 4.28 | 8.24 | 2.70 | 3.68 | -0.908 | N.S. |
| CVRR | 4.98 | 1.55 | 4.79 | 1.34 | -0.571 | N.S. |
| rMSSD | 22.1 | 9.7 | 20.8 | 7.3 | -0.624 | N.S. |
| SDNN | 37.7 | 16.2 | 33.3 | 9.8 | -1.242 | N.S. |
Gender: Man = 1, Woman = 0.
Statistical significance of difference in PWV between the 2 groups validates classification.
Fig. 1.
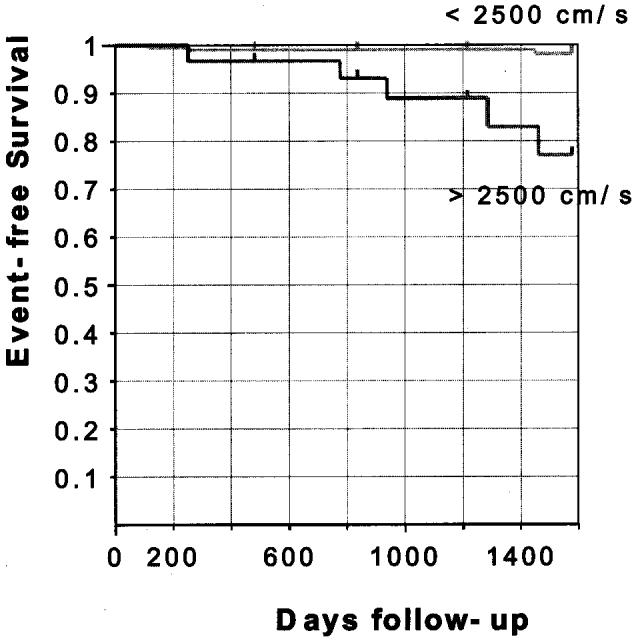
Kaplan-Meier event probability curves for cardiovascular death.
Among the variables used in Cox proportional hazard models, PWV as well as age, MMSE, HDSR and the LF/HF ratio were statistically significantly associated with the occurrence of cardiovascular death (Table 3). In univariate analyses, a 200 or 500 cm/s increase in baPWV was associated with a RR of cardiovascular death of 1.335 or 2.058, respectively (P < 0.0002). A two-point increase in MMSE and HDSR score significantly protected against cardiovascular death, being associated with RRs of 0.776 (P = 0.0369) and 0.753 (P = 0.0029), respectively. The LF/HF ratio also showed significant predictive value (P = 0.025), but other HRV indices did not.
Table 3.
RR of CV Death in relation to PWV, HRV, Cognitive function and classic CV Risk factors
| Endpoint | RR | 95% CI | p-value |
|---|---|---|---|
| Gender | N.S. | ||
| Age (5) | 1.859 | 1.008-3.427 | 0.0469 |
| BMI | N.S. | ||
| SBP | N.S. | ||
| DBP | N.S. | ||
| PP | N.S. | ||
| HR | N.S. | ||
| PWV (200) | 1.335 | 1.147-1.553 | 0.0002 |
| PWV (500) | 2.058 | 1.410-3.005 | 0.0002 |
| PWV (200)* | 1.302 | 1.110-1.525 | 0.0011 |
| PWV (500)* | 1.933 | 1.300-2.874 | 0.0011 |
| ABI | N.S. | ||
| Up&Go | N.S. | ||
| FR | 0.0696 | ||
| Button | N.S. | ||
| MMSE (2) | 0.776 | 0.612-0.985 | 0.0369 |
| HDSR (2) | 0.753 | 0.624-0.907 | 0.0029 |
| Kohs | 0.0991 | ||
| GDS | N.S. | ||
| VLF | N.S. | ||
| LF | N.S. | ||
| HF | N.S. | ||
| LF/HF (0.20) | 0.821 | 0.690-0.976 | 0.0255 |
| pNN50 | N.S. | ||
| CVRR | N.S. | ||
| RMSSD | N.S. | ||
| SDNN | N.S. |
After adjustment for age and HDSR
In multivariate analyses, when both baPWV and age were used as continuous variables in the same model, baPWV remained statistically significantly associated with the occurrence of cardiovascular death. After adjustment for age and HDSR, a 200 cm/s increase in baPWV was associated with a 30.2% increase in risk (RR = 1.302, 95% CI: 1.110 to 1.525), and a 500 cm/s increase in baPWV with a 93.3% increase in risk (RR = 1.933, 95% CI: 1.300 to 2.874), P = 0.0011. In multivariate analyses, when both the LF/HF ratio and age were used as continuous variables in the same model, the LF/HF ratio was no longer statistically significantly associated with cardiovascular mortality.
4. Discussion
The main result of the present study is that in elderly community-dwelling people, arterial stiffness measured by means of baPWV predicted the occurrence of cardiovascular death beyond the prediction provided by age, gender, blood pressure and cognitive functions, assessed by a multivariate Cox model. The baPWV measure is a novel noninvasive technique, which has been developed to assess pulse wave transmission between the brachial and tibial arteries [6]. PWV is known to be an indicator of arterial stiffness and a marker of vascular damage [7]. Traditionally, carotid-femoral PWV is an established method for measuring PWV. Contrary to this traditional PWV, baPWV includes peripheral components of the arterial tree. We need to consider the role of this arterial tree because the influence of age changes in different parts of the arterial tree. Although baPWV values are larger compared to those obtained by the traditional method, their validity has been demonstrated by Yamashina et al. [6]. Findings herein suggest the usefulness of baPWV for clinical use. It has also been argued that baPWV is strongly affected by blood pressure [8] and that this effect should be considered in clinical practice. This investigation showed that baPWV but not BP was predictive of cardiovascular mortality. Hence, baPWV should be added to the cardiovascular assessment in various clinical settings, including field medical surveys and preventive screenings. Other advantages of this method are that it is not time consuming, that it has good reproducibility, and that it does not require highly skilled technicians.
We have started a novelty medicine focusing on a comprehensive cardiovascular assessment, namely a new field of chrono-ecology in medicine, which is important for a better diagnosis and a more effective treatment. We need to get information about the disease not only from the patient, but also from the natural environment. Often the most important key originates not from the patients themselves, but from their whole environment. Most organisms on Earth, including humans, have developed “clock” genes underlying the circadian, and probably many other components in the spectral element of chronomes, beyond about-yearly (circannual) and about-weekly (circaseptan) features, as a product of adaptation to, or rather integration with, cycles in the cosmos. While life originally integrated itself into the cycles of an anthropogenically unpolluted environment, the environmental cycles are now being changed in keeping with the schedules of societal life, as in the case of global temperature, and perhaps the geomagnetic index.
Hence, a variety of cognitive, neurobehavioral and neuropsychological as well as cardiovascular functions will need to be investigated to more precisely map their chronomes in space and time, in order to understand chronoastrobiology, based on both the system times and time horizons yielded by chronomes assessed in communities worldwide. Fortunately, this mapping in the field has been sought not only in several rural Japanese towns, but also in old towns in the Karakoram and the Andes, by Matsubayashi et al. We have also started a novelty project for stroke prevention based on a comprehensive assessment, especially of elderly community-dwelling people, as shown herein. This kind of new project stands on the viewpoint of chronomics, aiming at prehabilitation medicine in preference to sole rehabilitation. It is offered as a public service in several Japanese towns, according to plans originally made in the city of Roseville, a suburb of St. Paul, Minnesota.
Acknowledgements
This study was supported by Japan Arteriosclerosis Prevention Fund.
References
- [1].Meaume S, Benetos A, Henry OF, Rudnichi A, Safar ME. Aortic pulse wave velocity predicts cardiovascular mortality in subjects >70 years of age. Arterioscler Thromb Vase Bio1. 2001;21:2046–50. doi: 10.1161/hq1201.100226. [DOI] [PubMed] [Google Scholar]
- [2].Fujiwara Y, Chaves P, Takahashi R, Amano H, Kumagai S, Fujita K, et al. relationships between brachial-ankle pulse wave velocity and conventional atherosclerotic risk factors in community-dwelling people. Preventive Medicine. 2004;39:1135–42. doi: 10.1016/j.ypmed.2004.04.026. [DOI] [PubMed] [Google Scholar]
- [3].Boutouyrie P, Tropeano AI, Asmar R, Gautier I, Benetos A, Lacolley P, et al. Aortic stiffness is an independent predictor of primary coronary events in hypertensive patients: a longitudinal study. Hypertension. 2002;39:10–15. doi: 10.1161/hy0102.099031. [DOI] [PubMed] [Google Scholar]
- [4].Laurent S, Katsahian S, Fassort C, Tropeano AI, Gautier I, Laloux B, Boutouyrie P. Aortic stiffness is an independent predictor of fatal stroke in essential hypertension. Stroke. 2003;34:1203–1206. doi: 10.1161/01.STR.0000065428.03209.64. [DOI] [PubMed] [Google Scholar]
- [5].Dijk JM, van der Graaf Y, Grobbee DE, Banga JD, Bots ML, SMART Study Group Increased arterial stiffness is independently related to cerebrovascular disease and aneurysms of the abdominal aorta. The second manifestations of arterial disease (SMART) study. Stroke. 2004;35:1642–46. doi: 10.1161/01.STR.0000130513.77186.26. on behalf of the. [DOI] [PubMed] [Google Scholar]
- [6].Yamashina A, Tomiyama H, Takeda K, Tsuda H, Arai T, Hirose K, et al. Validity, reproducibility, and clinical significance of noninvasive brachial-ankle pulse wave velocity measurement. Hypertens Res. 2002;25:359–364. doi: 10.1291/hypres.25.359. [DOI] [PubMed] [Google Scholar]
- [7].Asmar R. Arterial stiffness and pulse wave velocity. Elsevier; Amsterdam: 1999. pp. 9–15. [Google Scholar]
- [8].Yamashina A, Tomiyama H, Arai T, Koji Y, Yambe M, Motobe H, et al. Nomogram of the relation of brachial-ankle pulse wave velocity with blood pressure. Hypertens Res. 2003;26:801–806. doi: 10.1291/hypres.26.801. [DOI] [PubMed] [Google Scholar]