Abstract
Cortical-form vision comprises multiple, hierarchically arranged areas with feedforward and feedback interconnections. This complex architecture poses difficulties for attempts to link perceptual phenomena to activity at a particular level of the system. This difficulty has been especially salient in studies of binocular rivalry alternations, where there is seemingly conflicting evidence for a locus in primary visual cortex or alternatively in higher cortical areas devoted to object perception. Here, I use a competitive neural model to demonstrate that the data require at least two hierarchic rivalry stages for their explanation. This model demonstrates that competitive inhibition in the first rivalry stage can be eliminated by using suitable stimulus dynamics, thereby revealing properties of a later stage, a result obtained with both spike-rate and conductance-based model neurons. This result provides a synthesis of competing rivalry theories and suggests that neural competition may be a general characteristic throughout the form-vision hierarchy.
When an observer views orthogonal gratings, e.g., vertical and horizontal, one in each eye, the percept is not stable but rather fluctuates among horizontal, vertical, and patchwork mixtures of the two. The traditional interpretation of this rivalry is that it reflects competition between monocularly driven neurons in primary visual cortex (V1), termed interocular rivalry here (1). Two functional MRI studies have tested this idea and provided evidence for the presence of rivalry-correlated alternations in the activation of human V1 (2, 3). Furthermore, recent psychophysical evidence has shown that rivalry transitions generally occur as waves that propagate at constant speed when mapped onto V1 (4). However, primate physiological evidence has suggested that rivalry is more prominent in higher cortical areas such as V4 than in V1 (5). In addition, recent psychophysics has shown that 18.0-Hz on-off flicker of orthogonal monocular gratings coupled with swapping gratings between eyes at 1.5 Hz (3 swaps per sec) leads to perceptual dominance durations of ≈2.0 sec (6). This indicates that observers perceive a single pattern while it switches back and forth between eyes several times, a result clearly incompatible with a monocular basis for rivalry under these conditions. Finally, experiments in which the rivaling patterns are objects such as faces and houses are compatible with a higher cortical locus for rivalry (7, 8).
How can these prima facie conflicting experimental results be reconciled? Certainly one of the most definitive arguments against interocular rivalry is the 18.0-Hz flicker combined with 1.5-Hz eye-switching (F&S) procedure described above (6). The persistence of dominance across several eye swaps, however, has been shown to depend critically on the temporal parameters of the F&S procedure (9), which suggests the hypothesis that F&S stimulus dynamics might bypass or defeat an early interocular stage of rivalry competition, thereby revealing higher levels of binocular competition (10). In particular, sufficiently high temporal frequencies will generally reduce the efficacy of any recurrent feedback inhibition within a network. This in turn could bypass an initial competitive interocular rivalry stage. Neural modeling results reported here confirm this hypothesis, thus reconciling prima facie conflicting results in the literature and supporting the existence of a hierarchy of competitive rivalry stages in form vision.
Neural Model
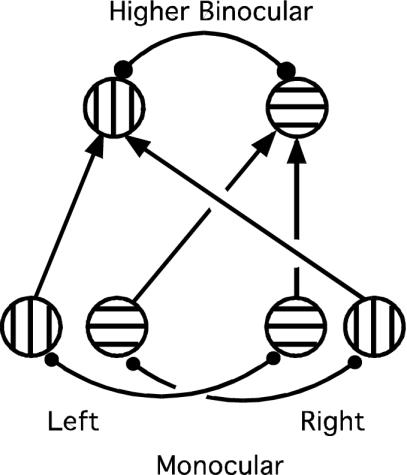
To study rivalry dynamics, a two-stage competitive neural model was implemented (Fig. 1). In common with previous rivalry models, monocular representations of horizontal and vertical gratings compete via strong reciprocal inhibition (1, 4, 11-13). For the alternations characteristic of rivalry to occur, it is necessary that the competing neurons self-adapt (13, 14), and this was modeled by spike-frequency adaptation produced by slow after-hyperpolarizing potentials (4, 12-14). Afterhyperpolarizing potentials, usually Ca2+-mediated K+ potentials, have been observed in human excitatory neocortical neurons and have time constants on the order of 1,000 msec (15). Appropriate spike-rate equations, which have been used previously to describe traveling waves in rivalry (4), are
 |
[1] |
Here EVleft is the firing rate of an excitatory neuron responding to a vertical grating presented to the left eye, Vleft(t). The asymptotic firing rate is determined by a Naka-Rushton function for positive values of the argument (V - I)+, which has been shown to provide an excellent fit to V1 spike rates (16, 17). This E neuron drives an inhibitory neuron, IVleft, which is described by a linear equation for simplicity. The E neuron receives inhibition with strength g from another inhibitory neuron IHright, which in turn is driven by a horizontal stimulus to a right eye excitatory neuron. Finally, HVleft describes the very slow self-adaptation of this neuron by an after-hyperpolarizing potential current (14).
Fig. 1.
Two-level neural network. The lower level comprises monocular left and right eye neurons selective for orthogonal gratings, represented here as vertical and horizontal hatching. Monocular neurons representing different eyes and grating orientations are mutually inhibitory, represented by heavy lines with filled circles at the ends (for clarity, inhibitory interneurons are not shown). The second model stage represents higher-level binocular neurons that receive stimulation (arrows) from left and right monocular neurons with the same preferred grating orientation. These higher-level neurons also engage in competitive inhibitory interactions, again represented by the heavy line terminating with filled circles. Recurrent excitation, when implemented (see text), was represented by feedback from each binocular neuron to both of its monocular inputs.
The model is completed by a second competitive stage in which the constituent neurons are binocular and thus pool responses from left and right monocular neurons sensitive to the same grating orientation (Fig. 1). Equations describing this higher binocular stage are identical to Eq. 1 except that the stimulus V(t) is replaced by a sum of monocular neural responses and the competitive inhibition must be stronger (see below). The percept generated by the model network is assumed to reflect the responses of this higher competitive stage.
Model simulations were conducted on a Macintosh G4 computer using a fourth-order Runge-Kutta routine. Parameters in Eq. 1 were chosen to reflect available anatomical and physiological data. Thus, the time constant for inhibitory neurons was faster than that for excitatory cells, reflecting properties of cortical fast-spiking neurons (18). In Eq. 1,(V - gI)+ = max{V - gI, 0}, because negative inputs cannot drive the firing rate below zero. The maximum firing rate of E neurons was chosen to be 100 by convention, and the Naka-Rushton nonlinearity has been related to cortical physiology (14). Other parameter values were V = 10.0, inhibitory gain g = 45.0 at the monocular level, hyperpolarizing current strength h = 0.47, excitatory input gain from monocular to a higher level was 0.75, and recurrent excitation from a higher back to lower level was 0.002 (higher values eliminated rivalry as discussed below). Finally, the recurrent inhibition at the second stage was set to 1.53 g. The need for this strengthened second-stage inhibition is discussed in Results. Although this model is deterministic, the addition of noise can generate a gamma function distribution of dominance intervals easily (12).
To ensure that major simulation results did not depend on the choice of spike-rate neural descriptions in Eq. 1, simulations were repeated by using an expanded network incorporating conductance-based neurons. The simplified conductance-based equations used here have been described and shown to produce accurate spike shapes, firing rates, and spike-frequency adaptation for human neocortical neurons (19). The four equations for each neuron describe the membrane potential V, recovery variable R (K+ inactivation current), inward Ca2+ current conductance T, and slow Ca2+ mediated K+ hyperpolarizing conductance H.
 |
[2] |
Equilibrium potentials are ENa = 50 mV, EK = -95 mV, and ECa = 120 mV. Parameters values are C = 1.0 msec, τT = 50 msec, and τH = 900 msec. For excitatory neurons, τR = 4.2 msec, but this was reduced to τR = 1.5 msec for inhibitory neurons to reproduce the narrower action potential characteristic of fast-spiking cells (18). Synapses were described by an α function with τ = 2.0 msec. Synaptic reversal potentials were 0 mV for excitatory synapses and -95 mV for inhibitory synapses. The after-hyperpolarizing potential current in excitatory neurons was produced by setting gT = 0.1 and gH = 2.5. For inhibitory neurons, gT = 0.25 and gH = 0.0, because spike-frequency adaptation does not occur in fast-spiking cells (18). Equations for m∞(V), R∞(V), and T∞(V) are in ref. 19.
Connectivity in the network using conductance-based neurons was the same as in Fig. 1 except that each excitatory neuron tuned to either horizontal or vertical gratings was replaced by a pair of spiking excitatory neurons. Each such pair in turn drove an inhibitory neuron that mediated the competitive interactions. Allowing the strength of the excitatory-to-inhibitory synapses to differ by ±5% within each pair produced a typical γ distribution for rivalry as discussed in Results. The monocular stage of the conductance-based network thus comprised 12 neurons (8 excitatory and 4 inhibitory), which is a major simplification from the 120 neuron network used in previous work on rivalry and chaos (13). However, these 12 interconnected neurons reproduce all the interocular rivalry characteristics of the much larger network described previously. The final binocular network stage included six more conductance-based neurons for a total of 18 neurons in this network hierarchy.
It bears emphasis that a neural model with 18 cells represents a vast simplification of the number of neurons actually involved in rivalry. The claim here is that this small network encapsulates the essence of hierarchical levels of rivalry. Obvious extensions of the network to large spatial arrays of rivaling neurons can incorporate such additional phenomena as traveling dominance waves easily (4).
Results
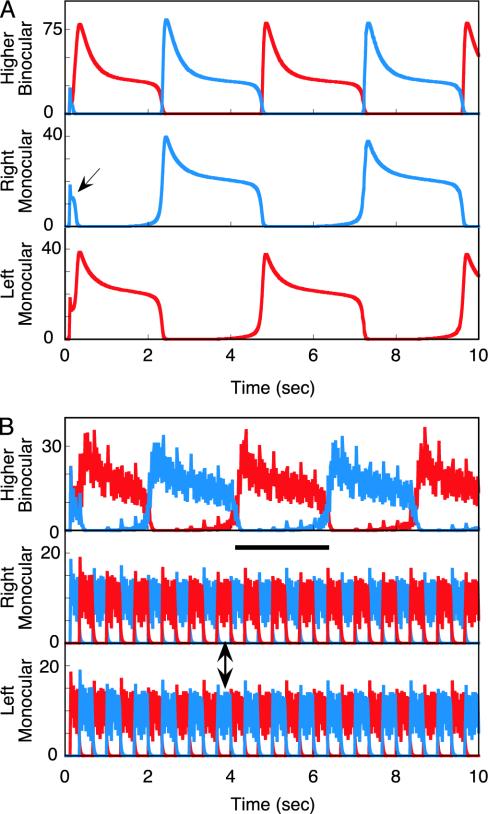
The model was stimulated first by traditional rivalry patterns: a continuously presented vertical grating to the left eye and a horizontal grating to the right. There is first a brief 150-msec period during which both horizontal and vertical neural responses pass through the network and generate a composite percept, which agrees with human psychophysical data (Fig. 2A, arrow) (20). After this, the network settles into a limit-cycle oscillation in which inhibitory competition between left and right monocular neurons produces alternate 2.4-sec periods of dominance and suppression. This monocular competition in turn drives an oscillation in the higher binocular stage (Fig. 2 A). (Stochastic aspects of rivalry alternations are discussed below.)
Fig. 2.
Network responses to two types of rivalry stimuli. Red represents neural responses to vertical gratings, and blue represents responses to horizontal gratings. (A) Traditional rivalry stimuli consist of orthogonal gratings presented continuously to the two eyes. In response, the left and right monocular neurons first briefly respond together for ≈150 msec (arrow) and then settle into an alternation in which one gains dominance and suppresses the other via inhibition. The dominant neuron then undergoes slow spike-rate adaptation until the opposite monocular neurons are released from inhibition, and the cycle repeats. This competitive alternation is reflected in responses at the higher binocular level, which is driven by its oscillatory monocular inputs. (B) A novel rivalry stimulus incorporates 18.0-Hz on-off flicker of the orthogonal gratings coupled with swapping the stimuli between eyes every 333 msec (6). In response, the monocular neurons no longer generate a competitive response alternation; instead, both vertical and horizontal neural responses are always simultaneously present (double-headed arrow). This provides equivalent input to the higher-level binocular neurons, which now generate a rivalry alternation caused by their own competitive inhibitory interactions. The result is perceptual rivalry (with superimposed flicker) with a dominance duration almost equal to that with traditional rivalry stimuli. As illustrated by the heavy horizontal bar, perceptual rivalry generated by the model extends over six to seven monocular stimulus reversals, thus demonstrating that rivalry cannot be caused by monocular competition in this instance. All results are in complete agreement with human psychophysical data (6).
Next, the model was activated by an F&S stimulus sequence. Horizontal and vertical gratings were presented dichoptically with both modulated by on-off flicker at 18.0 Hz. Additionally, vertical and horizontal were swapped between eyes every 333 msec (1.5 Hz). Under these temporal conditions, the competitive inhibition at the monocular model stage was bypassed effectively such that both horizontal and vertical neural responses occurred simultaneously (Fig. 2B, double arrow). Nevertheless, rivalry was still generated by the higher binocular stage, and the dominance period for this rivalry was ≈2.2 sec (Fig. 2B, horizontal bar), close to that in the traditional rivalry simulation. Because dominance intervals at the binocular model stage last through six to seven pattern swaps between eyes, the model reproduces the definitive human data, showing that rivalry cannot reflect competition between monocular representations during F&S stimulation (6). Simple qualitative considerations explain this dramatic shift in neural model response. Because the inhibitory neurons are located in a feedback loop driven by the E neurons, their responses at high temporal frequencies must be attenuated relative to their inputs. Under conditions of rapid temporal flicker, this attenuation renders the inhibitory competition too weak to produce suppression, and thus both signals are transmitted. For the second stage to now produce rivalry, it must have a stronger inhibitory gain than the first stage to survive the attenuation produced by input flicker.
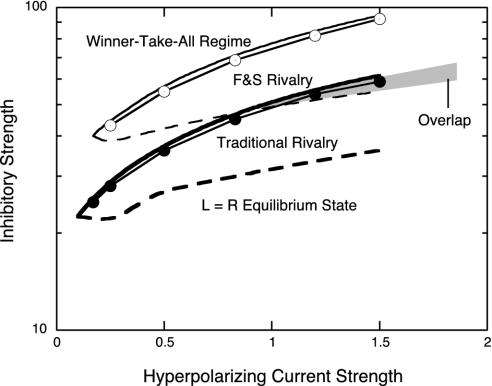
Are two levels of neural competition really necessary to explain these rivalry phenomena? The qualitative answer is simple: because the same form of competition occurs at each stage, the F&S stimulus procedure will defeat this inhibitory competition at the first rivalry stage it encounters. A second stage then must be present with an inhibitory gain g strong enough to produce rivalry with the F&S stimulus. To demonstrate this, a bifurcation diagram was computed for a single-stage rivalry model obeying Eq. 1 so as to determine the regions of parameter space within which the two types of rivalry are possible. This is shown in Fig. 3, where the hyperpolarizing current strength parameter h forms the abscissa and the inhibitory gain g forms the ordinate. The parameter regime within which traditional rivalry occurs is delimited by the heavy solid and dashed lines and the regime for F&S rivalry is delimited by lighter solid and dashed lines. The dashed line for each rivalry type plots a transition to a stable equilibrium with equal responses EL = ER. Similarly, the solid lines plot transitions from rivalry to a ”winner-take-all” regime. It is apparent from Fig. 3 that F&S rivalry requires significantly greater inhibitory strength than traditional rivalry. There is a very small region of overlap where both types of rivalry can coexist, but they have very different temporal characteristics. Whereas traditional rivalry produces dominance durations near 2.4 sec in the overlap region (Fig. 3, filled circles), F&S rivalry produces durations of 0.67 sec. To obtain dominance durations of 2.4 sec in F&S rivalry, inhibitory strength must be increased to the locus of the open circles in Fig. 3. Although one competitive stage is sufficient to account for traditional interocular rivalry, therefore, a second stage with stronger inhibition is required to produce rivalry with comparable dominance durations under the F&S conditions. Experimental data showing comparable dominance durations in both types of rivalry (6) therefore implicate two competitive rivalry stages.
Fig. 3.
Single-level rivalry model bifurcation diagram as a function of the parameters h (hyperpolarizing current strength) and g (inhibitory strength) from Eq. 1. The region of traditional rivalry is enclosed by heavy solid and dashed lines, and the regime of F&S rivalry is demarcated by the lighter solid and dashed lines. Above the solid line for either rivalry type there is a bifurcation to a winner-take-all regime, and below the dashed line there is a bifurcation to an equilibrium state representing equal firing. The locus at which dominance intervals are 2.4 sec is marked by filled circles for traditional rivalry and open circles for F&S rivalry. F&S rivalry clearly requires significantly stronger inhibition than traditional rivalry. Within the small region of overlap (gray), F&S rivalry exhibits extremely short dominance intervals incompatible with the experimental data (see text).
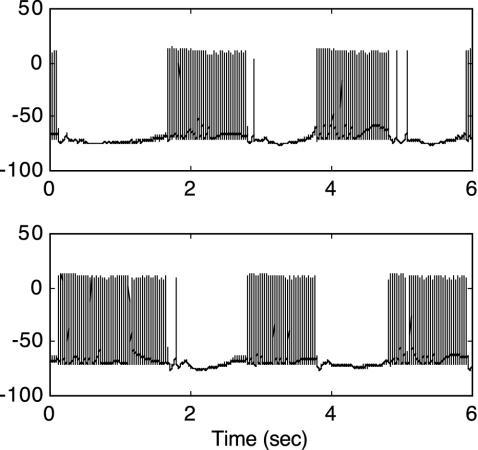
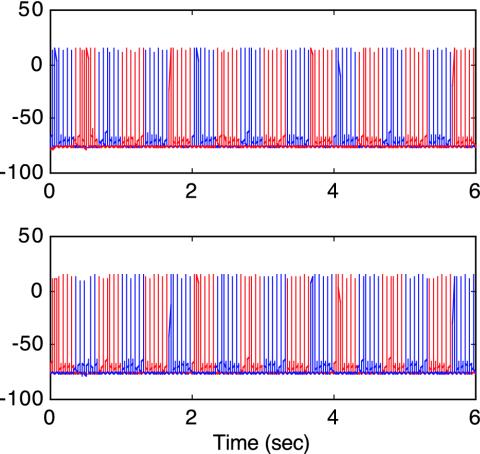
A second issue is whether the defeat of inhibition at the monocular model stage would still be obtained by using conduction dynamics describing individual action potentials rather than the spike-rate formulation in Eq. 1. To answer this question, additional simulations of the monocular model stage were conducted by using a simplified version of a recent rivalry model incorporating Hodgkin-Huxley-type dynamics (13). Simplified conductance-based equations for human neocortical neurons are described by Eq. 2 (19). In response to traditional rivalry stimulation, this spiking model produced rivalry alternations of variable duration as shown in Fig. 4. The variability of dominance durations has been shown to result from neural chaos (13), and a histogram of these durations produced by this spiking model is well fit by a γ distribution of the form t1.86exp(-t/2.23). The F&S stimulus, however, effectively eliminated the competitive inhibition and instead generated stable, simultaneous neural firing at a constant spike rate from the previously rivalrous neurons (see Fig. 5). Nevertheless, a second hierarchic stage with stronger inhibition produced an appropriate gamma distribution of dominance intervals. Thus, the dynamic elimination of early stage rivalry under F&S conditions is evident in action potential dynamics that also generate the characteristic gamma function alternations of traditional rivalry.
Fig. 4.
Action potentials generated by a conductance-based neural model of interocular rivalry competition. The abscissa plots 6.0 sec from an ongoing rivalry simulation in which a model neuron tuned to vertical gratings (Upper) alternates dominance with a competing neuron tuned to horizontal gratings (Lower). The ordinate shows membrane potential in millivolts. Note the effect of spike-frequency adaptation in slowing the firing rate toward the end of each dominance interval. Also note that the individual intervals vary substantially in duration as a result of neural chaos (13).
Fig. 5.
Action potentials of conductance-based model neurons in response to F&S stimulation. Neurons selective for vertical (red) and horizontal (blue) gratings for left (Upper) and right (Lower) monocular neurons are plotted. Ordinate is membrane potential in millivolts. Under these stimulus conditions, inhibitory neurons cannot generate strong enough inhibition to produce rivalry. Instead, both vertical and horizontal monocular signals are simultaneously transmitted to a higher binocular level (data not shown), where stronger inhibition now generates rivalry. Thus, conductance-based neurons produce the same response pattern as the spike-rate neurons depicted in Fig. 2.
Experimental investigation of F&S rivalry shows that it requires both rapid flicker and stimulus swapping between eyes (9). Simulations show that the model also reverts to conventional rivalry driven by the monocular stage when only 18.0-Hz flicker is present without interocular swapping. Similarly, 1.5-Hz interocular swapping with no stimulus flicker results in the reappearance of rivalry at the monocular stage, which causes rapid alternations that are triggered by the interocular swaps. Thus, the neural model also shows that both rapid flicker and interocular swapping are necessary to generate F&S rivalry.
This neural model also can be used to ask how the presence of excitatory feedback from higher binocular neurons to their monocular inputs might alter the resulting dynamics. Extensive simulations of such excitatory feedback in the network described by Eq. 1 yielded one of two results. For sufficiently weak feedback, the neural model performed as it did before except that the dominance intervals were extended from ≈2.4 sec without feedback up to 2.7 sec with feedback. If the feedback strength was increased beyond this, however, the dynamics no longer supported a rivalry oscillation but instead switched to an asymptotically stable steady state in which one monocular view predominated forever at both monocular and binocular model levels. Clearly, therefore, only weak excitatory feedback is compatible with the phenomenology of both traditional and F&S rivalry, and such feedback does not alter the necessity for two rivalry stages.
Discussion
The rivalry model developed here demonstrates that two hierarchic levels of neural competition are required to explain both traditional rivalry and rivalry obtained under F&S stimulus conditions (6). This result is obtained by using either spike-rate or conduction-based dynamics. Two competitive levels are necessary, because recurrent inhibition that generates rivalry with traditional stimuli is weakened by the F&S temporal transients to the point where the first competitive stage can no longer generate rivalry with similar dominance durations. The empirical observation of rivalry by using F&S stimulation (6) thus implicates a second, hierarchic competitive stage. This second stage must have stronger inhibition than the first stage to generate 2.4-sec dominance intervals in response to F&S stimulation. A single stage with strong recurrent inhibition, however, is insufficient, because it functions as a winner-take-all network in response to traditional rivalry stimuli. To summarize, a first competitive stage generates rivalry oscillations in response to traditional rivalry stimuli and drives oscillations in the second stage. The F&S rivalry stimulation defeats the inhibition in the first stage and dynamically weakens second-stage inhibition to the point where the second stage now generates rivalry oscillations.
A signature feature of rivalry is the observation that decreases in stimulus contrast to one eye primarily increase dominance durations for the pattern in the other eye, a phenomenon known as Levelt's second law (21). Dominance durations for the reduced contrast pattern are affected only minimally. Both the spike-rate model described by Eq. 1 and the spiking-neuron model (13) produce dominance durations consistent with Levelt's second law, further validating both as rivalry models.
One possible criticism that might be leveled at the simulations discussed above is that a physiological study of rivalry in macaques found that single neurons with activity that modulated during rivalry almost all received binocular inputs (5). However, the model presented here does not require exclusively monocular inputs at the first stage but only inputs that are biased more strongly toward one eye than the other, that is, neurons from ocular dominance classes 2, 3, 5, or 6 as defined originally by Hubel and Wiesel (22). Furthermore, functional MRI evidence shows that rivalry alternations occur in the cortical representation of the blind spot in human V1, and this region receives only monocular input (3). Although further physiological data will be needed to resolve possible differences between human and macaque data on this issue, there are no major inconsistencies between the model developed here and the available physiology.
The model developed here makes a number of interesting predictions for new experiments on the assumption that the higher binocular stage reflects extrastriate areas in the ventral visual pathway. Mean receptive field size in this pathway increases substantially from area to area (23). Therefore, the model predicts that the maximum stimulus size for unitary rivalry will increase substantially under F&S conditions relative to the size under traditional rivalry conditions as reported (24). A second prediction follows from the observation that rivalry at the monocular level in the model is defeated under F&S conditions. This leads to the consequence that functional MRI experiments should show no rivalry signal in the blind spot under F&S conditions, in stark contrast to blind-spot rivalry observed under traditional rivalry conditions (3). Finally, the model predicts that physiological recordings from V1 neurons under F&S conditions should reflect only the 1.5-Hz pattern orientation switches between eyes.
Binocular rivalry has been a focus recently for many neurophysiologically motivated discussions of consciousness (25, 26). In particular, it has been suggested that if rivalry can be localized to a given cortical area, this area would be a candidate for the physical locus of consciousness. However, the present work indicates that rivalry can arise in different areas contingent on the nature of stimulation, a result that reconciles previous disagreements in the literature (1-9). Thus, it may be more appropriate to begin thinking of consciousness as a characteristic of extended neural circuits comprising several interacting cortical levels throughout the brain.
The simulation results discussed above show that two levels of neural competition are necessary for the explanation of both traditional and F&S rivalry. Although the monocular stage presumably must reside in V1 to account for both functional MRI results (2, 3) and the existence of retinotopically mapped dominance waves in rivalry (4), the binocular stage cannot be localized specifically other than to say that it is higher in the system. In fact, there remains the possibility that neural competition may be a major factor at many levels of cortical vision. Indeed, neural inhibition, believed to reflect competitive interactions in V4, has been invoked to explain perceptual oscillations in the Marroquin illusion (27), and rivalry alternations have also been reported physiologically in macaque V4 (5). Furthermore, a recent computational model of form vision has incorporated neural competition at multiple hierarchic levels (28). If multiple levels of neural competition do indeed constitute a design component of human form vision, it will be a challenge to determine whether new stimulation paradigms, analogous to F&S, might be used to bypass more than one level of competition psychophysically, thereby revealing even higher competitive levels.
Acknowledgments
This research was supported by a grant from Natural Sciences and Engineering Research Council.
This paper was submitted directly (Track II) to the PNAS office.
Abbreviations: V, visual cortex; F&S, 18.0-Hz flicker/1.5-Hz eye switching.
References
- 1.Blake, R. (1989) Psychol. Rev. 96, 145-167. [DOI] [PubMed] [Google Scholar]
- 2.Polonsky, A., Blake, R., Braun, J. & Heeger, D. (2000) Nat. Neurosci. 3, 1153-1159. [DOI] [PubMed] [Google Scholar]
- 3.Tong, F. & Engel, S. A. (2001) Nature 411, 195-199. [DOI] [PubMed] [Google Scholar]
- 4.Wilson, H. R., Blake, R. & Lee, S. H. (2001) Nature 412, 907-910. [DOI] [PubMed] [Google Scholar]
- 5.Leopold, D. A. & Logothetis, N. K. (1996) Nature 379, 549-553. [DOI] [PubMed] [Google Scholar]
- 6.Logothetis, N. K., Leopold, D. A. & Sheinberg, D. L. (1996) Nature 380, 621-624. [DOI] [PubMed] [Google Scholar]
- 7.Kovács, I., Papathomas, T. V., Yang, M. & Fehér, A. (1996) Proc. Natl. Acad. Sci. USA 93, 15508-15511. [DOI] [PMC free article] [PubMed] [Google Scholar]
- 8.Tong, F., Nakayama, K., Vaughan, J. T. & Kanwisher, N. (1998) Neuron 21, 753-759. [DOI] [PubMed] [Google Scholar]
- 9.Lee, S. H. & Blake, R. (1999) Vision Res. 39, 1447-1454. [DOI] [PubMed] [Google Scholar]
- 10.Wolfe, J. M. (1996) Nature 380, 587-588. [DOI] [PubMed] [Google Scholar]
- 11.Sperling, G. (1970) Am. J. Psychol. 83, 461-534. [Google Scholar]
- 12.Lehky, S. (1988) Perception 17, 215-228. [DOI] [PubMed] [Google Scholar]
- 13.Laing, C. R. & Chow, C. C. (2002) J. Comput. Neurosci. 12, 39-53. [DOI] [PubMed] [Google Scholar]
- 14.Wilson, H. R. (1999) Spikes, Decisions, and Actions: Dynamical Foundations of Neuroscience (Oxford Univ. Press, Oxford).
- 15.McCormick, D. A. & Williamson, A. (1989) Proc. Natl. Acad. Sci. USA 86, 8098-8102. [DOI] [PMC free article] [PubMed] [Google Scholar]
- 16.Albrecht, D. G. & Hamilton, D. B. (1982) J. Neurophysiol. 48, 217-237. [DOI] [PubMed] [Google Scholar]
- 17.Sclar, G., Maunsell, J. H. R. & Lennie, P. (1990) Vision Res. 30, 1-10. [DOI] [PubMed] [Google Scholar]
- 18.Connors, B. W. & Gutnick, M. J. (1990) Trends Neurosci. 13, 99-104. [DOI] [PubMed] [Google Scholar]
- 19.Wilson, H. R. (1999) J. Theor. Biol. 200, 375-388. [DOI] [PubMed] [Google Scholar]
- 20.Wolfe, J. M. (1983) Perception 12, 447-456. [DOI] [PubMed] [Google Scholar]
- 21.Levelt, W. J. M. (1965) On Binocular Rivalry (Institute for Perception, Soesterberg, The Netherlands).
- 22.Hubel, D. H. & Wiesel, T. N. (1968) J. Physiol. (London) 195, 215-243. [DOI] [PMC free article] [PubMed] [Google Scholar]
- 23.VanEssen, D. C., Anderson, C. H. & Felleman, D. J. (1992) Science 255, 419-423. [DOI] [PubMed] [Google Scholar]
- 24.Blake, R., O'Shea, R. P. & Mueller, T. J. (1992) Visual Neurosci. 8, 469-478. [DOI] [PubMed] [Google Scholar]
- 25.Crick, F. & Koch, C. (1998) Cereb. Cortex 8, 97-107. [DOI] [PubMed] [Google Scholar]
- 26.Logothetis, N. K. (1998) Philos. Trans. R. Soc. London B 353, 1801-1818. [DOI] [PMC free article] [PubMed] [Google Scholar]
- 27.Wilson, H. R., Krupa, B. & Wilkinson, F. (2000) Nat. Neurosci. 3, 170-176. [DOI] [PubMed] [Google Scholar]
- 28.Reisenhuber, M. & Poggio, T. (1999) Nat. Neurosci. 2, 1019-1025. [DOI] [PubMed] [Google Scholar]


