

Abstract
Uniform spot morphology is of critical importance in the fabrication and successful use of protein arrays, and solution additives are often needed in order to ensure good spot quality. While hydroxyl-bearing molecules such as glycerol have found wide usage, in our experience these reduce the efficiency of probe immobilization (particularly in the context of aldehyde-terminated surfaces). Here, we report a series of non-nucleophilic molecules that can be used as additives in order to improve spot homogeneity in protein arrays. Arrayed Imaging Reflectometry, a label-free optical biosensing technique, has been used along with spectroscopic ellipsometry to test the spot homogeneity, antibody immobilization efficiency, and activity of anti-human IgG arrays prepared with these non-nucleophilic additives on glutaraldehyde surfaces. It has been determined that 0.1% v/v 12-crown-4 has the optimum performance in MPBS buffer.
Introduction
A variety of attachment chemistries have been developed for the covalent immobilization of probe molecules in DNA or protein arrays1,2,3,4. With few exceptions (for example, thiol-mediated attachment to gold5,6 and the Staudinger ligation approach7), the mechanism of surface attachment is the nucleophilic attack on the surface-bound moiety by the probe molecule of interest (i.e. thiol- or amine-terminated oligonucleotide or protein). In the case of protein arrays, solution additives are very often required in order to keep the probe spot hydrated during immobilization8 and to aid in the homogenous distribution of molecules9. This second function of an additive is vital for the removal of “coffee stain” rings10 and bright center spots, which are presumably the result of the physisorption of molecules from the solution's initial contact with the surface. The additives used to date unfortunately contain reactive groups themselves11, such as the hydroxyls on glycerol12, trehalose13, PEG11,14, and many surfactants9,14,15. In the context of developing methodology for preparing antibody arrays for use with our Arrayed Imaging Reflectometry protein detection technique, we observed that glycerol in particular interfered with antibody immobilization on glutaraldehyde-coated surfaces. While the precise structure of surface-immobilized glutaraldehyde is not well understood, solution-phase experiments16 suggest that it is likely polymerized to some extent, providing both saturated and α, β-unsaturated aldehyde functionality for carbonyl- and Michael-addition of reactive amines. Although the reaction of aldehydes with alcohols such as glycerol to form hemiacetals and acetals is reversible, the neutral to slightly basic pH employed for protein immobilization provides enhanced stability for acetals (particularly cyclic), while reducing the rate of imine formation (the desired reaction in this case)17. In fact, we have confirmed via NMR spectroscopy that the concentration of glycerol typically employed in protein spotting solutions efficiently hinders reaction between glutaraldehyde and butylamine (a model amine) in MPBS-d at pH 7.2 (Supporting Information). As the amount of immobilized antibody correlates with assay performance, we set out to examine a suite of non-nucleophilic additives in order to determine those that circumvent competition for surface reactive groups while simultaneously removing surface morphological anomalies.
Typically, protein arrays are used in conjunction with target molecules conjugated with a fluorophore or other reporter element18,19 or as sandwich assays with labeled antibodies. While these methods have yielded valuable data, label-free protein detection techniques have generated considerable interest as alternatives, due to their potential to simplify and improve the accuracy of the assay process. We have previously reported on the development of Arrayed Imaging Reflectometry (AIR), a label-free, optical biosensor20,21. The AIR technique creates a condition of near zero reflectance through an antireflective coating consisting of a thin film of silicon dioxide and covalently linked probe molecules; perturbation of this coating arises through the thickness increase that is concomitant with a biomolecular recognition event. Imaging near a reflectance zero confers a large dynamic range, and, as such, AIR is capable of easily detecting sub-Ångstrom thickness increases. AIR is therefore exceptionally responsive to subtle surface immobilization inhomogeneities, much more so than typical fluorescence-based imaging methods. Through the utilization of AIR, we were able to concurrently investigate the immobilization profiles of a model antibody, anti-human IgG, over a range of additive conditions and concentrations, as well as confirm the activity of the antibody in each additive.
We chose variants of ethylene glycol as the basis set of additives because polyethylene glycols are ubiquitously used in protein crystallography screens (presumably inert with respect to the protein)22,23, and strongly resist adsorption to proteins24. However, since the terminal α- and ω- hydroxyls are nucleophilic, each ethylene glycol derivative was “capped” either by an alkoxy group or via cyclization. DMSO was chosen because it is commonly utilized in small molecule/protein interaction assays25, and at low concentrations, it does not appear to disrupt the structure of most proteins26,27. Triton X-100 and glycerol were used as controls due to their nearly universal use in the preparation of protein arrays.
Experimental Section
Materials
Silicon wafers (n-type, <100>) with ∼ 1400 Å of thermally grown silicon dioxide were obtained from the Rochester Institute of Technology. All experiments were carried out on chips derived from the same batch of wafers. Aminopropyl triethoxysilane (APTES, SigmaAldrich) and glutaraldehyde (50% aqueous solution, Alfa Aesar) were used for chip functionalization. Anti-human IgG was obtained from GeneTex Inc. (GTX 77542), and human IgG was obtained from SigmaAldrich.
The following additives were tested at 1%, 0.1% and 0.01% (v/v unless otherwise stated): 12-crown-4 (SigmaAldrich), 18-crown-6 (w/v, Alfa Aesar), diethyl ether (Fisher Scientific), diglyme (TCI America), DMSO (Fisher Scientific), PEG dimethyl ether 2k (w/v, PEG DME, SigmaAldrich). Glycerol (Mallinckrodt Baker Inc.) at final concentrations of 20%, 2% and 0.2%, and Triton-X 100 (SigmaAldrich) at final concentrations of 0.1%, 0.01% and 0.001% were also tested. Concentrations of glycerol and Triton-X 100 were chosen based on commonly used protocols found in the literature3,9,12,15.
Ellipsometric measurements
For each additive, spectroscopic ellipsometry (J.A. Woollam M2000) was employed to quantify surface thickness increases due to the additive alone, as well as any effect of inhibiting or promoting antibody layer formation. 1 cm × 1 cm chips diced from the wafer were functionalized with glutaraldehyde via an aminosilane linking layer, and the total thickness of the combined base layer of oxide, silane and glutaraldehyde was measured. Thereafter, a 50 μL solution containing either the highest concentration of the additive with 500 μg/mL anti-human IgG or the highest concentration of the additive alone was incubated on the chips for 60 minutes. After the chips were washed with glass-distilled, deionized water (pH 6.0) and dried under a stream of N2, the thickness was again measured in order to quantify the thickness change upon addition of the buffers with/without antibody. An average of three measurements was calculated for every tested solution.
AIR experiments
All chips employed in arrayed experiments were derived from the same wafer. This wafer was diced into 2 cm × 1 cm chips and etched in dilute hydrofluoric acid until the oxide thickness was 1380 Å as measured by spectroscopic ellipsometry. A detailed protocol for chip preparation is provided in the supplementary material. In brief, the oxide layer was functionalized with glutaraldehyde via an aminosilane linking layer. Anti-human IgG was diluted to a final concentration of 500 μg/mL in either MPBS alone or in varying concentrations of additives. Anti-fluorescein was used as the negative control. The proteins were manually arrayed on the aldehyde-functionalized chips. The array was comprised of four differing anti-human IgG conditions: in MPBS alone or MPBS plus 1%, 0.1% or 0.01% of the additive under study; the anti-fluorescein negative control spots were arrayed at a concentration of 300 μg/mL in 0.1% 12-crown-4. Spots corresponding to each condition and to the anti-fluorescein control were arrayed in triplicate. Each spot received 0.5 μL of solution, and had a diameter of about 0.5 mm. After arraying, the chips were incubated for 60 minutes at 4 °C in a modified humidity chamber, followed by blocking in a solution containing 200 μg/mL BSA in HBS. Two chips were made for each additive, with one of them being exposed to only buffer (MPBS-ET), and the other one exposed to target human IgG diluted to 45 μg/mL in MPBS-ET. After being incubated with the target for 60 minutes, the chips were washed and dried. The chips were then mounted onto a benchtop reflectometer21 and imaged at a 30 ms integration time. (For further details of the protocol, see Supporting Information)
Results and Discussion
The chips used for the experiments were imaged obliquely at a fixed angle of ∼70.5°. As we have described in our previous work, the oblique angle of incidence causes the otherwise circular spots to look elliptical in the images. Combined with the relatively large size of the chips (2 cm × 1 cm), this also gave rise to a lack of focal depth over the image, so that a “pillowing” effect was observed as an image artifact for the parts of the array that were not in focus. Therefore, images were acquired by scanning over five different focal planes along the chip surface in order to obtain unambiguous reflectance intensity data for all the spots in the array (Supporting Information). The intensity of each spot was quantified using ImageJ28 and Origin7 (OriginLab), and the intensity change between spots on the control and experimental chip was determined for each of the additives. This reflectance change was normalized with respect to any change observed for the anti-fluorescein control spots.
In order to determine the effect of each additive on spot morphology, an area intensity profile was determined for each spot in the array. For an ideal (uniform) spot, one would expect to see a narrow Gaussian distribution of intensity. Inhomogeneity in the spot causes deviations from this ideal behavior that are readily observable. For example, bright center regions lead to broadening of the intensity profile resulting from the superposition of a lower-intensity spot domain (the outer portion of the spot) with a higher-intensity domain (the bright center region). Bright outer (“coffee stain”) rings have a similar effect. In some cases, we also observed fully saturated or high-intensity pixels. Overall characterization of the spot morphology used this area intensity profile in combination with visual identification of bright center spots (and their area, if present), or outer rings.
Figure 1a depicts representative spots of each kind from an anti-human IgG array and the area intensity profiles derived from a single spot of anti-human IgG in phosphate buffer alone (Figure 1b) versus a spot of anti-human IgG in phosphate buffer with 0.1% v/v 12-crown-4 additive (Figure 1c). The tighter Gaussian profile and the absence of a large number of high intensity pixels make it evident that the presence of the additive creates a more homogenous intensity distribution across the entire area of the spot.
Figure 1.
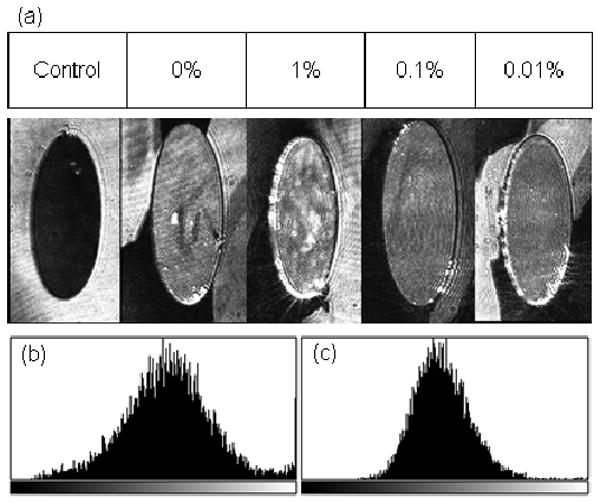
Image of representative spots from an AIR array acquired at a 30 ms exposure time. The array consists of three replicates (only one shown in the figure) of anti-human IgG diluted in various concentrations of 12-crown-4-containing buffer and an anti-fluorescein control (a). Histograms (b) and (c) depict the area intensity profiles of a spot arrayed with MPBS alone and with 0.1% of 12-crown-4, respectively.
Spectroscopic ellipsometry provided information about the extent to which the tested additives inhibit/enhance antibody immobilization on glutaraldehyde surfaces. While none of the additives were found to produce a measurable layer of residue on the surface themselves in the absence of the antibody, an expected result given the post-exposure wash with pH 6.0 water, some of them did have a significant effect on the antibody immobilization (Table 1). In particular, we found that the inclusion of glycerol or Triton X-100 into the spotting buffer greatly inhibited the thickness of the immobilized anti-human IgG layer with respect to buffer alone, showing that these two additives compete with antibody immobilization. On the other hand, 12-crown-4 and diethyl ether helped to slightly increase the thickness of the attached antibody layer. The layer thickness is proportional to the amount of immobilized molecules and in this manner, one of two outcomes may occur: thicker layers accounting for more probe molecules may be available to bind a greater number of target molecules or steric crowding may inhibit binding interactions. This is easily examined using AIR, the results of which are outlined in Table 2.
Table 1.
Average thickness (as measured by spectroscopic ellipsometry) of the additive and the anti-human IgG layers formed by incubating the glutaraldehyde chips with a solution containing either only the additives or 500 μg/mL antibody along with different additives. The standard deviations were calculated from the three chips that were measured for each sample.
| Additive | Additive concentration | Anti-human IgG concentration | Average thickness (Å) | Standard deviation (n=3) |
|---|---|---|---|---|
| MPBS buffer only | NA | 0 | -0.1 | 0.4 |
| Glycerol | 20% | 0 | 0.1 | 0.3 |
| Triton X 100 | 0.1% | 0 | -1.0 | 0.5 |
| 12-crown-4 | 1% | 0 | -0.2 | 0.2 |
| 18-crown-6 | 1% | 0 | 0.0 | 0.3 |
| Diethyl ether | 1% | 0 | -0.4 | 0.2 |
| DMSO | 1% | 0 | -0.5 | 0.1 |
| Diglyme | 1% | 0 | -0.9 | 0.3 |
| PEG DME 2000 | 1% | 0 | -0.3 | 0.1 |
| MPBS buffer only | NA | 500 μg/mL | 32.1 | 0.4 |
| Glycerol | 20% | 500 μg/mL | 18.9 | 1.1 |
| Triton X 100 | 0.1% | 500 μg/mL | 16.0 | 0.3 |
| 12-crown-4 | 1% | 500 μg/mL | 35.0 | 0.4 |
| 18-crown-6 | 1% | 500 μg/mL | 29.2 | 0.3 |
| Diethyl ether | 1% | 500 μg/mL | 34.9 | 0.4 |
| DMSO | 1% | 500 μg/mL | 32.3 | 0.8 |
| Diglyme | 1% | 500 μg/mL | 33.4 | 1.0 |
| PEG DME 2000 | 1% | 500 μg/mL | 32.4 | 0.3 |
Table 2.
Spot morphology and detection performance of anti-human IgG immobilized in the presence of various additives, as evaluated by Arrayed Imaging Reflectometry.
| Additive | Concentration | Outer ring | Average area of central featurea (%) | Average reflectance changeb (%) |
|---|---|---|---|---|
| MPBS | NA | Y | 12.83 | 100 |
| Glycerol | 20% | N | 0.00 | 25.96 |
| 2% | Y | 0.00 | 67.31 | |
| 0.2% | Y | 0.00 | 60.57 | |
| 12-crown-4 | 1% | N | 3.81 | 99.32 |
| 0.1% | N | 0.00 | 82.02 | |
| 0.01% | Y | 14.77 | 72.29 | |
| 18-crown-6 | 1% | Y | 0.00 | 45.34 |
| 0.1% | Y | 16.90 | 87.68 | |
| 0.01% | Y | 38.86 | 55.68 | |
| Diethyl ether | 1% | Y | 0.00 | 92.12 |
| 0.1% | N | 19.00 | 78.91 | |
| 0.01% | Y | 5.03 | 89.34 | |
| DMSO | 1% | Y | 0.00 | 62.59 |
| 0.1% | N | 0.00 | 74.55 | |
| 0.01% | N | 0.00 | 79.64 | |
| Diglyme | 1% | N | 6.41 | 89.60 |
| 0.1% | N | 11.06 | 91.34 | |
| 0.01% | N | 3.43 | 98.67 | |
| PEG DME | 1% | NAc | NAc | NAc |
| 0.1% | N | 20.98 | 87.15 | |
| 0.01% | N | 24.77 | 89.2 |
The average central feature area is the percentage of the total spot that is accounted for by the bright center spots.
The average reflectance change was computed from the reflectance change values of each of three spots of a kind on the chip, and corresponds to the spot intensity change after the array was incubated with the human IgG target solution; the changes are normalized to the MPBS standard, and quantified as percent active. Averages have been calculated for three spots.
The 1% PEG-DME spots were not analyzable due to a large amount of scattered intensity observed in the spots.
Thus, most of the additives tested could successfully remove the bright rings usually observed on the periphery of protein spots, but only a few could remove the bright central feature. Triton-X 100 could not be used for the AIR experiments as the hand-arrayed spots containing the detergent coalesced during the course of the experiment. While 20% glycerol was found to have good overall spot morphology, the average reflectance change upon target addition was largely compromised due to a smaller amount of immobilized antibody, consistent with the ellipsometric results. 1% diethyl ether could entirely ablate the bright central feature, and preserve antibody activity during immobilization; however, it could not remove the bright outer rings in the spots (Supporting Information). 0.1% v/v 12-crown-4 and 0.1% v/v DMSO had comparable performance, but owing to slightly better antibody activity, 0.1% 12-crown-4 in MPBS was determined to be the best arraying buffer amongst the ones tested on the basis of its ability to remove morphological anomalies, non-competition during antibody immobilization and preservation of the antibody activity on the chip.
Conclusion
We have identified several new non-nucleophilic substances that can be used as additives in protein arrays in order to improve spot morphology, and do not interfere with protein immobilization and protein activity on the surface. The inert nature of these additives makes them potentially suitable for use with any kind of attachment chemistry. While several of the additives tested had good performance, 0.1% v/v 12-crown-4 has the best observed combination of morphology and antibody activity. Although this study was carried out with large spots (0.5 μL volume, ∼0.5 mm diameter), the morphological inhomogeneity issues addressed herein are also common in antibody or protein microarrays3,9, and hence the use of these additives could be extended to microarrayed spots. The use of these additives produces a clear, measurable improvement in the performance of AIR protein-detection chips, and we anticipate that these results will readily extend to any sensor for which covalent attachment of the probe molecule to a chip surface is required.
Supplementary Material
Acknowledgments
We thank Dr. Christopher Striemer for numerous helpful discussions. We also thank the University of Rochester Human Immunology Center (NIH Grant R24-AL054953) and the Elon Huntington Hooker Fellowship (for CRM) for financial support for this research. This publication was also made possible by the Clinical and Translational Sciences Award of The University of Rochester, Grant Number UL1 RR024160 from the National Center for Research Resources (NCRR), National Institutes of Health (NIH), and NIH Roadmap for Medicinal Research. Its contents are solely the responsibility of the authors and do not necessarily represent the official view of the NCRR or NIH.
Footnotes
Supporting Information available: Detailed surface attachment chemistry protocol, chip imaging and array analysis methods, ellipsometric measurements and full table of additives data.
References
- 1.Guo Z, Guilfoyle RA, Thiel AJ, Wang R, Smith LM. Nucleic Acid Res. 1994;22:5456–5465. doi: 10.1093/nar/22.24.5456. [DOI] [PMC free article] [PubMed] [Google Scholar]
- 2.Tomizaki K, Usuim K, Mihara H. ChemBioChem. 2005;6:782–799. doi: 10.1002/cbic.200400232. [DOI] [PubMed] [Google Scholar]
- 3.MacBeath G, Schreiber SL. Science. 2000;289:1760–1763. doi: 10.1126/science.289.5485.1760. [DOI] [PubMed] [Google Scholar]
- 4.Li Y, Reichert WM. Langmuir. 2003;19:1557–1566. [Google Scholar]
- 5.Bain CD, Troughton EB, Tao YT, Evall J, Whitesides GM, Nuzzo RG. JACS. 1989;111:321–335. [Google Scholar]
- 6.Nuzzo RG, Dubois LH, Allara DL. JACS. 1990;112:558–569. [Google Scholar]
- 7.Soellner MB, Dickson KA, Nilsson BL, Raines RT. J Am Chem Soc. 2003;125:11790–11791. doi: 10.1021/ja036712h. [DOI] [PubMed] [Google Scholar]
- 8.Wang A, Lee J, Cossins AR, Brust M. Anal Chem. 2005;77:5770–5774. doi: 10.1021/ac050679v. [DOI] [PubMed] [Google Scholar]
- 9.Deng Y, Zhu XY, Kienlen T, Guo A. J Am Chem Soc. 2006;128:2768–2769. doi: 10.1021/ja057669w. [DOI] [PubMed] [Google Scholar]
- 10.Deegan RD, Bakajin O, Dupont TF, Huber G, Nagel SR, Witten TA. Nature. 1997;389:827–829. doi: 10.1103/physreve.62.756. [DOI] [PubMed] [Google Scholar]
- 11.Wu P, Grainger DW. J Proteome Res. 2006;5:2956–2965. doi: 10.1021/pr060217d. [DOI] [PMC free article] [PubMed] [Google Scholar]
- 12.Olle EW, Messamore J, Deogracias MP, McClintock SD, Anderson TD, Johnson KJ. Exp Mol Pathol. 2005;79:206–209. doi: 10.1016/j.yexmp.2005.09.003. [DOI] [PubMed] [Google Scholar]
- 13.Kusnezow W, Jacob A, Walijew A, Diehl F, Hoheisel JD. Proteomics. 2003;3:254–264. doi: 10.1002/pmic.200390038. [DOI] [PubMed] [Google Scholar]
- 14.Wu P, Hogrebe P, Grainger DW. Biosensors and Bioelectronics. 2006;21:1252–1263. doi: 10.1016/j.bios.2005.05.010. [DOI] [PubMed] [Google Scholar]
- 15.Liu Y, Li CM, Yu L, Chen P. Frontiers in Bioscience. 2007;12:3768–3773. doi: 10.2741/2350. [DOI] [PubMed] [Google Scholar]
- 16.Migneault I, Dartiguenave C, Bertrand MJ, Waldron KC. BioTechniques. 2004;37:790–802. doi: 10.2144/04375RV01. [DOI] [PubMed] [Google Scholar]
- 17.Jencks WP. J Am Chem Soc. 1959;81:475–481. [Google Scholar]
- 18.MacBeath G. Nat Genet. 2002;32 2:526–532. doi: 10.1038/ng1037. [DOI] [PubMed] [Google Scholar]
- 19.Boutell JM, Hart DJ, Godber BLJ, Kozlowski RZ, Blackburn JM. Proteomics. 2004;4:1950–1958. doi: 10.1002/pmic.200300722. [DOI] [PubMed] [Google Scholar]
- 20.Lu J, Strohsahl CM, Miller BL, Rothberg LJ. Anal Chem. 2004;76:4416–4420. doi: 10.1021/ac0499165. [DOI] [PubMed] [Google Scholar]
- 21.Mace CR, Striemer CC, Miller BL. Anal Chem. 2006;78:5578–5583. doi: 10.1021/ac060473+. [DOI] [PubMed] [Google Scholar]
- 22.Radaev S, Lin S, Sun PD. Acta Cryst. 2006;D62:605–612. doi: 10.1107/S0907444906011735. [DOI] [PubMed] [Google Scholar]
- 23.McPherson A. J Biol Chem. 1976;251:6300–6303. [PubMed] [Google Scholar]
- 24.Ostuni E, Chapman RG, Holmlin RE, Takayama S, Whitesides GM. Langmuir. 2001;17:5605–5620. doi: 10.1021/la0015258. [DOI] [PubMed] [Google Scholar]
- 25.Comley J. High Throughput-Screening in Drug Discovery. In: Hüser J, editor. Methods and Principles in Medicinal Chemistry. Vol. 35. WILEY-VCH Verlag GmbH and Co.; Weinheim, Germany: 2006. pp. 50–51. [Google Scholar]
- 26.Tjernberg A, Markova N, Griffiths WJ, Hallén D. J Biomol Screen. 2006;11:131–137. doi: 10.1177/1087057105284218. [DOI] [PubMed] [Google Scholar]
- 27.Bhattacharjya S, Balaram P. Protein Struct Func Genet. 1997;29:492–507. doi: 10.1002/(sici)1097-0134(199712)29:4<492::aid-prot9>3.0.co;2-a. [DOI] [PubMed] [Google Scholar]
- 28.Abramoff MD, Magelhaes PJ, Ram SJ. Biophotonics International. 2004;11:36–42. [Google Scholar]
Associated Data
This section collects any data citations, data availability statements, or supplementary materials included in this article.