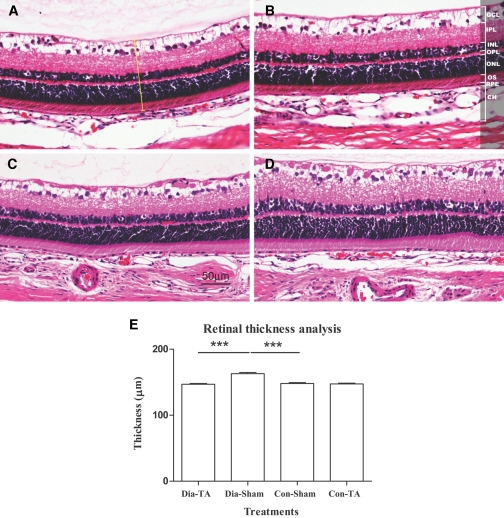
FIG. 3.
Retinal thickness was measured on H&E-stained sections at the similar location. The micrograph shows representative samples from IVTA-treated nondiabetic retina (A), sham-treated nondiabetic retina (B), IVTA-treated diabetic retina (C), and sham-treated diabetic retina (D). The yellow bar in A demonstrates one measurement of retinal thickness. E: Table showing mean (± SEM) retinal thickness (*** P < 0.001). Original magnifications ×200. GCL, ganglion cell layer; IPL, inner plexiform layer; INL, inner nuclear layer; OPL, outer plexiform layer; ONL, outer nuclear layer; RPE, retinal pigment epithelium layer; OS, inner and outer photoreceptor segment; CH, choroidal layer. To view a high-quality digital representation of this image, go to http://dx.doi.org/db07-0982.

