

Abstract
Esophageal cancer is a frequently fatal malignancy, and is described in certain regions in Northeast India with an incidence of esophageal squamous cell carcinoma is many fold higher than the rest of the population. The population in Northeast India is at higher risk due to poor nutritional status, consumption of fermented betel quid and other oral tobacco products besides smoking and alcohol intake. Cytokeratins are the major constituents of the esophageal epithelium and may show gain or loss of cytokeratins as the cancer progresses from normal epithelium to invasive phenotype. In the present study we studied the immunohistochemical expression of five cytokeratins (CK4, CK5, CK8, CK14, and CK17) in the normal esophageal epithelium and esophageal squamous cell carcinoma from both the general population and the high-risk population of Assam in Northeast India. The cytokeratin expression profile was similar to other published data in general. Further analysis demonstrated differences in cytokeratin expression between the general and the high-risk tumor samples. CK5 and CK 8 expression altered in the high-risk population. The significance of these differences is unclear, but suggests a connection to the etiological factors.
Keywords: Cytokeratins, esophageal cancer, high-risk, immunohistochemistry, squamous cell carcinoma, tissue microarray
Introduction
Esophageal cancer is a frequently fatal malignancy known to occur in very high frequencies in certain parts of the world such as Northern China, Iran, South Africa, and India with up to 50-fold difference has been observed between high-risk and low risk populations.1, 2 The highest incidence of cancer of the esophagus in India has been reported from Assam in the North-east region, where it is the second leading cancer in men and third leading cancer in women.3 The age adjusted incidence rates (AAR) per 100,000 persons for males and females (in parenthesis) from the high-risk region of Assam in Northeast India have been reported to be 32.6 and 21.1 in the district of Kamrup and 15.7 and 8.1 in th district of Dibrugarh as compared to AAR of 4.7 and 3.1 in Delhi.4 Besides smoking and alcohol consumption that are the major risk factors for developing esophageal cancer, association of poor nutritional status and dietary habbits such as consumption of unconventional smokeless forms of tobacco, chewing betel quid and consuming fermented preserved food predispose the people from this region with higher mortality rates.5
Since cytokeratin (CK) are the major constituent of the esophageal epithelium and esophageal squamous cell carcinoma (ESCC) is the predominant histological subtype of esophageal cancer in India, we chose to study the immunohistochemical expression of those keratins that had shown differential gene expression on microarray (unpublished data) in the high-risk population of Northeast India. The objective of the present study was to ascertain whether there was any inter-relationship of CK expression between the normal epithelium and ESCC between high-risk population and the general (low risk) population of Delhi which may have potential for classifying ESCC in these population groups.
Material and Methods
Patients and samples
Written informed consent was obtained from the patients to use these samples for research and ethical clearance was obtained for this study from the institutional ethical committee of Institute of Pathology, Indian Council of Medical Research.
The present study was performed on 125 formalin-fixed, paraffin-embedded (FFPE) tissue specimens obtained by endoscopic biopsy of normal esophageal epithelium and ESCC cases received during the period January 2006-July 2007. Of these, 85 comprised of ESCC obtained from BBCI Cancer Institute, Guwahati belonging to the high-risk population of North-east India, 25 biopsies of ESCC from low-risk general population of Delhi, and 15 endoscopic biopsies from normal esophageal mucosa taken from a distant site of ESCC cases from high-risk patients as control. Hematoxylin-eosin stained slides of all these samples were reviewed by two pathologists (AS and SMH) and graded into well, moderately and poorly differentiated ESCC.
Tissue microarray construction
A TMA was constructed from FFPE blocks of 125 tissue samples that included 15 controls, 25 ESCC from low-risk population of Delhi, and 85 ESCC from high-risk population. Sampling sites were marked on the donor blocks and the tissue cylinders precisely arrayed into two recipient blocks each with a core size of 1.5 mm using a manual tissue microarrayer (Beecher Instruments, Silver Spring, MD, USA). The recipient blocks were tempered at 37°C overnight. A TMA section was stained with hematoxylin-eosin for quality assurance and confirmation of diagnostic elements on the TMA.
Immunohistochemistry
The LSAB+ detection system (Dako, Carpinteria CA) was employed for immunohistochemical staining. Briefly, 5-μ sections were cut from TMA blocks, deparaffnized in xylene and rehydrated in graded alcohol. Heating the sections immersed in 0.01 M sodium citrate buffer in a steamer for 20 minutes performed antigen retrieval. After bringing the sections to room temperature the sections were incubated with 3% hydrogen peroxide for 10 minutes to block endogenous peroxidase activity. The primary antibodies used were CK4 (1:100, Clone 6B10, Novocastra laboratories, Norwell, MA), CK5 (1:100, Clone EP1601Y, Abcam Inc, USA), CK8 (prediluted, Clone 35 βH11, Dako,), CK14 (1:100, Clone LL002, NeoMarkers, Fremont, CA) and CK17 (1:20, Clone E3, Dako). 3, 3′- diaminobenzidine was used as the chromogen and sections were counterstained with hematoxylin.
Evaluation of Immunohistochemistry
The TMA sections were screened and scored by two pathologists (AS, SMH) who independently evaluated the immunohistochemical staining and reached a consensus. An adequate core was defined as one in which the tumor occupied more than 50% of the core area.
Out of 125 cores, 114 cores were found suitable for evaluation due to loss of cores, inadequate tumor or insufficient immunohistochemical staining. The cytoplasmic staining was considered positive staining for all the CKs. The distribution of positive staining (X) was scored as percentage of cells labeled by counting individual tumor cells under 40x objective using an eyepiece pinhole and then graded as 0= no staining, 1= upto 30%, 2=31%-60% and 3= more than 60%. As immunohistochemical staining intensity in the cores was not uniform, the intensity of staining (Y) was graded as 0=no staining, 1= mild, 2=moderate and 3=strong. The final score (X × Y) was the multiplication of distribution score by intensity score, generating scores over a range of 0 to 9. The immunoexpression was divided into two groups based on the final score as underexpressed (score below 6) and as overexpressed (score of 6 and above)
Statistical analysis
Pearson's Chi-square tests with SPSS 13.0 for Windows (SPSS Chicago, IL, USA) were performed to compare the expression of the cytokeratin proteins among the control, low risk and high-risk population samples. P value of less than 0.05 was considered statistically significant.
Results
Of the 100 ESCC patients from both groups, 86% were male and 14% were female with a median age of 56.4 years (range: 39-85). ESCC cases were further subdivided into well differentiated (n=22), moderately differentiated (n=66) and poorly differentiated (n=12). Immunohistochemical staining for CKs showed cytoplasmic as demonstrated in Figure 1. The normal esophageal epithelium was taken as baseline in which CK4, CK5, CK8 and CK17 stained the stratified squamous epithelium in different patterns and intensities, while CK14 showed staining of only the basal cells. Detailed distributions of staining for the individual CKs are summarized in Table 1.
Figure 1. TMA cores showing cytokeratin staining pattern.
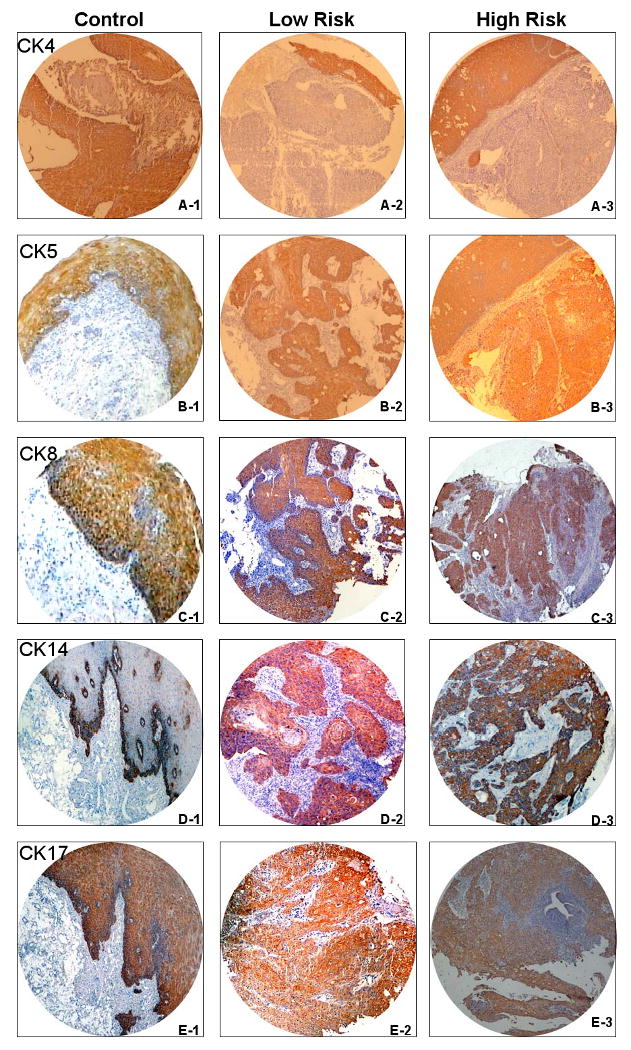
CK4:(A1:normal;A2: low-risk; A3: high-risk),CK5:(B1:normal,B2:low-risk;B3:high-risk),CK8: C1:normal;C2:low-risk;C3:high-risk,CK14:D1:normal;D2:low-risk;D3: high-risk, CK17:(E1:normal; E2:low-risk;E3: high-risk,(×100)
Table 1.
Immunohistochemical staining pattern of cytokeratins
| Cytokeratins | Distribution (%) | Intensity (%) | ||||||
|---|---|---|---|---|---|---|---|---|
| 0: No Stain, 1: Up to 35%, 2: 36-65, 3: >65 | 0: No Stain, 1: Mild, 2: Moderate, 3: Strong | |||||||
| Grade (X) |
Control n=14 |
Low Risk n=19 |
High Risk n= 81 |
Grade (Y) |
Control n=14 |
Low Risk n=19 |
High Risk n=81 |
|
| CK4 | 0 | 0/14 (0.0) | 14/19(73.7) | 52/81(64.2) | 0 | 0/14 (0.0) | 0/19 (0.0) | 54/81(66.7) |
| 1 | 0/14 (0.0) | 1/19(5.3) | 28/81(34.6) | 1 | 0/14 (0.0) | 4/19(21) | 27/81(33.3) | |
| 2 | 0/14 (0.0) | 1/19(5.3) | 1/81(1.2) | 2 | 1/14(7.1) | 8/19(42.1) | 0/81(0.0) | |
| 3 | 14/14(100) | 3/19(15.8) | 0/81 (0.0) | 3 | 13/14(92.9) | 7/19(36.8) | 0/81(75.3) | |
| CK5 | 0 | 0/14 (0.0) | 0/19 (0.0) | 2/81(2.5) | 0 | 0/14 (0.0) | 0/19 (0.0) | 2/81(2.5) |
| 1 | 0/14 (0.0) | 4/19(21.1) | 6/81(7.4) | 1 | 0/14 (0.0) | 5/19(26.3) | 5/81(6.2) | |
| 2 | 1/14(7.1) | 8/19(42.1) | 12/81(14.8) | 2 | 3/14(21.4) | 9/19(47.4) | 20/81(24.7) | |
| 3 | 13/14(92.9) | 7/19(36.8) | 61/81(75.3) | 3 | 11/14(78.6) | 5/19(26.3) | 54/81(66.7) | |
| CK8 | 0 | 0/14 (0.0) | 4/19(21.1) | 3/81(3.7) | 0 | 0/14 (0.0) | 4/19(21.1) | 3/81(3.7) |
| 1 | 0/14 (0.0) | 6/19(31.6) | 6/81(7.4) | 1 | 0/14 (0.0) | 3/19(15.8) | 8/81(9.9) | |
| 2 | 0/14 (0.0) | 4/19(21.1) | 13/81(16) | 2 | 0/14 (0.0) | 7/19(36.8) | 7/81(8.6) | |
| 3 | 14/14(100) | 5/19(26.3) | 59/81(72.8) | 3 | 14/14(100) | 5/19(26.3) | 63/81(77.8) | |
| CK14 | 0 | 0/14 (0.0) | 0/19 (0.0) | 3/81(3.7) | 0 | 0/14 (0.0) | 0/19 (0.0) | 3/81(3.7) |
| 1 | 12/14(85.7) | 3/19(15.8) | 11/81(13.6) | 1 | 0/14 (0.0) | 2/19(10.5) | 2/81(2.5) | |
| 2 | 1/14(7.1) | 7/19(36.8) | 33/81(40.7) | 2 | 3/14(21.4) | 7/19(36.8) | 6/81(7.4) | |
| 3 | 1/14(7.1) | 9/19(47.4) | 34/81(42) | 3 | 11/14(78.6) | 10/19(52.6) | 70/81(86.4) | |
| CK17 | 0 | 0/14 (0.0) | 1/19(5.3) | 3/81(3.7) | 0 | 0/14 (0.0) | 1/19(5.3) | 3/81(3.7) |
| 1 | 0/14 (0.0) | 1/19(5.3) | 8/81(9.9) | 1 | 0/14 (0.0) | 2/19(10.5) | 2/81(2.5) | |
| 2 | 0/14 (0.0) | 4/19(35.7) | 19/81(23.5) | 2 | 5/14(35.7) | 5/19(26.3) | 16/81(19.7) | |
| 3 | 14/14(100) | 13/19(68.4) | 51/81(63) | 3 | 9/14(64.3) | 11/19(57.9) | 60/81(74.1) | |
Utilizing a dichotomization, based on a scoring index of 6, CK4 expression was identical in tumors from the low and high risk groups, staining 0/19 and 0/81 respectively compared to the normal epithelium of the controls(n=14) which were all. positive (Table 2). Cytokeratin 5 expression was also present in the normal epithelium of all of the controls, but only 7/19 (36.8%) of the tumors from the low risk population compared to 65/81 (80.3%) of the tumors n the high risk population. The difference in expression in tumors between low and high risk populations was statistically significant, p<0.001. Staining for CK8 showed a similar pattern, present in the normal epithelium of all control patients, but 7/19 (36.0 %) of tumors from patients in the low risk population and 68/81 (84%) of tumors from the high risk population, resulting in a p value of p<0.001 between low and high risk populations. CK14 expression was limited to the normal epithelium of 1/14 (7.2%) patients in the control population, but was detectable in 12/19 (63.%) and 65/81 (80.3%) of tumors from low and high risk populations respectively.
Table 2.
Immunohistochemical Expression pattern of cytokeratins
| Cytokeratins | Score | Control (%) (n=14) | Low Risk (%) (n=19) | High Risk (%) (n=81) | P Value* | ||
|---|---|---|---|---|---|---|---|
| Pa | Pb | Pc | |||||
| CK4 | <6 | 0 | 19/19(100) | 81/81(100) | <0.001 | <0.001 | Not Computable |
| >6 | 14/14(100) | 0 | 0 | ||||
| CK5 | <6 | 0 | 12/19(63.2) | 16/81(19.7) | <0.001 | 0.06 | <0.001 |
| >6 | 14/14(100) | 7/19(36.8) | 65/81(80.3) | ||||
| CK8 | <6 | 0 | 12/19(63.2) | 13/81(16) | <0.001 | 0.107 | <0.001 |
| >6 | 14/14(100) | 7/19(36.8) | 68/81(84%) | ||||
| Ck14 | <6 | 13/14(92.8) | 7/19(36.8) | 16/81(19.7) | 0.001 | <0.001 | 0.197 |
| >6 | 1/14(7.2) | 12/19(63.2) | 65/81(80.3) | ||||
| CK17 | <6 | 0 | 4/19(21.1) | 12/81(14.8) | 0.067 | 0.123 | 0.5 |
| >6 | 14/14(100) | 15/19(78.9) | 69/81(85.2) | ||||
Pa= Control versus Low Risk,
Pb= Control versus High risk,
Pc=Low risk versus High Risk
Cytokeratin 17 expression was found in the normal epithelium of all the normal controls, but was limited to 15/19 (78.9%) and 69/81(85.2%) of tumors from low and high risk populations respectively. Detailed analysis failed to demonstrate a statistically significant correlation between age, sex and histological grade of ESCC between high and low risk groups. Further analysis failed to demonstrate statistical significance of differentiation and staining for the individual CKs (Table 3).
Table 3.
Cytokeratin expression in relation to histological grade
| Score | Grade | Cytokeratins | ||||||||||||||
|---|---|---|---|---|---|---|---|---|---|---|---|---|---|---|---|---|
| CK4 | CK5 | CK8 | CK14 | CK17 | ||||||||||||
| LR (%) |
HR (%) |
P | LR (%) |
HR (%) |
P | LR (%) |
HR (%) |
P | LR (%) |
HR (%) |
P | LR (%) |
HR (%) |
P | ||
| <6 | Well | 3/22 | 19/22 | Not comp | 2/7 | 5/7 | 0.163 | 2/5 | 3/5 | 0.051 | 0 | 3/3 | 0.459 | 0 | 3/3 | 0.459 |
| Differentiated | (13.6) | (86.4) | (28.5) | (71.4) | (40) | (60) | (100) | (100) | ||||||||
| Moderately | 14/66 | 52/66 | 8/13 | 5/13 | <0.001 | 9/17 | 8/17 | <0.001 | 5/16 | 11/16 | 0.259 | 3/10 | 7/10 | 0.461 | ||
| Differentiated | (13.6) | (78.8) | (61.5) | (38.4) | (53) | (47) | (31.2) | (68.8) | (30) | (70) | ||||||
| Poor | 2/12 | 10/12 | 2/8 | 6/8 | 0.273 | 1/3 | 2/3 | 0.371 | 2/4 | 2/4 | 0.028 | 1/3 | 2/3 | 0.371 | ||
| Differentiated | (16.7) | (83.3) | (25.0) | (75.0) | (33.3) | (66.6) | (50) | (50) | (33.3) | (66.6) | ||||||
| ≥6 | Well | 0 | 0 | 1/15 | 14/15 | 1/17 | 16/17 | 3/19 | 16/19 | 3/19 | 16/19 | |||||
| Differentiated | (6.7) | (93.3) | (5.9) | (94.1) | (15.8) | (84.2) | (15.8) | (84.2) | ||||||||
| Moderately | 0 | 0 | 6/53 | 47/53 | 5/49 | 44/49 | 9/50 | 41/50 | 11/56 | 45/56 | ||||||
| Differentiated | (11.4) | (88.6) | (10.2) | (89.8) | (18) | (82) | (19.6) | (80.4) | ||||||||
| Poor | 0 | 0 | 4/4 | 1/9 | 8/9 | 0 | 8/8 | 1/9 | 8/9 | |||||||
| Differentiated | 0 | (100) | (11.2) | (88.8) | (100) | (11.2) | (88.8) | |||||||||
Discussion
CKs are a family of about 30 different related cytoplasmic proteins encoded by multiple genes and constitute the intermediate filaments that are incorporated into the cytoskeleton of almost all epithelial cells. The epithelial or soft keratins (CK1-CK 20) are divided into two subfamilies, Type I (acidic, CK9-CK20) and Type II (basic, CK1- CK8) depending on their molecular weights and isoelectric point.6 These keratin polypeptides are the product of different genes and are expressed in different cells at different stages of development and differentiation.7 Carcinoma cells retain an ability to produce the CKs of their progenitor cells and may also gain an ability to develop new types of intermediate filaments.8,9 Therefore CK subtypes have potential to be useful biomarkers for studying the evolution of cancer in different stages and differentiation states.
CKs are the major constituents of the normal esophageal epithelium and epithelial cancer. In past, several reports 10-13 have shown alterations in the CK protein expression in the normal esophageal epithelium in comparison to ESCC, however these studies were based on western blot analyses and were not possible to relate keratin expression to specified cell populations or different states of cell differentiation. Chung et al14 were able to demonstrate reduction of CK4 and CK14 in the transition from normal epithelium to invasive tumor in a small number of cases. Vianne et al 15 studied the relationship between morphologic characteristics and in situ hybridization for CK-mRNAs and demonstrated that changes in CK expression occur with differences in malignant potential in the esophageal squamous epithelium. In their CK-mRNA expression they showed that in well-differentiated ESCC, CK 6, CK14 were abundantly expressed while CK4, CK13 were only focally expressed and were in contrast to the normal epithelium. In the moderately differentiated ESCC CK 6, CK14, CK19 were detected while in the poorly differentiated ESCC none of these were detected.
With the availability of monoclonal antibodies for small subsets of keratin polypeptides it was important to know what components of esophageal cells were related to cell differentiation and the need for indicators other than morphological parameters in evaluating precursor lesions, prognosis and therapeutic intervention and was a challenge for researchers. Yang and Lipkin 16 were the first to study CK immunoexpression using AE1 antibody and concluded that there were 3 patterns of CK expression that paralleled the degree of differentiation. Type 1 pattern was present in well-differentiated ESCC while Type 2 and 3 were seen in poorly differentiated and undifferentiated carcinomas. In dysplasia and carcinoma in situ abnormal cells had reaction patterns in which they lost or increased AE1 expression suggesting that AE1 could be used as a biomarker for identifying early aberrations in the esophageal epithelium.
In another study, Takahashi et al 17 reported that neoplastic epithelial cells showed different keratin reactivity and distribution compared to normal esophageal epithelium. CK 17 was limited only to the keratinized cells while CK14 selectively labeled the basal cells of the normal esophageal epithelium and all the ESCC cells and adjacent carcinoma in situ. Itakura et al 18 studied esophageal dysplasia both from cancer and cancer-free patients using antibodies to CK10/13 and CK 14 and concluded that abnormal patterns of CK expression occur not only in atypical cells but also in non-atypical cells in esophageal squamous dysplasia. Lam et al 19 studied 35 cases of ESCC and reported that CK18, 19 are overexpressed in ESCC while expression of CK10 is seen in well differentiated ESCC and not in normal epithelium. Cintorino et al 20 suggested from their study on ESCC in high-risk population of China that significant differences in expression of CK8, 18, and CK19 were seen between lymph node positive and lymph node negative ESCC and the pattern of distribution of these CKs could be of predictive value. More recently, Xue et al 21 studied 205 ESCC and 173 precursor lesions and found that CK14 were positive only in basal layer of normal whereas diffusely positive in ESCC and this overexpression occurred in intermediate stage of carcinogenesis between dysplasia to carcinoma in situ and carcinoma whereas the underexpression of CK4 in the ESCC was an early event occurring in the mild to moderate dysplasia stage and suggests malignant transformation in this cancer.
In the present study we compared the CK expression of CK4, 5, 8, 14, 17 between normal esophageal epithelium and ESCC and then between the low risk and high risk populations. We found that CK4 under-expression (P<0.001), and the over-expression of CK5 (P<0.001), CK8 (P<0.001) and CK14 (P=0.001) were useful in differentiating normal epithelium from cancer in the general population while CK4 underexpression (P<0.001) and CK14overexpression (P<0.001) were useful to differentiate normal epithelium from ESCC in the high-risk population. This finding provides some insights into the alterations in CK expression encountered with malignant transformation. The findings of CK4 under-expression and CK5, CK8, CK14 over-expression were in concordance with previously published reports.
Cytokeratin 8 is expressed in a wide variety of “simple epithelial cells”.22 Cytokeratin 4 is expressed in stratified and columnar epithelium, and typically absent from the basal cells that give rise to these epithelial layers.22 In contrast CK 5 and CK14 are expressed in the basal layer of squamous epithelium, and not expressed in the stratified elements. With reference to the diffferential expression between the low and high risk groups, the relationships of the cytokeratins are less clear. CK8 is described as focally expressed in squamous cell carcinomas, possibly with greater expression in poorly differentiated cases. CK5 is associated with basal or myo-epithelial phenotype, and is noted to be expressed in small cell carcinomas of the lung. 22 The greater level of expression of CK5 and CK8 in the high-risk group may suggest a connection with a basal/small cell phenotype of tumor, which would be concordant with a more poorly differentiated phenotype.
More interestingly, our analysis shows that CK5 is more commonly expressed in the esophageal tumors of patients from the high risk cohort compared to the low risk cohort. (P<0.001). Additionally CK8 was also expressed more commonly in the tumors of patients from the high risk cohort than the low risk cohort (P<0.001). As a result CK5 and CK8 expression did not decrease with malignant transformation in the high risk cohort, compared to the low risk cohort. These changes were independent of differentation state of the tumor. To our knowledge this is the first example of detection of differences in cytokeratin expression, measured by immunohistochemistry that can be correlated to high-risk groups, attributed to tobacco use or diet. Examination of dysplastic or in situ lesions may yield a greater understanding of the significance of these changes in cytokeratin expression.
In conclusion, the findings from this study suggest that CK5 and CK 8 may be useful markers in separating high-risk from low risk population groups and detection of changes in the expression of these gene products may be able to shed some light on identification of biomarkers that can help early diagnosis and may help stratify populations at low or high risk.
Acknowledgments
The authors acknowledge the help of Mr. Kris Ylaya, for technical support in TMA construction. Financial support to Avninder Singh was in the form of an ICRETT technology transfer fellowship from the UICC (International Union against Cancer). This research was supported in part by the Intramural Research Program of the NIH, National Cancer Institute, Center for Cancer Research.
Source of support: Financial support for to Avninder Singh for the ICRETT technology transfer fellowship UICC (International Union against Cancer). This research was supported in part by the Intramural Research Program of the NIH, National Cancer Institute, Center for Cancer Research.
Contributor Information
Avninder Singh, Email: dravninder@yahoo.co.in, Institute of Pathology, Indian Council of Medical Research, New Delhi, India.
Sujala Kapur, Email: sujalakapur@yahoo.com, Institute of Pathology, Indian Council of Medical Research, New Delhi, India.
Indranil Chattopadhyay, Email: indranil_ch@yahoo.com, Institute of Pathology, Indian Council of Medical Research, New Delhi, India.
Joydeep Purkayastha, Email: drjoydeep@indiatimes.com, B. Borooah Cancer Institute, Guwahati, Assam, India.
Jagannath Sharma, Email: jsharma@rediffmail.com, B. Borooah Cancer Institute, Guwahati, Assam, India.
Ashwani Mishra, Email: ashwanikm@yahoo.com, Institute of Pathology, Indian Council of Medical Research, New Delhi, India.
Stephen M Hewitt, Email: hewitts@mail.nih.gov, Tissue Array Research Laboratory, National Cancer Institute, National Institutes of Health, Bethesda, 20892-4605, USA.
Sunita Saxena, Email: sunita_saxena@yahoo.com, Institute of Pathology, Indian Council of Medical Research, New Delhi 110029, India.
References
- 1.Parkin DM, Bray F, Ferlay J, Pisani P. Global cancer statistics. CA Cancer J Clin. 2005;55:74–108. doi: 10.3322/canjclin.55.2.74. [DOI] [PubMed] [Google Scholar]
- 2.Akbari MR, Mohammadkhani A, Fakheri H, Javad Zahedi M, Shahbazkhani B, Nouraie M, et al. Familial risks of esophageal cancer among Turkman population of the Caspian littoral of Iran. Int J Cancer. 2006;119:1047–51. doi: 10.1002/ijc.21906. [DOI] [PubMed] [Google Scholar]
- 3.Chattopadhyay I, Kapur S, Purkaystha J, Phukan R, Kataki A, Mahanta J, et al. Gene expression profile of esophageal cancer in Northeast India by cDNAmicroarray analysis. World J Gastroenterol. 2007;13:1438–44. doi: 10.3748/wjg.v13.i9.1438. [DOI] [PMC free article] [PubMed] [Google Scholar]
- 4.Consolidated report of population based cancer registry 2001-2004. http://www.icmr.nic.in/ncrp/report.
- 5.Phukan RK, Chetia CK, Ali MS, Mahanta J. Role of dietary habbits in the development of esophageal cancer in Assam, the North-eastern region of India. Nutr Cancer. 2001;39:204–09. doi: 10.1207/S15327914nc392_7. [DOI] [PubMed] [Google Scholar]
- 6.Moll R, Franke WW, Schiller DL, Geiger B, Krepler R. The catalog of human Cytokeratins: patterns of expression in normal epithelia, tumors and cultured cells. Cell. 1982;31:11–24. doi: 10.1016/0092-8674(82)90400-7. [DOI] [PubMed] [Google Scholar]
- 7.Cooper D, Schermer A, Sun TT. Classification of human epithelia and their neoplasm using monoclonal antibodies to keratins: strategies, applications and limitations. Lab Invest. 1985;52:243–56. [PubMed] [Google Scholar]
- 8.Fuchs E, Grace MP, Kim HK, Marchuk D. Differential expression of two classes of keratins in normal and malignant epithelial cells and their evolutionary conservation. In: Levine AJ, editor. Transformed Phenotype. Cancer cell. Vol. 1. 1984. pp. 161–67. [Google Scholar]
- 9.Gown AM, Gabbiani G. Intermediate-size (10-nm) filaments in human tumors. In: DeLellis RA, editor. Advances in Immunohistochemistry. Vol. 1984. Masson; New York: pp. 89–109. [Google Scholar]
- 10.Banks-Schlegel SP, Harris CC. Tissue specific expression of keratin proteins in human esophageal and epidermal epithelium and their cultured keratinocytes. Exp Cell Res. 1983;146:271–80. doi: 10.1016/0014-4827(83)90129-5. [DOI] [PubMed] [Google Scholar]
- 11.Banks-Schlegel SP, Harris CC. Aberrant expression of keratin proteins and cross-linked envelopes in human esophageal carcinomas. Cancer Res. 1984;44:1153–57. [PubMed] [Google Scholar]
- 12.Grace MP, Kim KH, True LD, Fuchs E. Keratin expression in normal esophageal epithelium and squamous cell carcinoma of the esophagus. Cancer Res. 1985;45:841–46. [PubMed] [Google Scholar]
- 13.Moll R, Krepler R, Franke WW. Complex cytokeratin polypeptide pattern observed in certain human carcinomas. Differentiation. 1983;23:256–69. doi: 10.1111/j.1432-0436.1982.tb01291.x. [DOI] [PubMed] [Google Scholar]
- 14.Chung JY, Braunshweig T, Hu N, Roth M, Traicoff JL, Wang OH, et al. Multiplex tissue immunoblotting for proteomic profiling: a pilot study of the normal to tumor transition of esophageal squamous cell carcinoma. Cancer Epidemiol Bio marker Prev. 2006;7:1403–08. doi: 10.1158/1055-9965.EPI-05-0651. [DOI] [PubMed] [Google Scholar]
- 15.Vianne A, Baert J. Expression of cytokeratin-mRNAs in squamous cell carcinoma and balloon-cell formation of human oesophageal epithelium. Histochem J. 1995;27:69–78. doi: 10.1007/BF00164174. [DOI] [PubMed] [Google Scholar]
- 16.Yang K, Lipkin M. AE1 cytokeratin reaction patterns in different differentiation states of squamous cell carcinoma of the esophagus. Am J Clin Pathol. 1990;27:261–69. doi: 10.1093/ajcp/94.3.261. [DOI] [PubMed] [Google Scholar]
- 17.Takahashi H, Shikata N, Senzaki H, Shintaku M, Tsubura A. Immunohistochemical staining patterns of keratins in normal oesophageal epithelium and carcinoma of the oesophagus. Histopathology. 1995;26:45–50. doi: 10.1111/j.1365-2559.1995.tb00619.x. [DOI] [PubMed] [Google Scholar]
- 18.Itakura Y, Sasano H, Abe K, Furukawa Y, Mori S, Nagura Cytokeratin immunolocalization and lectin binding studies in esophageal squamous dysplasia. Histopathology. 1996;29:3–10. doi: 10.1046/j.1365-2559.1996.d01-480.x. [DOI] [PubMed] [Google Scholar]
- 19.Lam KY, Loke SL, Shen XC, Ma LT. Cytokeratin expression in non-neoplastic oesophageal epithelium and squamous cell carcinoma of the oesophagus. Virchows Arch. 1995;426:345–49. doi: 10.1007/BF00191342. [DOI] [PubMed] [Google Scholar]
- 20.Cintorino M, Tripod SA, Santopietro R, et al. Cytokeratin expression patterns as an indicator of tumor progression in oesophageal squamous cell carcinoma. Anticancer Res. 2001;21:4195–202. [PubMed] [Google Scholar]
- 21.Xue L, Hu N, Song Y, et al. Tissue microarray analysis reveals a tight correlation between protein expression and progression of esophageal squamous cell carcinoma. BMC Cancer. 2006;6:296. doi: 10.1186/1471-2407-6-296. [DOI] [PMC free article] [PubMed] [Google Scholar]
- 22.Moll R, Divo M, Langein L. The human keratins: biology and pathology. Histochem Cell Biol. 2008;129:705–733. doi: 10.1007/s00418-008-0435-6. [DOI] [PMC free article] [PubMed] [Google Scholar]