

Abstract
Introduction
The purpose of this study was to compare the non-invasive 3D pseudo-continuous arterial spin labelling (PC ASL) technique with the clinically established dynamic susceptibility contrast perfusion magnetic resonance imaging (DSC-MRI) for evaluation of brain tumours.
Methods
A prospective study of 28 patients with contrast-enhancing brain tumours was performed at 3 T using DSC-MRI and PC ASL with whole-brain coverage. The visual qualitative evaluation of signal enhancement in tumour was scored from 0 to 3 (0 = no signal enhancement compared with white matter, 3 = pronounced signal enhancement with equal or higher signal intensity than in grey matter/basal ganglia). The extent of susceptibility artefacts in the tumour was scored from 0 to 2 (0 = no susceptibility artefacts and 2 = extensive susceptibility artefacts (maximum diameter>2 cm)). A quantitative analysis was performed with normalised tumour blood flow values (ASL nTBF, DSC nTBF): mean value for region of interest (ROI) in an area with maximum signal enhancement/the mean value for ROIs in cerebellum.
Results
There was no difference in total visual score for signal enhancement between PC ASL and DSC relative cerebral blood flow (p=0.12). ASL had a lower susceptibility-artefact score than DSC-MRI (p=0.03). There was good correlation between DSC nTBF and ASL nTBF values with a correlation coefficient of 0.82.
Conclusion
PC ASL is an alternative to DSC-MRI for the evaluation of perfusion in brain tumours. The method has fewer susceptibility artefacts than DSC-MRI and can be used in patients with renal failure because no contrast injection is needed.
Keywords: Magnetic resonance imaging, Perfusion, ASL, DSC-MRI, Brain neoplasms
Introduction
Brain tumours are a leading cause of cancer-related deaths with ten to 15 per 100,000 persons diagnosed both in Europe and USA per year [1]. The growth of malignant tumours requires a substantial blood supply that results in the creation of new vessels, a physiological process called angiogenesis. Perfusion magnetic resonance imaging (MRI) facilitates the prediction of tumour progression in conjunction with histopathology [2]. Cerebral blood volume (CBV) and cerebral blood flow (CBF) are perfusion parameters that can be assessed using bolus-tracking perfusion MRI methods such as dynamic susceptibility contrast MRI (DSC-MRI). Several studies have emphasised the efficiency of relative CBV (rCBV) obtained by DSC-MRI in brain tumour evaluation [3–5]. Relative CBF (rCBF) measured with DSC-MRI is also successfully used in brain tumour prognostication [6, 7]. DSC-MRI is the predominant technique for clinical evaluation of brain tumour perfusion.
Although not yet widely established in clinical practice, arterial spin labelling (ASL) is a MRI technique for retrieval of cerebral perfusion that offers several advantages. It provides absolute quantification of CBF and the technique is totally non-invasive. It uses arterial water as an endogenous tracer by magnetic labelling of the blood-water protons in a cerebral feeding artery. This endogenous approach makes ASL a promising technique for studying perfusion in patients with renal failure and patients who require repetitive follow-ups. Recently developed ASL imaging sequences, incorporating high-field, parallel imaging, pseudo-continuous labelling and 3D imaging with background suppression, now provide a considerable increase in sensitivity for imaging CBF, compared with prior approaches [8]. These features may move ASL from the research stage towards clinical usage [9].
Several brain tumour studies have compared ASL with DSC-MRI, focusing on perfusion ratios [10–12]. Visual inspection of ASL or DSC-MRI maps separately has been assessed in a few previous studies [13, 14], but the visual qualities of the two methods have not been compared systematically. In a clinical setting, visual evaluation of signal enhancement in tumour relative to normal brain parenchyma constitutes an essential part of tumour characterisation and treatment monitoring. The extent of susceptibility artefacts is an important factor in the visual evaluation because artefacts may deteriorate image quality and thereby make the evaluation of the perfusion unreliable or impossible in regions with prominent artefacts.
The aim of this study was to evaluate whether 3D pseudo-continuous ASL (PC ASL) could be a valid alternative to DSC-MRI for qualitative and quantitative evaluation of brain tumour perfusion in a clinical setting.
Materials and methods
Patient population
In this prospective study, perfusion was evaluated in contrast-enhancing brain tumours. Patients already scheduled for a clinical 3-T MRI examination of the brain with DSC-MRI were asked to participate in the study. Thirty-two eligible patients were MR scanned at our university hospital from September 2007 to October 2008. Three of the patients were excluded due to motion artefacts that severely affected the quality of the perfusion maps. One patient was dismissed because of lack of contrast enhancement on T1-weighted MR images. Twenty-eight patients, 11 men and 17 women with a mean age of 58 years, range 22–84 years, were finally enrolled. Ten patients had a newly detected tumour and had no treatment at the time of the MR scan. Eighteen patients had received therapy, but there were still definitive signs of residual or recurrent tumour on contrast-enhanced T1-weighted images. The tumours had been treated by surgery, chemotherapy, radiotherapy or a combination of the three. Tissue for histological analysis had been obtained at stereotactic biopsy or during surgical resection of the tumour. Histopathological assessment of the tumours according to the criteria of the revised WHO classification had revealed 12 grade IV glioblastomas, two grade III anaplastic astrocytomas, one grade III anaplastic oligodendroglioma, three grade II oligodendrogliomas and one grade II astrocytoma. Four meningiomas, three metastases, one lymphoma and one primitive neuroectodermal tumour were also present in the cohort. The tumours were situated adjacent to paranasal sinuses or mastoid air cells in eight patients. All patients tolerated the MRI examination without any adverse reaction to the contrast material injection. The study was approved by the Regional Ethics Review Board; all patients gave written informed consent.
MR imaging
MR scanning was performed on a 3-T whole-body MRI system (Signa HDx, R14M5, GE Healthcare) by using a receive only eight-channel phased-array head coil. All patients were examined with DSC-MRI and morphological sequences including an axial contrast-enhanced T1-weighted sequence (T1Gd) and an axial T2-weighted fast spin echo (FSE) sequence. For our project, an axial 3D FSE PC ASL sequence with spiral acquisition was added to the clinical protocol.
DSC-MRI was performed using a T2*-weighted single-shot gradient-recalled echo-planar imaging (GRE EPI) sequence. Parameters of the sequence were matrix 128× 128, field of view=240 mm, repetition time (TR)= 1,400 ms, echo time (TE)=29 ms, flip angle 60°, array spatial-sensitivity encoding technique=2, number of excitations (NEX)=1, slice thickness=5 mm with 1-mm interslice gaps, number of slices=23 and acquisition time of 90 s. A standard dose of 0.1 mmol/kg body weight of a Gd-based contrast agent (Gadovist, Bayer Schering Pharma AG, Berlin, Germany) was injected intravenously at a rate of 5 ml/s by a power injector (Spectris Solaris, MEDRAD). The images were post-processed with a dedicated software package (Nordic ICE, NordicNeuroLab, Bergen, Norway, http://www.nordicneurolab.com). The measured tissue concentration–time curve was de-convoluted using singular value decomposition with a global arterial input function (AIF; approximately 5 pixels) retrieved from the middle cerebral artery branches in the hemisphere contralateral to the tumour. DSC-MRI maps (rCBF and rCBV) were generated by using an established tracer kinetic model applied to first-pass data [15, 16]. Correction was performed for contrast agent leakage in the tumour due to blood–brain barrier disruption [17].
ASL perfusion imaging was performed with pseudo-continuous labelling, background suppression and a stack of spirals 3D fast spin echo imaging sequence (Fig. 1). PC ASL followed the method of Dai et al. [18]. It employed Hanning radio frequency (RF) pulses of 500 μs duration spaced 1,500 μs apart, an average RF amplitude of 1.8 μT, an average gradient of 0.9 mT/m and a gradient amplitude during the RF pulses of 9 mT/m. Labelling was performed from 3,000 to 1,500 ms before image acquisition. Background suppression was achieved with selective saturation at 4,100 ms before imaging, selective inversion just before the labelling begins at 3,000 ms before imaging and then weakly selective inversion pulses applied at 1,500, 680, 248, and 57 ms before imaging. The selective inversion and saturation pulses were applied to a slab containing the imaged region and ending at the labelling plane. All inversion pulses were adiabatic pulses. In addition to the background suppression pulses, inferior saturation pulses were applied at 1,037, 392 and 116 ms to suppress inflowing arterial blood spins after labelling is completed. A reference image volume for quantification was also acquired using a simple saturation recovery preparation with saturation applied 2,000 ms before image acquisition. After ASL preparation, images were acquired with an interleaved 3D stack of spirals fast spin echo sequence with the following parameters: 512 sampling points on eight spirals, reconstructed matrix 128×128, TR=9.2 ms, TE= 1.9 ms, NEX=3, slice thickness=5 mm, number of slices= 32 and acquisition time=5:36 min. The eight axial spiral interleaves were acquired to encode images with 3.7-mm resolution on a 24-cm field of view. Each fast spin echo train acquired all slices encodes for a particular spiral interleave, and subsequent interleaves were acquired after additional preparation and acquisition. The total spiral duration of 4.1 ms, combined with the fast spin echo refocusing, helped to minimise sensitivity to field nonuniformity. Three averages of the label and control pairs were performed. Quantification was performed using the model of Alsop and Detre [19], with the inclusion of a term for the finite labelling duration as in Wang et al. [20] and correction for the incomplete recovery of the tissue signal in the reference image due to the saturation performed tsat (2,000 ms) before imaging. Flow was calculated with the equation
Fig. 1.

Combined labelling and background suppression preparation sequence: The preparation begins with repeated selective saturation and a single, selective adiabatic inversion pulse for background suppression. Thereafter, labelling is applied for 1.5 s. After the labelling, four inversion pulses are applied for optimal background suppression. In between these inversions, pulses are inferior saturation pulses to minimise signal from inflowing blood arriving after the end of labelling
where f is the flow, S is the signal on the control, label or reference image, T1b is the T1 of blood, T1g is the T1 of grey matter, α is the labelling efficiency, λ is the brain–blood partition coefficient, τ is the labelling duration (1,500 ms) and w (1,500 ms) is the post-labelling delay time. This equation assumes that the label is primarily in the microvasculature, rather than the tissue, so T1 of blood rather than tissue is used throughout. We used an estimate of grey matter T1, 1,200 ms, for the correction of incomplete recovery, but the effect is relatively small such that differences in tissue T1 should not have a major effect on quantification. We used an assumed T1 for blood of 1,600 ms [21] and an average brain value for λ of 0.9 [22]. The labelling efficiency was assumed to be the product of 0.95 for PC ASL efficiency and 0.75 for the additional attenuation from the background suppressed pulses [23].
Visual scoring of tumour tissue with pronounced signal enhancement
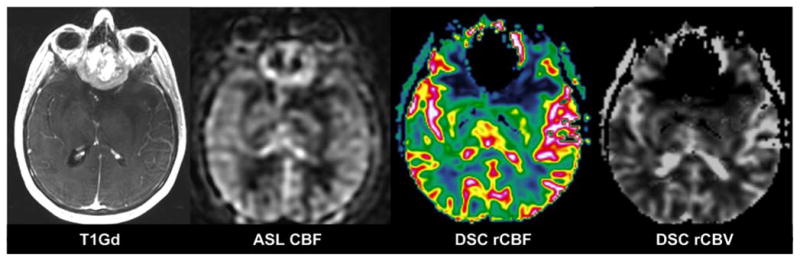
In each tumour, a small region representing tumour tissue with the most pronounced signal enhancement was visually assessed on T1Gd and perfusion images (Fig. 2), by an experienced neuroradiologist blinded to tumour histopathology. The visual evaluation of signal enhancement in ASL CBF and DSC-MRI (both colour-coded and grey-scale maps of rCBF and rCBV) was scored from 0 to 3, where 0 = no signal enhancement compared with white matter (WM), 1 = slightly higher signal enhancement than WM, 2 = moderate signal enhancement, i.e. slightly lower signal enhancement than cortical grey matter (GM)/basal ganglia, and 3 = pronounced signal enhancement with equal or higher signal intensity than in GM/basal ganglia. ASL CBF and DSC-MRI maps (rCBF and rCBV) were evaluated separately at an interval of 4 weeks.
Fig. 2.

Forty-nine-year-old woman with a glioblastoma in the frontal lobes. The region within the tumour with pronounced signal enhancement is marked with circle on ASL CBF, DSC rCBF (colour-coded) and DSC rCBV (grey scale)
Visual assessment of susceptibility artefacts
A susceptibility artefact was defined as signal loss/displacement close to interfaces between tissues with different magnetic susceptibility, e.g. at air/soft tissue interfaces close to paranasal sinuses and mastoid air cells. The extent of susceptibility artefacts in the tumour region or close surroundings was noted on ASL CBF and DSC-MRI maps (rCBF and rCBV) and scored from 0 to 2, where 0 = no susceptibility artefacts, 1 = small/moderate (maximum diameter<2 cm) susceptibility artefacts, not affecting tumour evaluation and 2 = extensive susceptibility artefacts (maximum diameter> 2 cm), deteriorating tumour evaluation.
Quantitative perfusion analysis
Tumour regions of interest (ROIs), range 0.28–2.0 cm2, were manually drawn in an area with maximum signal enhancement on grey-scale DSC rCBF map and copied to the corresponding DSC rCBV map using in-house developed software. Effort was made to localise the same ROI position on ASL CBF as on the DSC-MRI maps (rCBF and rCBV). Necrotic tissue and large vessels were avoided by comparison with T1Gd and T2-weighted images. Tumour-to-healthy tissue perfusion ratios were calculated by dividing the mean value of tumour ROI by the mean value in ROIs in the two cerebellar hemispheres. Cerebellar ROIs (approximately 2.5 cm2 each) were placed in the central parts of the bilateral cerebellar hemispheres (Fig. 3). Additional ROIs were placed in normal appearing GM (approximately 4.0 cm2) and WM (approximately 2.5 cm2) in the hemisphere contralateral to the tumour. Normalised tumour blood flow (nTBF) values [24] were thus evaluated on ASL CBF (ASL nTBF) and DSC rCBF maps (DSC nTBF). The corresponding procedure was performed on DSC rCBV maps, producing normalised tumour blood volume (DSC nTBV) values. Absolute perfusion values were measured with PC ASL in the above-described ROIs in tumour tissue, in the cerebellum and in contralateral normal appearing GM and WM.
Fig. 3.

ROIs (approximately 2.5 cm2 each) placed in the central parts of the bilateral cerebellar hemispheres
Statistics—qualitative perfusion analysis
Comparison between ASL CBF and DSC rCBF was performed with Mann–Whitney test (significance level set at p<0.05) for both visual score in the tumour region with pronounced signal enhancement and susceptibility-artefact score. These statistical analyses were performed using SigmaStat 3.5. (Systat Software, Inc., Point Richmond, CA, USA).
Statistics—quantitative perfusion analysis; normalisation to cerebellum
ASL nTBF was compared with DSC nTBF, and DSC nTBF was compared with DSC nTBV measurements using paired t tests. Linear regression and Pearson’s correlation were used to evaluate association between quantitative results. The agreement between ASL nTBF and DSC nTBF measurements were quantified by the coefficient of agreement [25], which is 1.96×SD, where SD is the standard deviation of the difference between observed ASL nTBF and predicted ASL nTBF from DSC nTBF. Assumption of normal distribution was evaluated by visual inspection of relevant residuals (the difference between observed and expected values) and found adequate. These statistical analyses were performed using the SPSS, version 16.0 software package (SPSS Inc., Chicago, IL, USA).
Results
Visual scoring of tumour tissue with pronounced signal enhancement
The visual evaluation of signal enhancement in ASL CBF and DSC-MRI maps (both colour-coded and grey-scale maps of rCBF and rCBV) showed that the total visual score in tumour regions with pronounced signal enhancement was lower in ASL CBF than in DSC-MRI—70 vs. 80 with DSC-MRI (Fig. 4). There was no statistically significant difference in total visual score for signal enhancement between the two sequences (p=0.12). Nineteen out of 28 patients had the same visual score with ASL CBF and DSC rCBF.
Fig. 4.

Visual score for signal enhancement in tumour region with ASL CBF and DSC-MRI maps (rCBF and rCBV). 0 no signal enhancement compared with white matter, 1 slightly higher signal enhancement than white matter, 2 moderate signal enhancement, i.e. slightly lower signal enhancement than cortical grey matter/basal ganglia, 3 pronounced signal enhancement with equal or higher signal intensity than in cortical grey matter/basal ganglia
Visual assessment of susceptibility artefacts
A lower total susceptibility-artefact score was seen for ASL CBF maps than for DSC-MRI maps (rCBF and rCBV; Fig. 5). Susceptibility artefacts were less prominent in ASL CBF (Fig. 6).
Fig. 5.

Visual score for susceptibility artefacts for ASL CBF and DSC-MRI maps (rCBF and rCBV). 0 no susceptibility artefacts, 1 small/moderate (maximum diameter<2 cm) susceptibility artefacts, not affecting tumour evaluation, 2 extensive susceptibility artefacts (maximum diameter>2 cm), deteriorating tumour evaluation
Fig. 6.
A 54-year-old woman with an olfactory groove meningioma. Susceptibility artefacts are prominent on DSC-MRI maps (rCBF and rCBV) but not on ASL CBF
ASL CBF had in total a susceptibility-artefact score of 15, whereas DSC rCBF (and DSC rCBV) yielded a score of 29. The difference in score for number of susceptibility artefacts was statistically significant (p=0.03).
Quantitative perfusion analysis
Normalised perfusion values, i.e. ASL nTBF, DSC nTBF and DSC nTBV, as well as absolute ASL TBF in gliomas and non-gliomas, number of patients, age, gender and number of treated patients, are shown in Table 1. Most (15 of 19) of the patients with gliomas had ongoing treatment at the time of the MR scan. Figure 7 shows distribution of ASL nTBF, DSC nTBF and DSC nTBV values for all the different tumour types. Meningiomas showed the highest median ASL nTBF, DSC nTBF and DSC nTBV values. Figure 8 shows a scatterplot of ASL nTBF and DSC nTBF values in all tumour types. The Pearson correlation coefficient was 0.82 (R2=0.67). Mean ASL nTBF (2.46± 1.67) in this study was approximately 67% (range 58–75%) of the corresponding DSC nTBF (3.60±2.24). Figure 9 shows a Bland–Altman plot for ASL nTBF and adjusted DSC nTBF (0.67×DSC nTBF). Differences for ASL nTBF and adjusted DSC nTBF values were on average 0.05±0.97 (mean ± SD) resulting in a coefficient of repeatability of 1.91. Figure 10 shows a scatterplot of DSC nTBF and DSC nTBV values. Pearson correlation coefficient was 0.70 (R2=0.49). Table 2 summarises CBF values normalised to different reference regions in high-grade gliomas from eight different studies compared with our results. Table 3 shows absolute ASL CBF values in the cerebellum and normal appearing WM and GM in the hemisphere contralateral to the tumour.
Table 1.
Tumour blood flow and tumour blood volume normalised to cerebellum measured with ASL (ASL nTBF) and DSC-MRI (DSC nTBF and DSC nTBV).
| Variable | All tumours (n=28) | Gliomas (n=19) | Non-gliomas (n=9) |
|---|---|---|---|
| Mean±SD | Mean±SD | Mean±SD | |
| ASL nTBF | 2.46±1.67 | 2.24±1.60 | 2.94±1.81 |
| ASL TBF | (70.7±46.3) | (61.5±32.3) | (90.2±65.5) |
| DSC nTBF | 3.60±2.24 | 3.39±2.03 | 4.04±2.70 |
| DSC nTBV | 3.87±2.10 | 3.53±1.46 | 4.56±3.05 |
| Age | 58±15 | 54.5±15 | 65.2±13 |
| Gender | 11 m, 17 f | 10 m, 9 f | 1 m, 8 f |
| Treated patientsa, n | 18 | 15 | 3 |
Absolute ASL TBF values (ml/min/100 g) within parenthesis
n number of patients, m male, f female
Surgery, chemotherapy and/or radiotherapy
Fig. 7.

Boxplot showing tumour blood flow and tumour blood volume normalised to cerebellum measured with ASL (ASL nTBF) and DSC-MRI (DSC nTBF and DSC nTBV) in different tumour types (*PNET primitive neuroectodermal tumour); box the inter-quartile range (i.e. 25–75%), whiskers extreme values, black bar median, black dots outliers, n number of patients in the group
Fig. 8.

Scatterplot showing tumour blood flow normalised to cerebellum measured with ASL (ASL nTBF) and DSC-MRI (DSC nTBF) in all 28 brain tumour patients. The line represents linear regression between ASL nTBF and DSC nTBF. Pearson correlation coefficient r=0.82 (R2=0.67)
Fig. 9.
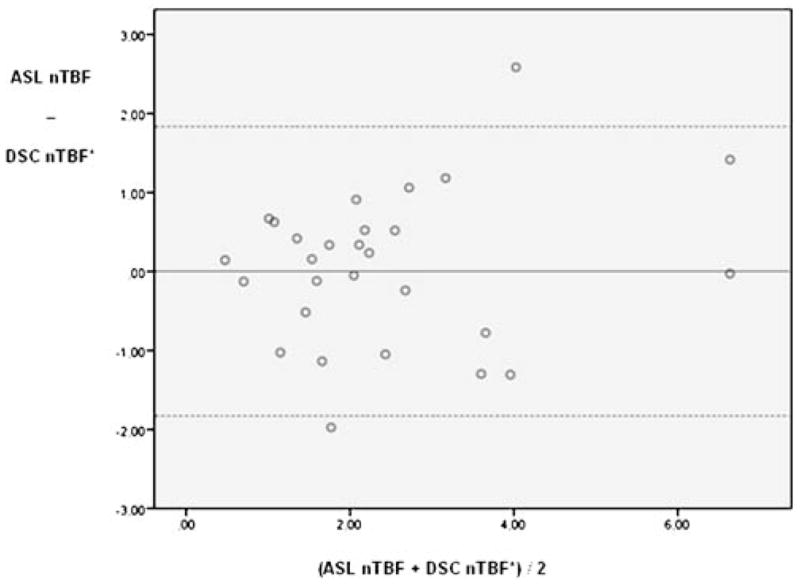
Bland and Altman plot of tumour blood flow normalised to cerebellum measured with ASL (ASL nTBF) and adjusted DSC-MRI (0.67×DSC nTBF). Dashed lines corresponds to 95% limits of agreement
Fig. 10.

Scatterplot showing tumour blood flow and tumour blood volume normalised to cerebellum measured with DSC-MRI (DSC nTBF and DSC nTBV). The line represents linear regression between DSC nTBF and DSC nTBV. Pearson correlation coefficient r=0.70 (R2=0.49)
Table 2.
Normalised CBF values in high-grade gliomas: results of previous MRI perfusion studies compared with the present study.
| Authors | N | ASL nTBF (mean±SD) | DSC nTBF (mean±SD) | Reference region |
|---|---|---|---|---|
| Present study | 19 | 2.24±1.60 | 3.39±2.03 | Cerebellum |
| 1.39±0.87 | 2.24±1.37 | Contralateral GM | ||
| 4.86±3.84 | 7.14±4.20 | Contralateral WM | ||
| Appignani et al. [26] | 20 | 1.05a | Contralateral GM | |
| Ulmer [31] | 1 | - | 2.03 | Contralateral GM |
| Wolf and Detre [8] | 19 | 2.84±1.78a | - | Global mean |
| Warmuth et al. [11] | 17 | 1.27±0.71b | 1.07±0.45 | Contralateral hemisphere |
| Chawla et al. [32] | 22 | 1.90±0.75a | - | Contralateral WM |
| Shin et al. [7] | 11 | - | 4.82±2.64 | Contralateral WM |
| Senturk et al. [33] | 11 | - | 4.59±1.61 | Contralateral WM |
| Hakyemez et al. [6] | 22 | - | 3.32±1.87 | Contralateral WM |
N number of patients, GM grey matter, WM white matter
Continuous ASL
Pulsed ASL(Q2TIPS)
Table 3.
Absolute ASL CBF values (millilitres per minute per 100 g) in ROIs from cerebellum and normal appearing WM and GM in all patients (n=28).
| Regions of interest | ASL CBF (mean±SD) |
|---|---|
| Cerebellum | 30.5±8.86 |
| GM | 44.4±8.44 |
| WM | 14.9±6.21 |
GM grey matter, WM white matter
Discussion
This is the first study systematically comparing visual evaluation of brain tumour perfusion maps obtained using ASL and DSC-MRI. In addition, we have made quantitative comparisons of perfusion ratios obtained with both techniques and obtained absolute ASL CBF values.
Visual scoring of tumour tissue with pronounced signal enhancement
We found that perfusion maps obtained using DSC-MRI had a higher signal enhancement score than ASL CBF, although the difference was not statistically significant (Fig. 4). PC ASL enables a more subtle visual grading of tumours than DSC-MRI, where almost all tumours scored 3 in signal enhancement (Fig. 4). A previous study has described a higher tumour to GM contrast in ASL images in comparison to DSC-MRI maps, facilitating detection and delineation of tumours [26]. In some ASL CBF, a larger difference in signal enhancement was indeed seen between tumour and cortex compared to DSC-MRI maps (Fig. 2), but not in the majority of our ASL images. Our system of assigning points to degree of signal enhancement is sufficient to quickly get an overview of tumour perfusion in clinical practice but a more advanced scoring system is needed in order to substantially improve the sensitivity and predictive values of preoperative grading of gliomas compared with conventional imaging alone [13].
Visual assessment of susceptibility artefacts
We found that ASL CBF images had significantly fewer susceptibility artefacts than did DSC-MRI maps (Fig. 5). Tumours situated close to bone–air interfaces, such as the paranasal sinuses and the mastoid air cells, are particularly vulnerable to susceptibility artefacts. In our cohort, eight tumours were situated in such regions. Spiral acquisition and FSE instead of single-shot GRE EPI explain the low number of susceptibility artefacts seen in ASL compared with DSC GRE EPI maps in our study [27].
Quantitative perfusion analysis
The precision of the CBF measurements obtained by 3D PC ASL and DSC-MRI is dependent on the calculation models. The signal behaviour/perfusion value is expected to differ between the two perfusion techniques because DSC-MRI uses a Gd-based contrast agent with a larger molecular weight and different diffusion behaviour than water molecules [28]. Differences in ratios between these two perfusion techniques could further be due to vascular artefacts often observed in DSC-MRI maps in which flow in larger vessels may be partially included in the tumour ROIs. Reproducible absolute quantification of CBF with DSC-MRI is difficult because the perfusion calculation post-processing step demands a careful selection of the AIF (also hampering reproducible absolute quantification of CBV) and advanced de-convolution algorithms. In clinical practice, usually only a relative perfusion measurement is possible with DSC-MRI [9]. ASL was therefore quantitatively compared with DSC-MRI by means of normalised perfusion values in this study.
Some DSC-MRI, positron emission tomography (PET), and single photon emission computed tomography studies have used the cerebellum as a reference region when analysing perfusion and tracer uptake in brain tumours [29, 30], but normalisation of TBF to contralateral GM and in particular contralateral WM has most often been performed in MRI studies[6, 7, 26, 31–33]. However, because cerebellar perfusion usually is unaffected by pathology in the brain and is higher than WM CBF (Table 3) and thereby is easier to measure with the ASL technique, we have consequently chosen to focus on the normalisation to cerebellum in this study. One disadvantage with this approach is the difficulty of comparing our results with results obtained in other perfusion studies. For this purpose, additional ROIs were placed in GM and WM (Table 2). Regarding normalisation to GM, our ASL nTBF and DSC nTBF values are in accordance with previous studies [26, 31]. Absolute ASL CBF values in GM (Table 3) are consistent with absolute ASL CBF values found in the literature [34, 35]. Our ASL nTBF and DSC nTBF values normalised to WM are, however, higher than those in the previous studies in the comparison (Table 2). WM perfusion measurements with ASL may have disadvantages. Normal contralateral WM in brain tumour patients often has significantly higher water content than do healthy individuals [36]. In addition, normal-appearing WM in brain tumour patients may be affected by demyelination and mild structural degradation of axonal fibres after radiotherapy [37]. In WM, we obtained absolute ASL CBF values of 14.9± 6.21 ml/min/100 g (Table 3). For comparison, a large PET study in normal volunteers showed an average CBF of 22 ml/min/100 g in WM [38]. ASL often underestimates WM CBF due to long transit times and perfusion values in the lower range of measurable flow [9, 39]. These findings make WM a questionable reference region. However, before any definitive conclusions are made regarding appropriate reference regions, it is important to remember that different studies use different data acquisition, different approach to measure tumour perfusion (hot spot, mean value in whole tumour etc.), different cohort (treated vs. non-treated patients) and different post-processing’s programs and techniques, factors hampering comparisons between different studies [40].
Perfusion MRI can provide useful information on meningioma vascularity which is not available from conventional MRI [41]. Meningiomas have a high vascularity, and in our study, this tumour type showed the highest median ASL nTBF (Fig. 7). This finding is in agreement with a study in which the highest mean ASL nTBF (Q2TiPS: normalised to contralateral normal brain tissue) was found in meningiomas and the lowest mean ASL nTBF was found in CNS lymphomas [42], as was the case in our study. High-grade gliomas are also known to have a high vascularity. We got a mean ASL nTBF of 2.24±1.60 and a mean DSC nTBF of 3.39±2.03 in gliomas (Table 1). Absolute ASL TBF values in gliomas were 61.5±32.3 ml/min/100 g and for non-gliomas 90.2±65.5 ml/min/100 g (Table 1). One study has reported absolute ASL CBF values of 94.4±71.7 ml/min/100 g in high-grade gliomas in untreated patients [43]. Our perfusion values were lower which may be due to the fact that 15 out of the 19 patients with gliomas had ongoing treatment at the time of the MR scan. The high CBF values seen amongst non-gliomas may be explained by highly vascularised meningiomas and metastases.
A maximum signal enhancement ROI approach was used in this study when values for ASL and DSC-MRI were evaluated clinically. The same experienced operator performed all ROI measurements, minimising user dependency. Another approach, first introduced by Ludemann et al. [44], is histogram analyses of perfusion. Although the ROI approach is operator dependent and may be limited due to partial volume effects [45], there is one study showing that it is superior to histogram analyses in the grading of glial neoplasms [46], whereas other studies favour histogram analysis because of higher interobserver agreement, sensitivity and negative predictive value and equal specificity [24]. The ROI approach is easy to use in clinical settings, but histogram-based analyses are preferable if the operator is inexperienced.
Most previous MRI studies have used DSC rCBV for the evaluation of brain tumour perfusion [3, 4]. This study, in which DSC nTBF values correlated (r=0.70) with the corresponding DSC nTBV values (Fig. 10), confirms that DSC rCBF may be as good as DSC rCBV for the assessment of brain tumour perfusion. In clinical practice, a relative or normalised perfusion value usually is a sufficient estimate of brain tumour perfusion. DSC rCBF and ASL CBF values, normalised to cerebellum, may be equally good predictors of tumour angiogenesis with a correlation coefficient of 0.82 (Fig. 8) and a coefficient of repeatability of 1.91. On the other hand, only ASL allows for reproducible absolute quantification in a feasible way, enabling comparison between patients or comparison of values in individual patients. A more frequent use of ASL would be desirable for the monitoring and follow-up of brain tumour treatment to avoid repeated contrast injections. This requires that morphological details can be adequately assessed without T1-weighted images after contrast injection and that has not yet been demonstrated. The visual evaluation is facilitated on ASL images, due to less extensive susceptibility artefacts. Nevertheless, 3D PC ASL is presently not suitable for imaging of acute stroke patients in whom a short scan time is essential and CBV and mean transit time maps may play an important role in treatment decisions.
Implications of the findings for future research and for clinical practice
The ASL technique has not been established in clinical practice because of a limited coverage of the brain and long acquisition times that not only increased the session time for the patient but could also produce severe motion artefacts in the images. Previously, shorter scan times could only be achieved with ASL using a poor resolution and fewer slices. Today, with a more extensive use of 3-T scanners and new improved ASL sequences like 3D PC ASL, much of the previous resistance towards the ASL technique will disappear. The non-invasive 3D PC ASL perfusion sequence without ionising radiation has full coverage of the brain and could, with the use of high-field scanners, be introduced in everyday clinical practice for a wide range of clinical applications. The absolute quantification of CBF can also be useful for repeated perfusion measurements in physiological research and clinical examinations.
Conclusion
This study has shown that 3D FSE PC ASL could be used as an alternative to DSC-MRI for the evaluation of perfusion in brain tumours. The perfusion images obtained with the ASL technique have fewer susceptibility artefacts than perfusion maps obtained using DSC-MRI, and the ASL method can, with advantage, be used in patients with renal failure since no contrast injection is needed.
Acknowledgments
This study was supported in part by NIH grant, 5 R01 CA115745 (D.C. Alsop).
This author receives research support from GE Healthcare and Merck & Co. and works as a paid consultant for Merck & Co.
Footnotes
Conflict of interest statement E. T. Fründ is employed at Aalborg Hospital, Department of Radiology with association to GE Healthcare—Applied Science Lab Europe. A. Shankaranarayanan is employed at GE Healthcare, Applied Science Lab, Menlo Park, California. D. C. Alsop is an inventor on several patents related to ASL and to the ASL sequence in this manuscript.
References
- 1.Ohgaki H, Kleihues P. Population-based studies on incidence, survival rates, and genetic alterations in astrocytic and oligodendroglial gliomas. J Neuropathol Exp Neurol. 2005;64:479–489. doi: 10.1093/jnen/64.6.479. [DOI] [PubMed] [Google Scholar]
- 2.Tourdias T, Rodrigo S, Oppenheim C, et al. Pulsed arterial spin labeling applications in brain tumors: practical review. J Neuroradiol. 2008;35:79–89. doi: 10.1016/j.neurad.2007.11.007. [DOI] [PubMed] [Google Scholar]
- 3.Zhang H, Rodiger LA, Shen T, Miao J, Oudkerk M. Preoperative subtyping of meningiomas by perfusion MR imaging. Neuroradiology. 2008;50:835–840. doi: 10.1007/s00234-008-0417-3. [DOI] [PubMed] [Google Scholar]
- 4.Jenkinson MD, Smith TS, Joyce KA, et al. Cerebral blood volume, genotype and chemosensitivity in oligodendroglial tumours. Neuroradiology. 2006;48:703–713. doi: 10.1007/s00234-006-0122-z. [DOI] [PMC free article] [PubMed] [Google Scholar]
- 5.Zonari P, Baraldi P, Crisi G. Multimodal MRI in the characterization of glial neoplasms: the combined role of single-voxel MR spectroscopy, diffusion imaging and echo-planar perfusion imaging. Neuroradiology. 2007;49:795–803. doi: 10.1007/s00234-007-0253-x. [DOI] [PubMed] [Google Scholar]
- 6.Hakyemez B, Erdogan C, Ercan I, Ergin N, Uysal S, Atahan S. High-grade and low-grade gliomas: differentiation by using perfusion MR imaging. Clin Radiol. 2005;60:493–502. doi: 10.1016/j.crad.2004.09.009. [DOI] [PubMed] [Google Scholar]
- 7.Shin JH, Lee HK, Kwun BD, et al. Using relative cerebral blood flow and volume to evaluate the histopathologic grade of cerebral gliomas: preliminary results. AJR Am J Roentgenol. 2002;179:783–789. doi: 10.2214/ajr.179.3.1790783. [DOI] [PubMed] [Google Scholar]
- 8.Wolf RL, Detre JA. Clinical neuroimaging using arterial spin-labeled perfusion magnetic resonance imaging. Neurotherapeutics. 2007;4:346–359. doi: 10.1016/j.nurt.2007.04.005. [DOI] [PMC free article] [PubMed] [Google Scholar]
- 9.Petersen ET, Zimine I, Ho YC, Golay X. Non-invasive measurement of perfusion: a critical review of arterial spin labelling techniques. Br J Radiol. 2006;79:688–701. doi: 10.1259/bjr/67705974. [DOI] [PubMed] [Google Scholar]
- 10.Kimura H, Takeuchi H, Koshimoto Y, et al. Perfusion imaging of meningioma by using continuous arterial spin-labeling: comparison with dynamic susceptibility-weighted contrast-enhanced MR images and histopathologic features. AJNR Am J Neuroradiol. 2006;27:85–93. [PMC free article] [PubMed] [Google Scholar]
- 11.Warmuth C, Gunther M, Zimmer C. Quantification of blood flow in brain tumors: comparison of arterial spin labeling and dynamic susceptibility-weighted contrast-enhanced MR imaging. Radiology. 2003;228:523–532. doi: 10.1148/radiol.2282020409. [DOI] [PubMed] [Google Scholar]
- 12.Weber MA, Thilmann C, Lichy MP, et al. Assessment of irradiated brain metastases by means of arterial spin-labeling and dynamic susceptibility-weighted contrast-enhanced perfusion MRI: initial results. Invest Radiol. 2004;39:277–287. doi: 10.1097/01.rli.0000119195.50515.04. [DOI] [PubMed] [Google Scholar]
- 13.Kim HS, Kim SY. A prospective study on the added value of pulsed arterial spin-labeling and apparent diffusion coefficients in the grading of gliomas. AJNR Am J Neuroradiol. 2007;28:1693–1699. doi: 10.3174/ajnr.A0674. [DOI] [PMC free article] [PubMed] [Google Scholar]
- 14.Essig M, Wenz F, Scholdei R, et al. Dynamic susceptibility contrast-enhanced echo-planar imaging of cerebral gliomas. Effect of contrast medium extravasation. Acta Radiol. 2002;43:354–359. doi: 10.1080/j.1600-0455.2002.430402.x. [DOI] [PubMed] [Google Scholar]
- 15.Ostergaard L, Weisskoff RM, Chesler DA, Gyldensted C, Rosen BR. High resolution measurement of cerebral blood flow using intravascular tracer bolus passages. Part I: mathematical approach and statistical analysis. Magn Reson Med. 1996;36:715–725. doi: 10.1002/mrm.1910360510. [DOI] [PubMed] [Google Scholar]
- 16.Rosen BR, Belliveau JW, Vevea JM, Brady TJ. Perfusion imaging with NMR contrast agents. Magn Reson Med. 1990;14:249–265. doi: 10.1002/mrm.1910140211. [DOI] [PubMed] [Google Scholar]
- 17.Boxerman JL, Schmainda KM, Weisskoff RM. Relative cerebral blood volume maps corrected for contrast agent extravasation significantly correlate with glioma tumor grade, whereas uncorrected maps do not. AJNR Am J Neuroradiol. 2006;27:859–867. [PMC free article] [PubMed] [Google Scholar]
- 18.Dai W, Garcia D, de Bazelaire C, Alsop DC. Continuous flow-driven inversion for arterial spin labeling using pulsed radio frequency and gradient fields. Magn Reson Med. 2008;60:1488–1497. doi: 10.1002/mrm.21790. [DOI] [PMC free article] [PubMed] [Google Scholar]
- 19.Alsop DC, Detre JA. Reduced transit-time sensitivity in noninvasive magnetic resonance imaging of human cerebral blood flow. J Cereb Blood Flow Metab. 1996;16:1236–1249. doi: 10.1097/00004647-199611000-00019. [DOI] [PubMed] [Google Scholar]
- 20.Wang J, Zhang Y, Wolf RL, Roc AC, Alsop DC, Detre JA. Amplitude-modulated continuous arterial spin-labeling 3.0-T perfusion MR imaging with a single coil: feasibility study. Radiology. 2005;235:218–228. doi: 10.1148/radiol.2351031663. [DOI] [PubMed] [Google Scholar]
- 21.Lu H, Clingman C, Golay X, van Zijl PC. Determining the longitudinal relaxation time (T1) of blood at 3.0 Tesla. Magn Reson Med. 2004;52:679–682. doi: 10.1002/mrm.20178. [DOI] [PubMed] [Google Scholar]
- 22.Herscovitch P, Raichle ME. What is the correct value for the brain–blood partition coefficient for water? J Cereb Blood Flow Metab. 1985;5:65–69. doi: 10.1038/jcbfm.1985.9. [DOI] [PubMed] [Google Scholar]
- 23.Garcia DM, Duhamel G, Alsop DC. Efficiency of inversion pulses for background suppressed arterial spin labeling. Magn Reson Med. 2005;54:366–372. doi: 10.1002/mrm.20556. [DOI] [PubMed] [Google Scholar]
- 24.Emblem KE, Nedregaard B, Nome T, et al. Glioma grading by using histogram analysis of blood volume heterogeneity from MR-derived cerebral blood volume maps. Radiology. 2008;247:808–817. doi: 10.1148/radiol.2473070571. [DOI] [PubMed] [Google Scholar]
- 25.Bland JM, Altman DG. Measuring agreement in method comparison studies. Stat Methods Med Res. 1999;8:135–160. doi: 10.1177/096228029900800204. [DOI] [PubMed] [Google Scholar]
- 26.Appignani B, Wong ET, Hackney DB, Alsop DC. Comparison of arterial spin labeling and dynamic susceptibility contrast imaging in glioma. Proc Intl Soc Mag Reson Med. 2006:14. [Google Scholar]
- 27.Wang J, Alsop DC, Li L, et al. Comparison of quantitative perfusion imaging using arterial spin labeling at 1.5 and 4.0 Tesla. Magn Reson Med. 2002;48:242–254. doi: 10.1002/mrm.10211. [DOI] [PubMed] [Google Scholar]
- 28.Ye FQ, Berman KF, Ellmore T, et al. H(2)(15)O PET validation of steady-state arterial spin tagging cerebral blood flow measurements in humans. Magn Reson Med. 2000;44:450–456. doi: 10.1002/1522-2594(200009)44:3<450::aid-mrm16>3.0.co;2-0. [DOI] [PubMed] [Google Scholar]
- 29.Arbab AS, Aoki S, Toyama K, et al. Brain perfusion measured by flow-sensitive alternating inversion recovery (FAIR) and dynamic susceptibility contrast-enhanced magnetic resonance imaging: comparison with nuclear medicine technique. Eur Radiol. 2001;11:635–641. doi: 10.1007/s003300000571. [DOI] [PubMed] [Google Scholar]
- 30.Carvalho PA, Schwartz RB, Alexander E, 3rd, et al. Detection of recurrent gliomas with quantitative thallium-201/technetium-99 m HMPAO single-photon emission computerized tomography. J Neurosurg. 1992;77:565–570. doi: 10.3171/jns.1992.77.4.0565. [DOI] [PubMed] [Google Scholar]
- 31.Ulmer S, Helle M, Jansen O, Mehdorn HM, Nabavi A. Intraoperative dynamic susceptibility contrast weighted magnetic resonance imaging (iDSC-MRI)—technical considerations and feasibility. Neuroimage. 2009;45:38–43. doi: 10.1016/j.neuroimage.2008.11.021. [DOI] [PubMed] [Google Scholar]
- 32.Chawla S, Wang S, Wolf RL, et al. Arterial spin-labeling and MR spectroscopy in the differentiation of gliomas. AJNR Am J Neuroradiol. 2007;28:1683–1689. doi: 10.3174/ajnr.A0673. [DOI] [PMC free article] [PubMed] [Google Scholar]
- 33.Senturk S, Oguz KK, Cila A. Dynamic contrast-enhanced susceptibility-weighted perfusion imaging of intracranial tumors: a study using a 3 T MR scanner. Diagn Interv Radiol. 2009;15:3–12. [PubMed] [Google Scholar]
- 34.Knutsson L, van Westen D, Petersen ET, et al. Absolute quantification of cerebral blood flow: correlation between dynamic susceptibility contrast MRI and model-free arterial spin labeling. Magn Reson Imaging. 2009 doi: 10.1016/j.mri.2009.06.006. [DOI] [PubMed] [Google Scholar]
- 35.Petersen ET, Mouridsen K, Golay X on behalf of all named coauthors of the QUASAR test–retest study. The QUASAR reproducibility study, part II: results from a multi-center arterial spin labeling test–retest study. Neuroimage. 2009 doi: 10.1016/j.neuro image.2009.07.068. [DOI] [PMC free article] [PubMed] [Google Scholar]
- 36.Andersen C. In vivo estimation of water content in cerebral white matter of brain tumour patients and normal individuals: towards a quantitative brain oedema definition. Acta Neurochir (Wien) 1997;139:249–255. doi: 10.1007/BF01844760. discussion 255–6. [DOI] [PubMed] [Google Scholar]
- 37.Nagesh V, Tsien CI, Chenevert TL, et al. Radiation-induced changes in normal-appearing white matter in patients with cerebral tumors: a diffusion tensor imaging study. Int J Radiat Oncol Biol Phys. 2008;70:1002–1010. doi: 10.1016/j.ijrobp.2007.08.020. [DOI] [PMC free article] [PubMed] [Google Scholar]
- 38.Leenders KL, Perani D, Lammertsma AA, et al. Cerebral blood flow, blood volume and oxygen utilization. Normal values and effect of age. Brain. 1990;113(Pt 1):27–47. doi: 10.1093/brain/113.1.27. [DOI] [PubMed] [Google Scholar]
- 39.van Gelderen P, de Zwart JA, Duyn JH. Pittfalls of MRI measurement of white matter perfusion based on arterial spin labeling. Magn Reson Med. 2008;59:788–795. doi: 10.1002/mrm.21515. [DOI] [PMC free article] [PubMed] [Google Scholar]
- 40.Paulson ES, Schmainda KM. Comparison of dynamic susceptibility-weighted contrast-enhanced MR methods: recommendations for measuring relative cerebral blood volume in brain tumors. Radiology. 2008;249:601–613. doi: 10.1148/radiol.2492071659. [DOI] [PMC free article] [PubMed] [Google Scholar]
- 41.Zhang H, Rodiger LA, Shen T, Miao J, Oudkerk M. Perfusion MR imaging for differentiation of benign and malignant meningiomas. Neuroradiology. 2008;50:525–530. doi: 10.1007/s00234-008-0373-y. [DOI] [PMC free article] [PubMed] [Google Scholar]
- 42.Weber MA, Zoubaa S, Schlieter M, et al. Diagnostic performance of spectroscopic and perfusion MRI for distinction of brain tumors. Neurology. 2006;66:1899–1906. doi: 10.1212/01.wnl.0000219767.49705.9c. [DOI] [PubMed] [Google Scholar]
- 43.Wolf RL, Wang J, Wang S, et al. Grading of CNS neoplasms using continuous arterial spin labeled perfusion MR imaging at 3 Tesla. J Magn Reson Imaging. 2005;22:475–482. doi: 10.1002/jmri.20415. [DOI] [PubMed] [Google Scholar]
- 44.Ludemann L, Grieger W, Wurm R, Budzisch M, Hamm B, Zimmer C. Comparison of dynamic contrast-enhanced MRI with WHO tumor grading for gliomas. Eur Radiol. 2001;11:1231–1241. doi: 10.1007/s003300000748. [DOI] [PubMed] [Google Scholar]
- 45.Weber MA, Gunther M, Lichy MP, et al. Comparison of arterial spin-labeling techniques and dynamic susceptibility-weighted contrast-enhanced MRI in perfusion imaging of normal brain tissue. Invest Radiol. 2003;38:712–718. doi: 10.1097/01.rli.0000084890.57197.54. [DOI] [PubMed] [Google Scholar]
- 46.Young R, Babb J, Law M, Pollack E, Johnson G. Comparison of region-of-interest analysis with three different histogram analysis methods in the determination of perfusion metrics in patients with brain gliomas. J Magn Reson Imaging. 2007;26:1053–1063. doi: 10.1002/jmri.21064. [DOI] [PubMed] [Google Scholar]