Abstract
There is currently wide interest in room temperature storage of dehydrated DNA. However, there is insufficient knowledge about its chemical and structural stability. Here, we show that solid-state DNA degradation is greatly affected by atmospheric water and oxygen at room temperature. In these conditions DNA can even be lost by aggregation. These are major concerns since laboratory plastic ware is not airtight. Chain-breaking rates measured between 70°C and 140°C seemed to follow Arrhenius’ law. Extrapolation to 25°C gave a degradation rate of about 1–40 cuts/105 nucleotides/century. However, these figures are to be taken as very tentative since they depend on the validity of the extrapolation and the positive or negative effect of contaminants, buffers or additives. Regarding the secondary structure, denaturation experiments showed that DNA secondary structure could be preserved or fully restored upon rehydration, except possibly for small fragments. Indeed, below about 500 bp, DNA fragments underwent a very slow evolution (almost suppressed in the presence of trehalose) which could end in an irreversible denaturation. Thus, this work validates using room temperature for storage of DNA if completely protected from water and oxygen.
INTRODUCTION
There is currently a wide consensus for the need to preserve DNA. Among other aims, DNA samples need to be stored, sometimes in huge numbers, for constituting biorepositories and preserving genetic diversity, for large-scale genetic studies and for medical, clinical, pharmaceutical and forensic applications. In view of the exponential increase in the number of samples to be stored, classical storage in freezers appears cumbersome, costly and not without risk of failure. Therefore, room temperature storage is currently an alternative gaining an increasing interest.
However, dehydration cannot really be considered as an effective room-temperature conservation procedure unless more information about the stability and storage life of dehydrated DNA is acquired. In this introduction, we review relevant data regarding DNA degradation. Since degradation kinetics have mostly been based on measuring chain breaks, we pay particular attention to DNA alterations which are not directly related to or not causing DNA chain breaks. We refer to work conducted in vivo and in solution, leaving aside events related to alterations due to light, ionizing radiation and xenobiotics. For reviews about DNA degradation see for instance refs. 1–5.
In vivo studies
In vivo, DNA is degraded mainly by water and reactive oxygen species (ROS). Hydrolysis mainly leads to single-strand breaks following depurination. It also causes base deamination which is not followed by chain breakage [for instance cytosine can be converted into uridine (6)]. Other pathways including removal of pyrimidines (7) or phosphodiester hydrolysis (8) are much slower. Oxidation concerns both sugar and bases: attacks on deoxyribose generally lead to chain breaks or to formation of abasic sites; attacks on the bases generate a wide variety of modifications; some of them lead to the rupture of the N-glycosidic or phosphodiester bond, but the major modifications (8-oxo-gua and thymine glycol) do not. For reviews see refs. 4,9,10.
In vitro studies (solution)
Numerous studies on DNA degradation in solution have demonstrated that the main degradation pathway is an acid-catalyzed, water-independent, cleavage of the N-glycosidic bond, followed by water addition on the 2°C of the sugar at least at acidic or moderate pH. Subsequently, base-catalyzed β-elimination removes the phosphate (11–14). Direct elimination of the base has also been observed for guanine, but not for adenine (15). Oxidation also exists in solution. It results from ROS generated from triplet oxygen and water in the presence of catalyzing impurities such as metal ions or lipids (16,17). Base oxidation (16,18) and direct strand breaks (11,19) have also been observed. However, as in vivo, oxidation of bases is generally not immediately followed by the rupture of the phosphodiester or N-glycosidic linkages (4,20,21). This is especially the case with the major oxidation product, 8-oxoguanine (9). 8-oxoguanine can further react with lysine to give DNA–protein cross-links (22). In some rare instances, DNA–DNA cross-links induced by oxidation have been reported (23,24).
Ancient DNA
The fact that DNA is more stable in a solid state (‘solid state’ defines DNA that is no longer dissolved without necessarily being totally anhydrous) than in solution is widely accepted, although a few studies have reported that desiccation induces strand breaks and cross-links in spores (25). There are many examples of DNA preservation by various desiccation procedures (precipitation in ethanol, air drying or lyophilization) (26). Spectacular examples of this stability are the retrieval, polymerase chain reaction amplification and sequencing of DNA from up to 80 000-year-old biological remnants (27–30). It was found that besides being heavily fragmented, this ancient DNA contained large amounts of oxidized (28) or hydrolyzed bases (31) and interstrand cross-links (32–35). DNA–protein cross-links have also been reported to be a secondary consequence of oxidation (36,37).
These observations are strong support for the possibility of room-temperature conservation of DNA since, unlike ancient DNA, purified dehydrated DNA can be protected from water and oxygen. It should not suffer from either early post-mortem damage (through autolysis and microbial attacks) or contaminants that catalyze oxidation and lead to cross-links through the Maillard reaction (32,33).
Solid-state DNA degradation mechanisms and kinetics
There are few data on the mechanism(s) of DNA degradation in more controlled conditions. Depurination has been observed and depurination rates were measured on heated vacuum-dried DNA (38). In addition, depurination and rapid subsequent chain cleavage in oligodeoxynucleotides were observed by using various mass spectrometry techniques (39–41).
Atmospheric oxygen has been found to accelerate DNA decay in lyophilized rat liver, but not if the tissue was delipidated before storage. Likewise, there is no evidence for increased breakage from oxidation in dried purified lambda DNA (42). Working on aged desiccated colonies of Nostoc communae, Shirkey et al. (33) observed cross-links produced by Maillard products, but no detectable increase in the level of oxidized bases. It has also been reported that dehydration leads to DNA–protein cross-links in spores (25). In lyophilized pharmaceutical plasmid preparations, ROS production and probably oxidation could be modulated by addition or complexation of metal ions, but practically no effect on chain-breaking was observed (17,43).
In vacuo, the bases themselves are quite stable since it has been shown in pyrolysis experiments that while DNA is completely destroyed in a few minutes above 180°C (44), bases can be recovered after several hours of heating at 250°C (45) or 5 min at 450°C (46). Various thermal decomposition experiments indicate that, in gas phase, nucleosides are much less stable than bases and that N-glycosidic linkage is the most fragile site (5,45,47,48). More generally, studies on oligonucleotide fragmentation have revealed multiple possible mechanisms of chain breakage, most of them involving a preliminary base loss, for a review see ref. 41.
Solid-state reaction kinetics have been thoroughly studied, for instance on pharmaceutical preparations (for reviews, see refs 49 and 50). Several general observations are relevant to our topic. First, the reaction mechanisms occurring in solution are generally maintained in the solid state. In particular, acid-catalyzed reactions in solution still occur in the solid state. This is related to ‘pH memory’ due to the fact that when protonated in solution, a chemical group remains protonated in the solid state (51,52). Second, establishment of a solid state leads to a strong decrease in molecular mobility and consequently in chemical reactivity. This effect can be increased by using additives such as trehalose, which creates a vitreous matrix (53,54). Third, residual water can act either as a reactant or as a ‘plasticizer’ by increasing molecular mobility (50,53–55).
Regarding DNA, information from samples extracted from fossils or museum specimens are difficult to use because of the immediate post-mortem degradation events. Cherng et al. (56) reported that desiccated DNA could be stored for 10 months without visible degradation at room temperature. On the contrary, Shirkey et al. (33) showed that dried DNA stored over P2O5 underwent strong degradation in <72 h unless trehalose was added, and that even in the presence of the latter, degradation was quite evident after 17 days. However, the assay of Cherng et al. (genomic DNA sizing by nondenaturing agarose electrophoresis) is much less sensitive to degradation than that of Shirkey et al. (33; relaxation of a 12-kb plasmid). In the same paper, it was reported that DNA underwent aggregation in the absence of trehalose. Lyophilized plasmid DNA has also been used to study rates of chain breakage at room temperature, 40°C and 60°C (17,26). Strangely enough, these rates were almost insensitive to temperature (Figures 10 and 11). This apparent discrepancy is discussed in the section ‘Temperature dependence of chain-breaking rate: effect of residual water’. On the contrary, another study (38) showed that the kinetics of depurination of ‘vacuum-dried’ DNA followed Arrhenius’ law between 97°C and 180°C.
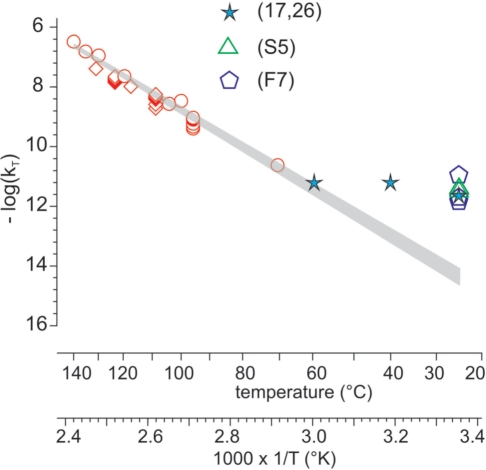
Figure 10.
Determination of room temperature degradation rate of DNA at low hydration according to Arrhenius’ model. Degradation rates (kT) were determined at temperatures (T°K) ranging from 70°C to 140°C in different conditions. Rates measured at 70°C and room temperatures are taken from the experiments shown in Figures 6–8. These values are compared to some literature data as indicated. The log10(kT) values were plotted versus 1/T. The upper and lower limits of the shaded area represent the confidence intervals of log10(kT) calculated with the delta method, taking into account values ranging from 70°C to 140°C, as described in Supplementary Data S2 (statistical analysis). (17,26): data from references 17 and 26; (F7): data from Figure 7; (S5): data from Supplementary Data S5 (determination of genomic DNA degradation rate in air and at room temperature).
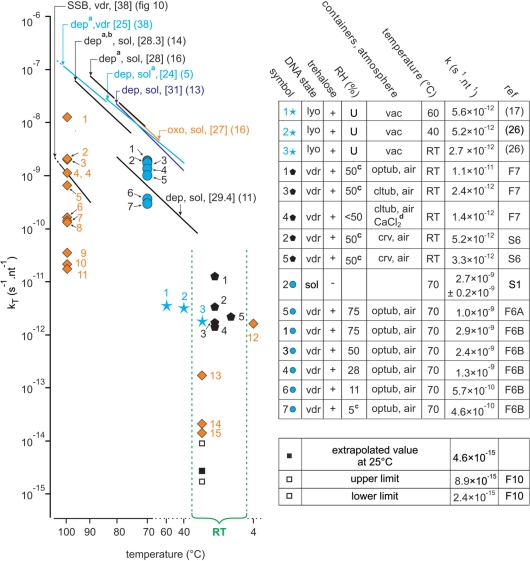
Figure 11.
Compilation of quantitative kinetic data from literature and our work. (Left figure) The straight lines are the Arrhenius representations corresponding to depurination (dep), single-strand breaks (SSB) and 8-oxodG (oxo) formation obtained from our work or from the literature. Some of them have been truncated. The corresponding Ea (kcal mol−1) are indicated in brackets. The reactions were conducted on samples which were vacuum-dried (vdr) or in solution (sol) DNA. acorrected to pH 7.4 according to (13); bcorrected for strandness according to (13); capproximate values; F6, F7 and F10: respectively Figures 6, 7 and 10; dCaCl2 inside a CaCl2- containing dessiccator (ineffective in providing a low RH atmosphere); diamonds: kinetic constants for 8-oxodG formation, numbers refers to Figure 4. Other symbols: single-strand breaking rates. (Right table) The term nt−1 is used to normalize the rates to one nucleotide to make the reaction rates independent of the size of the molecule. lyo: lyophilized; U: unknown; vac: sample kept under vacuum; vdr: vacuum-dried; crv: crimped vials; optub: open tubes; cltub: closed tubes; RT: room temperature; S1, S6: respectively Supplementary Data S1 and S6.
Solid-state DNA secondary structure
Another aspect of the storage of dried DNA concerns the preservation of its secondary structure. Since water strongly contributes to the secondary structure of DNA (for a review, see ref. 57), the consequences of dehydration should be considered. It is well known that upon dehydration [between 92% and 70% relative humidity (RH)], DNA undergoes conformational changes from form B to form A (58) (for reviews see refs 59 and 60). Moreover, below 70–50% RH at room temperature, natural DNA undergoes denaturation. Destacking of the bases and rupture of hydrogen bonds has been observed by ultraviolet (UV) and infrared (IR) spectroscopy (61–63). Mass spectroscopy experiments have shown that oligodeoxynucleotide duplexes can still exist in vacuo (64) but that they are thermodynamically unstable and have a short lifetime (40). On the contrary, double-stranded homopolymers do not denature (65–67). This difference could be due to differences in electrostatic interactions between double helices induced by removal of water (68–70) (for a review see refs 57 and 71).
Dehydration-induced denaturation is entirely reversible upon rehydration unless the dried DNA has been heated (44). This loss of reversibility indicates that there exists a possibility of evolution over time of the DNA secondary structure; however, no study has yet been carried out on the evolution of solid-state DNA secondary structure. By contrast, poly(dG)•poly(dC) denaturation upon heating is reversible (67). It has also been reported that trehalose has a strong stabilizing effect on DNA secondary structure. In the presence of trehalose, solid-state natural DNA, even heated to 120°C, does not denature (72). This stabilization effect has been explained by a screening of the negative charges by trehalose binding to the phosphates (water replacement hypothesis) or a network built by hydrogen bonding between trehalose and DNA, which reduces the structural fluctuations of DNA (vitrification hypothesis) (72,73). This will be discussed further in the ‘Results and discussion’ section in the section on secondary DNA structure.
Finally, a molecular dynamic simulation has been used to study DNA double helix in the gas phase. Rueda et al. (74) concluded that in vacuo, the DNA helix is highly distorted with a very elongated conformation. Part of the base pairing is lost, the stacking being maintained with the bases protruding outside the helix. However, these conclusions strongly depend on how the DNA molecule is considered to be charged. If the DNA is fully charged, no helical structure is maintained.
In summary, removal of water increases DNA chemical stability first by inhibiting hydrolysis and oxidation and second by decreasing molecular mobility. Conversely, residual water may act as a plasticizer as well as a reactant or a catalyst. The fastest degradative event in the solid state seems to consist in an acid-catalyzed, water-independent base loss followed by or simultaneous to chain breakage via a variety of mechanisms not necessarily involving water. However, oxidation, cross-linking and the action of many agents, some possibly stabilizing (for instance, Tris or trehalose) (33,75,76) or more generally destabilizing (such as metallic ion contaminants), cannot be neglected. Finally, dehydration of natural DNA leads to a strong distortion of its secondary structure, probably ending in reversible denaturation.
Here, we report an empirical study that evaluates the physico-chemical stability and the lifetime of DNA at low hydration with the final aim of establishing and validating conditions for long-term room-temperature storage.
MATERIALS AND METHODS
DNA preparation
We purposely used standard DNA extraction procedures in order to work with the DNA quality generally used in most laboratories.
Plasmids (pBAD and pcDNA3, 5.4 kb or pEGFP, 4.9 kb) were produced in Escherichia coli. The transformed bacteria were cultivated in Luria Bertani (LB) broth containing 50 µg ml−1 ampicillin. The plasmids were isolated via alkaline lysis according to (77) and purified using a silica column (Qiagen or Promega). The pEGFP plasmid was desalted on Sephacryl® S-400 before use. They were stored at 4°C or –20°C.
Equine genomic DNA was extracted from blood using the Puregene® kit (Gentra) according to the manufacturer’s instructions or a standard phenol:chloroform protocol. Briefly, red blood cells were lysed by a 0.16 M NH4Cl, 10 mM KHCO3 and 1 mM EDTA solution at room temperature. Then white blood cells were lysed overnight at 37°C in 5 mM NaCl, 2 mM EDTA, 1% SDS and 100 µg ml−1 proteinase K. Two phenol:chloroform:isoamyl alcohol (25 : 24 : 1) extractions were performed and followed by a chloroform:isoamyl alcohol (24 : 1) extraction. To the aqueous phase were added 2 vol. of absolute ethanol and 0.1 vol. of 5 M NaCl for precipitating the DNA and the pellet was washed with 70% ethanol. DNA was finally dissolved in TE (10 mM Tris–HCl pH 8.0, 1 mM EDTA) and stored at –20°C or −80°C.
Agarose gel electrophoresis and determination of supercoiled plasmid content
Plasmid DNA (250 ng) or genomic DNA samples (250 ng to 2 µg) were loaded onto 0.8–1% agarose gels and submitted to electrophoresis in TAE 0.5 × (40 mM Tris acetate, 1 mM EDTA) electrophoresis buffer. Gels were stained 30 min in 0.5 µg ml−1 ethidium bromide or in 1/10,000 SybrGreen® I (Molecular Probes). Gels were photographed with a Visiomic digital Imaging apparatus (Genomic, Archamps, France) equipped with an ethidium bromide or Sybrgreen® fluorescence filter (555 nm). The images were analyzed with the Kodak Digital Science 1D Image analysis software. The fluorescence intensity of supercoiled plasmid and the sum of the fluorescence intensities of relaxed and linear forms were measured.
The proportion of supercoiled plasmid (SC content) in the samples was calculated either directly from the fluorescence intensity values with Sybrgreen® stained gels, or by correcting (for the ethidium bromide-stained gels) the fluorescence intensity of the supercoiled form by 1.4 factor as previously described (78). Alternatively, (for both dyes) SC content was calculated by reference to standards (supercoiled, relaxed and/or linear plasmid) run in the same gel. In our conditions, differences in rate constants between these methods were negligible. For an example, see Supplementary Data S1 (Plasmid degradation in solution). The kinetic constants were classically determined by fitting the curves to data points assuming an exponential decrease (11,79,80) Supplementary Data S2 (Statistical analysis)].
Melting curves
DNA melting was monitored by UV absorption on a Uvikon 940 spectrophotometer with a thermostated cell holder connected to a Huber cryothermostat driven by a Huber PD410 programmer, as described by (81). The temperature was measured by means of a Pt probe immersed in a water cuvette placed in the sample holder. Samples (6 µg) were diluted in cacodylate 20 mM sodium, 1 mM EDTA buffer, pipetted into 1-cm path length quartz cuvettes and preincubated in the cell holder at 25°C for 30 min. The temperature was raised 0.5°C/min from 25°C to 95°C.
Hyperchromicity measurements
A260nm of samples was measured before (native) and after heat denaturation and immediate cooling in ice (denatured). The relative hyperchromicity was defined as either: (A260, denatured – A260, native)/A260, native when looking for cross-links or (A260,denatured–A260, native)/A260, denatured when looking for denaturation.
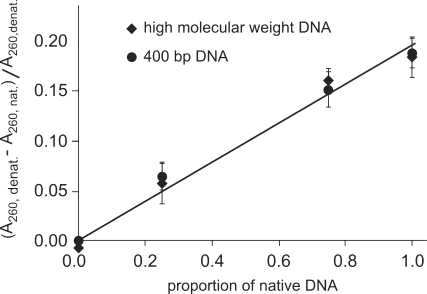
We checked the linearity and the sensitivity of this assay by applying it to a series of mixtures of native and previously denatured DNA (Figure 1).
Figure 1.
Hyperchromicity: linearity and sensitivity of the assay. Relative hyperchromicity (A260, denatured–A260, native)/A260, denatured) of mixtures of native and previously denatured DNA samples for high-molecular-weight and 400-bp DNA. The straight lines drawn through data points are y = 0.1958x (R2 = 0.981) and y = 0.953x(R2 = 0.9847) for high-molecular-weight and 400-bp DNA, respectively.
Detection of apurinic (AP) sites by cleavage with APE-1
Preparation of a partially depurinated DNA control
Using the method described in (12), pBAD plasmid DNA (0.5 mM nt) was partially depurinated by heating 15 min at 70°C in 0.1 M NaCl, 0.01 M sodium citrate and 0.01 M Tris–HCl at pH 5.2. Depurinated DNA was then precipitated 2 h at –20°C with 2 vol. of absolute ethanol, 0.1 vol. of 5 M NaCl and 1 µl of 20 mg ml−1 glycogen. After a 20-min centrifugation, the pellets were washed three times with 70% ethanol and suspended in deionized water.
Cleavage at apurinic sites
Human apurinic/apyrimidinic endonuclease Ape-1 (New England Biolabs) was used to cleave the phosphodiester backbone immediately 5 to an AP site to generate a single-strand DNA break according to the manufacturer’s instructions. The samples were analyzed by agarose gel electrophoresis and ethidium bromide staining. The number of cleaved sites was estimated from SC content as described.
Measurement of 8-oxodG
For a 155-µl final volume, DNA (15–60 µg) was incubated with 21 µl of nuclease P1 buffer (300 mM sodium acetate and 1 mM ZnSO4 pH 5.3) and 10 µl (10 units) of nuclease P1 at 37°C for 2 h. Dephosphorylation of samples was achieved by the addition of 23 µl of 500 mM Tris–HCl and 1 mM EDTA pH 8.0 buffer and 1 µl (1 unit) of alkaline phosphatase (Roche) at 37°C for 1 h. About 100 µl of the hydrolysate were analyzed by HPLC-EC.
High-pressure liquid chromatography/electrochemical detection (HPLC-EC) measurement of 8-oxodG was performed with a Beckman Series pump system equipped with a pulse damper, a cooling autosampler and a spectrophotometric detector connected to a Kontron amperometric detector. The electrochemical cell was equipped with a glassy carbon working electrode operating at 650 mV versus an Ag/AgCl reference electrode. The system was operated at 0.5-nA full-range detection. The deoxynucleosides was detected at 254 nm. HPLC separation was obtained on an Uptisphere ODB C18 column (5-µm particle size, 250 × 4.6 mm) equipped with an Ultrasphere ODB C18 guard column (5-µm particle size, 50 × 4.6 mm) (Interchim,). The mobile phase used for isocratic elution of 8-oxodG was composed of 12.5 mM citric acid, 15 mM sodium acetate, 30 mM NaOH pH 5.3 with 10% methanol at a flow rate of 0.8 ml/min. The injection volume was 100 µl. The dG concentration was estimated from the UV peak and the 8-oxodG concentration from the electrochemical signal. Results are expressed as the number of 8-oxodG residues per 106 dG.
To calculate the 8-oxodG formation rate per nucleotide, we first corrected the measured value by the dG content of mammalian DNA (we took 21.5% for all of them). Then, considering that the level of 8-oxodG was always below 1% of the amount of dG, meaning that we were in the linear part of the kinetics, we calculated oxidation rates by simply dividing the values obtained (after subtracting the corresponding control) by the incubation time in seconds.
For addition of ferric ions, we prepared 35-µg DNA aliquots in 118 µl TE containing 40 molecules of trehalose per nucleotide and a large excess (89 equivalents per nucleotide) of Fe3+ ions. The aliquots were vacuum-dried as described below.
DNA dehydration, incubation conditions and rehydration
Dehydration and rehydration
About 10–20 µl of a plasmid DNA solution (1–5 µg of DNA) were deposited on the bottom of 0.2-ml cylindrical glass inserts. All samples were vacuum-dried for 30 min to 1 h (Thermo Savant) before incubation. In most experiments involving heating, DNA was dried in the presence of trehalose (40 molecules per nucleotide). Trehalose was included because we noticed that when DNA was stored in air, most of the material was occasionally impossible to redissolve, probably because of irreversible aggregation or adsorption, as previously noted by others who also showed that trehalose could prevent this phenomenon (33,82); Supplementary Data: S3 (Aggregation and inhibition by trehalose) and also the section ‘Evolution of DNA secondary structure of dehydrated DNA’.
For rehydration, vials or tubes were opened and inserts were placed in 1.5-ml microtubes. Samples were then rehydrated with water or TE buffer at room temperature or by two successive 15-min incubations at 37°C.
Incubation conditions
Open air (generally around 50% RH): the inserts were placed in capped or uncapped 1.5-ml Eppendorf-type microtubes.
Open air at 11%, 28%, 50% and 75% RH: the inserts were placed in uncapped tubes inside closed glass bottles containing saturated solutions of LiCl, MgCl2, NaBr and NaCl (prepared and equilibrated at incubation temperature).
Air at low RH: the inserts were placed in tubes which were subsequently put into ‘trap-bottles’ (Duran® ISO bottles containing P2O5 with vacuum grease-coated caps).
Anhydrous argon atmosphere: 2-ml vials with inserts containing vacuum-desiccated DNA were equilibrated in a dry box containing an anhydrous (H2O < 1 p.p.m.) and anoxic (O2 < 0.1 p.p.m.) argon atmosphere, and the silicon stoppers and tear-off aluminum seals were crimped on the top of the vials with a Wheaton hand-operated crimper.
Incubation in the presence of CaCl2. DNA samples were kept in a dessiccator with CaCl2. This proved to be ineffective probably because of the large volume of the dessiccator.
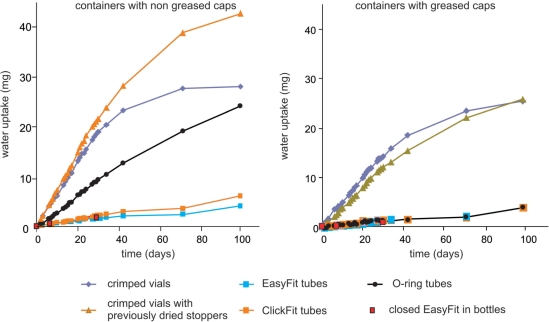
Gravimetric control of air tightness of containers
The various containers were crimped glass vials (Wheaton, VWR, operated as described above), 1.5-ml plastic tubes (‘Easy fit’ and ‘Click fit’ Treff microtubes (Treff AG), Simport O-Ring screw cap microtubes) and glass bottles (Duran® ISO) with or without greased caps. The small containers received ∼1 g of CaCl2 and were regularly weighed. Air tightness of the bottles was checked with open 1.5-ml tubes loaded with CaCl2 (Figure 2). Empty containers were weighed in parallel as controls (data not shown).
Figure 2.
Control for air tightness of containers. The containers were filled with 1 g CaCl2 and regularly weighed. The lines serve as visual guides.
Use of P2O5
Phosphorus pentoxide was effective at room temperature. However, we occasionally noticed a rapid degradation of DNA samples (data not shown). This was probably due to P2O5 dust, because this effect was prevented by covering the insert with aluminum foil. This probably explains why P2O5 seemed to accelerate DNA degradation, as reported in the literature (33). When heated to 90°C in closed bottles, we witnessed a browning of the plastic tubes and an acceleration of DNA degradation. This was probably due to traces of vapor emitted from heated P2O5 or phosphoric acid (boiling point: 158°C).
Accelerated degradation studies
Vacuum-dried samples were heated at temperatures ranging from 70°C to 140°C either in an oil bath or in an oven equipped with a sand bath. A thermometer was placed in an empty insert to control the inner temperature of the samples. Samples were sequentially removed from the oven or water or oil bath, quickly cooled on ice, and stored at 4°C until rehydration and DNA analysis. The first time point (for time 0) was taken after allowing the sample to reach temperature (and/or hygrometry) equilibrium.
Preparation of different-sized DNA
Genomic DNA fragments of different sizes were obtained by sonication (Branson sonifier 150) at power 3. DNA fragment sizes were checked by agarose gel electrophoresis.
RESULTS AND DISCUSSION
Initially, the work reported here was aimed at estimating the lifetime of dehydrated DNA. Considering that the DNA degradation rate is too slow to be conveniently measured at room temperature, we ran DNA chain-breaking kinetics at temperatures ranging from 70°C to 140°C. Chain-breaking was monitored by measuring the relaxation of a supercoiled plasmid. However, the chain-breaking rate is not the only parameter of the degradation rate since many base modifications do not generate chain breaks. Most of these modifications are caused by chemicals and are not relevant here. However, some others, mainly cross-links or oxidized bases, can either bias or prevent further DNA analysis, for instance, by impeding the action of DNA polymerases (34,83). Therefore, DNA stability is overestimated because of cross-linking and oxidative events. We have designed experiments to estimate the level of these events.
DNA–DNA cross-links
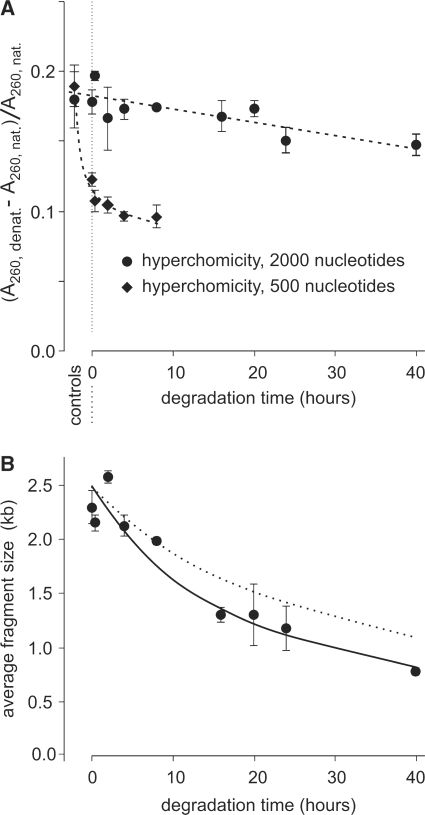
To be able to detect cross-links in the context of degradation, we worked on two different-sized DNA. Calf thymus DNA samples (average single-strand sizes: 2000 nt and 500 nt) were heated in air at 110°C in the presence of trehalose. At each time point, the absorbance of the sample was measured immediately after rehydration (native) and then after heating to 95°C and rapid cooling (denatured).
Figure 3A shows the relative hyperchromicity for samples of both sizes as a function of heating time at 110°C, while Figure 3B shows the average fragment size for the longer fragment. This size decreased at a rate in agreement with the rate calculated from the plasmid relaxation data (Figure 10) (plasmid relaxation should not be affected by a moderate number of cross-links). This indicated that cross-links were not as abundant as chain breaks. However, in both samples, there was a decrease in hyperchromicity with a stronger decrease in the shorter fragments. This was not due to cross-linking but rather to the appearance in the samples of denatured DNA, with a larger proportion in the smaller samples. This is dealt with in greater details in the section devoted to the evolution of the secondary structure of DNA.
Figure 3.
Control for cross-links. (A) Relative hyperchromicity (A260, denatured – A260, native)/A260, native) of DNA populations of 2000-nt and 500-nt average sizes of fragments after vacuum drying and heating kinetics at 110°C. Some error bars are smaller than the symbols. The lines serve as visual guides. (B) Average size of the large fragment population measured by denaturing gel electrophoresis. The continuous line was calculated by curve-fitting (giving a corresponding degradation rate of 5.5 × 10⁻⁹ s−1 nt−1). The dotted line represents the decrease in average fragment size calculated from plasmid degradation data (degradation rate: 3.5 × 10⁻⁹ s−1 nt−1 at this temperature). Some error bars are smaller than the symbols.
8-oxodG measurements
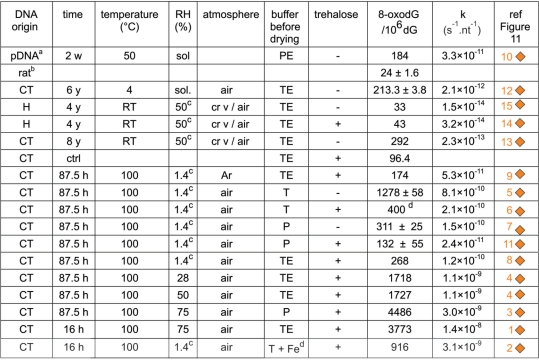
DNA oxidation was assessed by measuring the amount of 8-oxodG in DNA. Figure 4 shows the results obtained from controls and from DNA samples stored or incubated in various conditions.
Figure 4.
Level and rate of 8-oxodG formation as a function of incubation conditions. afrom (11); bfreshly extracted; capproximate value; d1 mM Fe3 + before drying; w: weeks; y: years; sol: in solution; c rv: crimped vials; P: phosphate buffer; PE: phosphate buffer + EDTA; T: Tris buffer; TE: Tris buffer + EDTA. The term nt−1 is used only to normalize the rates to one nucleotide to make the reaction rates independent of the size of the molecule.
First, at 100°C, in air, the production rate of 8-oxodG in DNA dried from a TE solution was 1.2 × 10⁻¹⁰s−1 nt−1, which is about 200-fold lower than the solution rate interpolated from (16) for this temperature. Second, trehalose seemed to have an inhibitory effect on 8-oxodG formation at 100°C, (decreasing from 8.1 × 10⁻¹⁰ s−1 nt−1 to 2.1 × 10⁻¹⁰ s−1 nt−1 and from 1.5 × 10⁻¹⁰ s−1 nt−1 to 2.4 × 10⁻¹¹ s−1 nt−1 in Tris or phosphate buffers respectively) but not at room temperature. Third, partially removing oxygen had only a moderate effect (decreasing from 1.2 × 10⁻¹⁰ s−1 nt−1 to 5.3 × 10⁻¹¹ s−1 nt−1). This could mean that oxidation necessitated only a low concentration of oxygen to occur. Fourth, atmospheric humidity accelerated the rate of oxidation 100-fold and 30-fold between 1.4% RH to 75% RH in TE and phosphate buffer, respectively. Addition of a saturating amount of Fe3+ ions also seemed to enhance the rate of oxidation. In summary, on one hand, DNA oxidation did occur in air, and, on the other hand, the presence of water accelerated the rate of oxidation.
However, while in vivo, 8-oxodG formation is widely considered as a major DNA oxidation product, the situation could be quite different in the solid state. Future work will therefore adopt more general approaches such as the use of enzymes (e.g. Endo III/EndoVIII, UNG, etc.) able to detect oxidized or modified bases and the chemical analysis of the DNA degradation products.
Control for the absence of accumulation of abasic sites during DNA heating at low hydration
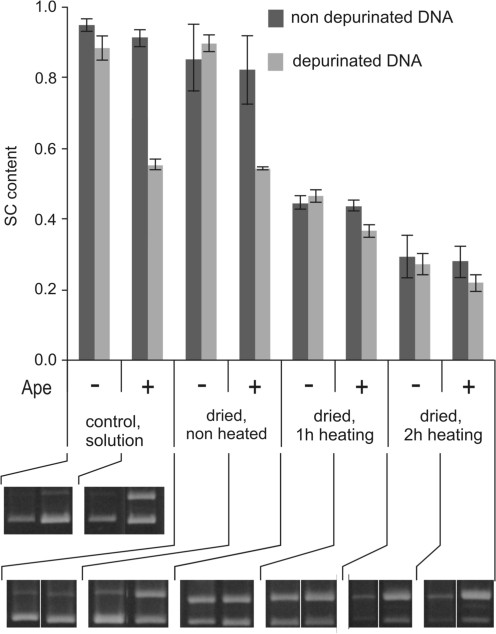
It may be thought that acid-catalyzed depurination is still present in the solid state. Indeed, mechanisms occurring in solution have generally been shown to be maintained in the solid state (for a review see ref. 49), and depurination has been observed in vacuo or in solid-state DNA (38–40). It is possible that at low hydration, subsequent chain breakage does not occur or occurs very slowly leading to accumulation of abasic sites. To estimate the extent of accumulation, we used the Ape enzyme to reveal apurinic sites in heated DNA. Figure 5, ‘control solution’, shows that a partially depurinated plasmid (positive control) treated with Ape enzyme lost 28% (0.91–0.63) of its SC content, while the undepurinated control lost only 2% (0.96–0.94) of it. The same was true if the depurinated plasmid and the undepurinated control were dried, immediately rehydrated and treated with Ape (Figure 6, ‘dried’, ‘nonheated’): the losses were respectively 30% (0.92–0.63) and 3% (0.89–0.86). These data showed first that the positive control had been significantly depurinated and that the enzyme treatment detected the depurinated positions, and second, that mere drying did not induce breaks at abasic sites.
Figure 5.
Control for the absence of accumulation of abasic sites during DNA heating at low hydration. Quintuplicate depurinated or undepurinated plasmid DNA samples were vacuum-dried, then heated for 0, 1 or 2 h at 118°C, rehydrated and treated or not with Ape to cleave abasic sites in parallel to control samples kept in solution. SC content was determined as described in ‘Materials and methods’ section. On the gels, the upper and lower bands are the relaxed (OC) and supercoiled (SC) plasmid forms.
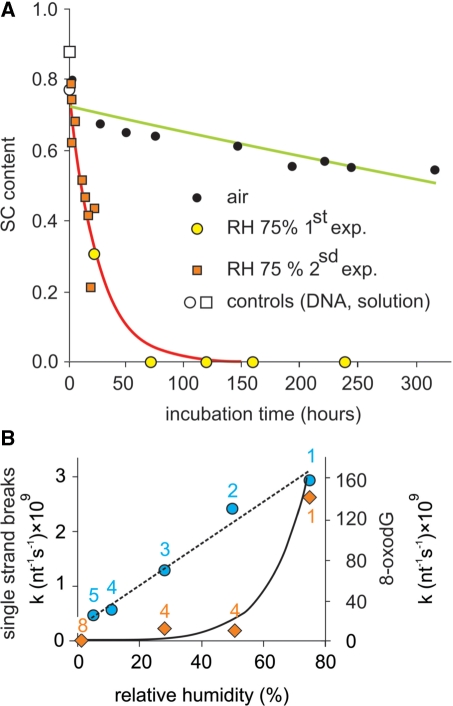
Figure 6.
DNA degradation as a function of RH. (A) Plasmid DNA samples containing trehalose were incubated at 70°C in capped bottles containing an NaCl saturated solution (giving a RH of 75%). DNA samples were then rehydrated and the plasmid SC content was determined on Sybrgreen®-stained agarose gel after electrophoresis (‘Materials and methods’ section). The kinetic run in open air is redrawn from the 70°C experiment in Figure 10. (B) Closed circle: same experiment with additional RH values done with another plasmid (which consistently gave higher degradation rates than that used for the other experiments). The numbers refer to Figure 11. The dotted straight line serves as a visual guide. Closed diamonds: 8-oxodG rate formation at 100°C. The continuous line is an exponential fit through the circles. The 8-oxodG formation rates were determined from single measurements and should be viewed more as comparisons than absolute values. The numbers refer to Figure 4.
When the plasmids were incubated at 118°C for 1 and 2 h, the difference between Ape- treated or untreated depurinated plasmid disappeared almost completely. Therefore, upon heating all the previously depurinated sites had been cut. Moreover, the heated undepurinated plasmid lost 60% and 61% of SC content, respectively before and after Ape treatment, suggesting that no abasic sites had accumulated during the treatment at 118°C. The same was true for the depurinated plasmid, the difference before and after Ape treatment being insignificant. This meant that any existing abasic site had been cut upon heating and that no accumulation was detectable in the conditions we used for our kinetics.
Chain-breaking in air at different relative humidities, at 70°C or room temperature
We first compared DNA degradation rates at 70°C. Figure 6A shows that at 75% RH, the SC content dropped 10 times faster than in open air (k = 1 × 10⁻⁹ s−1 nt−1 and 1 × 10⁻¹⁰ s−1 nt−1, respectively). As a control, we ran a kinetic in TE buffer [Supplementary Data S1(plasmid degradation in solution)], giving a k70°C = 4.42 × 10⁻⁹ s−1 nt−1. In a separate experiment, we measured the degradation rates as a function of RH to check for an eventual threshold below which the degradation rate would no longer depend on water content. RH was varied from 75% to an estimated 5%. Indeed, at room temperature and in open air, increasing temperature from 25°C to 70°C increases 10-fold the saturating water vapor pressure, leading consequently to a 10-fold RH decrease. In usual laboratory conditions, this leads to an RH decrease from 50% to 5% and a concomitant decrease in DNA-bound water content according to the isotherms of binding water to DNA (44,84). Such a water release was confirmed in our conditions by control gravimetric analyses [Supplementary Data S4 (DNA water content, gravimetric analysis)] performed to determine the minimum time and temperature necessary to obtain complete DNA dehydration in open air. At 112°C and above, we could no longer detect DNA-bound water. Figure 6B shows that between 75% and 5%, the chain-breaking rate decreased almost linearly with RH so there was probably no threshold, although it could not be formally excluded that such a threshold existed for a value below 5%. We also noticed that the water rate dependency was very different for oxidation and chain-breaking. This could be expected since water is likely to have different actions on these two phenomena (see discussion below in the ‘Temperature dependence of chain-breaking rate: effect of residual water’ section).
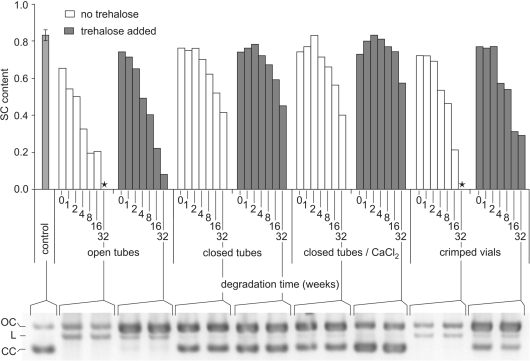
In a second series of experiments, in order to optimize the conservation conditions, we compared chain-breaking rates at room temperature in the presence or absence of trehalose, in open or closed tubes, in closed tubes inside a box containing CaCl2 and in vials crimped under a dry argon atmosphere. Figure 7 shows that in all the conditions tested, DNA degradation at room temperature was rather fast and that, surprisingly, stability was not increased in the crimped vials or only marginally in the presence of CaCl2.
Figure 7.
Plasmid relaxation at room temperature in various conditions. Plasmid DNA samples with or without trehalose were vacuum-dried in 0.2-ml glass inserts and stored in ambient air, in open or closed tubes, in closed tubes inside a box containing CaCl2 or in vials sealed (crimped) under dry argon. After 0–32 weeks, samples were rehydrated and their supercoiled content was determined on Sybrgreen®-stained agarose gel electrophoresis as described. Controls consisted in untreated plasmid samples kept in solution at 4°C. The histogram represents plasmid SC content. The gel performed after 32 weeks of storage is a representative example of the different analyses. On the gel, the upper, intermediate and lower bands are relaxed (open circle), linear and supercoiled forms, respectively. (*): sample with no SC left.
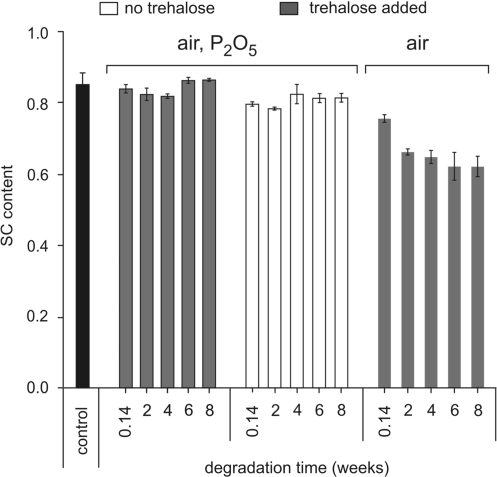
These facts led us to conclude that our different containers, and especially the crimped vials, were not fully airtight. This was confirmed by a series of gravimetric controls (‘Materials and methods’ section, Figure 2 and ref. 85). We then concluded that in all the closed containers we were using, a constant and rather rapid exchange with the outside atmosphere was taking place and that, in the box, water absorption by CaCl2 was too slow for this desiccant to have more than a slight impact on the internal RH. The experiment was then repeated with glass bottles containing the more potent desiccant P2O5. Figure 8 clearly shows that stability was improved to the point that no degradation could be detected after a 2-month period, while at 75% RH or under ordinary atmosphere, the degradation clearly appeared.
Figure 8.
Plasmid relaxation at room temperature and low hydration. Triplicate plasmid DNA samples, with or without trehalose, were vacuum-dried in 0.2-ml glass inserts and placed in 1.5-ml tubes. The tubes were kept in open air or placed in bottles containing P2O5 with vacuum grease-coated caps, each bottle containing only one tube to avoid water uptake during removal of tubes. After incubation, samples were rehydrated, submitted to electrophoresis on agarose gel and their supercoiled content was determined after Sybrgreen® staining. The controls were plasmid samples kept in solution at 4°C or vacuum-dried and kept at –20°C and run on the different agarose gels.
The degradation rates measured at room temperature varied from 1.4 × 10⁻¹² s−1 nt−1 to 1.1 × 10⁻¹¹ s−1 nt−1. They were in good agreement with those determined by denaturing gel analysis of high molecular weight genomic DNA stored for 7 years at room temperature without trehalose in crimped vials: 3.3 × 10⁻¹² ± 0.6 × 10⁻¹² s−1 nt−1. Although originally crimped in anoxic and anhydrous atmosphere, these samples had to be considered as stored in air most of the time [see Supplementary Data S5 (Determination of genomic DNA degradation rate in air and at room temperature)]. These figures were about 10-fold higher than the rate of 8-oxodG formation in air at room temperature (2.3 × 10⁻¹³ s−1 nt−1). However, since 8-oxodG is considered to be only 5% of the oxidized bases, hidden oxidative lesions at room temperature could appear at roughly the same rate as chain breaks.
Regarding trehalose action, although this sugar was clearly useful to prevent DNA losses [see Supplementary data S3 (aggregation and its prevention by trehalose)], it did not show any clear improvement regarding its ability to protect DNA against degradation.
Temperature dependence of chain-breaking rate and effect of residual water
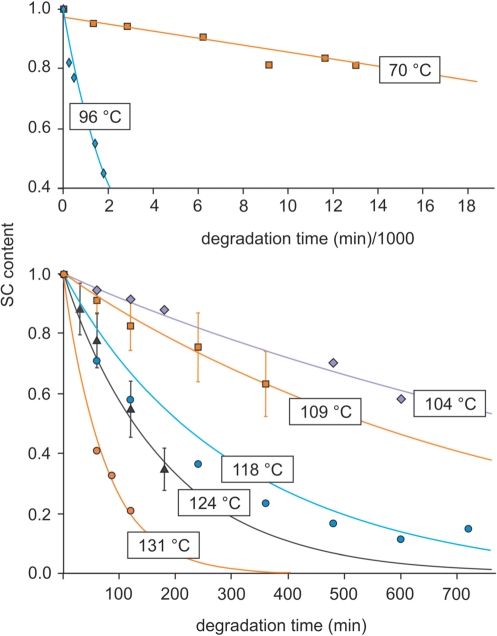
Degradation kinetics were run at temperatures ranging from 70°C to 140°C. A first series was run in open air in the absence of trehalose. A second series (Figure 9) was run with a different plasmid in the presence of trehalose in vials crimped under anoxic and anhydrous atmosphere. However, we belatedly realized that the second series of samples also had to be considered as having been run in air because of the lack of air tightness of the vials. As explained in ‘Materials and methods’ section, it was not possible to run kinetics in the presence of P2O5.
Figure 9.
Degradation kinetics at various temperatures. In this example (second series), plasmid DNA samples containing trehalose were vacuum-dried and sealed under controlled anhydrous and anoxic argon atmosphere (but due to leakage, these conditions were maintained only briefly, see text). The crimped vials were heated at temperatures ranging from 70°C to 140°C, DNA samples were rehydrated and the SC contents were determined on Sybrgreen®-stained agarose gel after electrophoresis (‘Materials and methods’ section). The first and second panels show respectively data for 70°C and 96°C and for temperatures ranging from 104°C to 131°C.
In Figure 10, log10(k) obtained from all the kinetics were plotted as a function of 1/T.
First, we determined that the chain-breaking rate at 100°C was 1.2 × 10⁻⁹ s−1 nt−1 while according to Figure 4, the 8-oxodG production rate was 10-fold lower: 1.2 × 10⁻¹⁰ s−1 nt−1. This likely meant that in these conditions, the overall oxidation rate was again similar to the chain-breaking rate.
Second, considering the temperature dependence of the chain-breaking rate, several parameters have to be taken into account. According to the literature and the experiments reported above, two main pathways lead to DNA degradation in air: oxidation and acid-catalyzed depurination (or direct elimination). With regard to chain-breaking, oxidation is probably a minor pathway because chain-breaking in the solid state is almost insensitive to the presence of metal ions (17). At high temperatures, DNA is almost completely dehydrated and lowering the temperature induces two opposing effects. On the one hand, there is a tendency for the degradation rate to decrease due to a decreased molecular mobility and chemical reactivity according to Arrhenius’ law. On the other hand, the water content increases. Water tends to accelerate degradation rates through a ‘plastifying’ effect that enhances molecular mobility and by acting as a reactant for hydrolysis or the production of ROS. This combination should be noticeable even in closed vials if the preparation containing DNA is not completely dried and if its volume is much smaller than the volume of the container. Both situations have been encountered (26,86). Water can also originate from additives such as trehalose added to DNA in large amounts.
Above 70°C, the temperature dependence of the chain-break kinetic constants followed the Arrhenius model. This means that either the base depurination pathway was predominant over oxidation-induced chain-breaking or that both reactions had similar activation energy, the latter hypothesis being less likely. At lower temperatures, the data points drawn from our experiments and from Anchordoquy and Molina’s data (stars on the graph) are systematically above the straight line. In addition, as the temperature decreases, the deviation is greater.
This situation is to be expected from the above-mentioned discussion and it can be concluded that above 70°C and even more above 110°C, the chain-breaking rates were relatively independent from water and that the value (4.6 × 10⁻¹⁵ s−1 nt−1) obtained by extrapolation between 70°C and 140°C could be tentatively taken as corresponding to the chain-breaking rate at room temperature in the absence of water. Furthermore, in the absence of oxygen and consequently without oxidation, this likely remains true, so this rate might approximate the actual degradation rate at room temperature in the absence of both oxygen and water.
A statistical analysis [Supplementary Data S2 (statistical analysis)] of the data obtained between 70°C and 140°C gave an extrapolated k25°C ranging from 2.4 × 10⁻¹⁵ s−1 nt−1 to 8.9 × 10⁻¹⁵ s−1 nt−1 (equivalent to 1–40 cuts/105 nucleotides/century).
The apparent activation energies which could be deduced from our data are 36–38 kcal mol−1 or 39–45 kcal mol−1 respectively, depending on whether we take all the data into account or not. These activation energies were different from those found for depurination and oxidation (27–31 kcal/mol) (11,13,14,16), probably because of the contribution of molecular mobility. Quantitative data from ours and from literature are compiled Figure 11.
Evolution of the secondary structure of dehydrated DNA
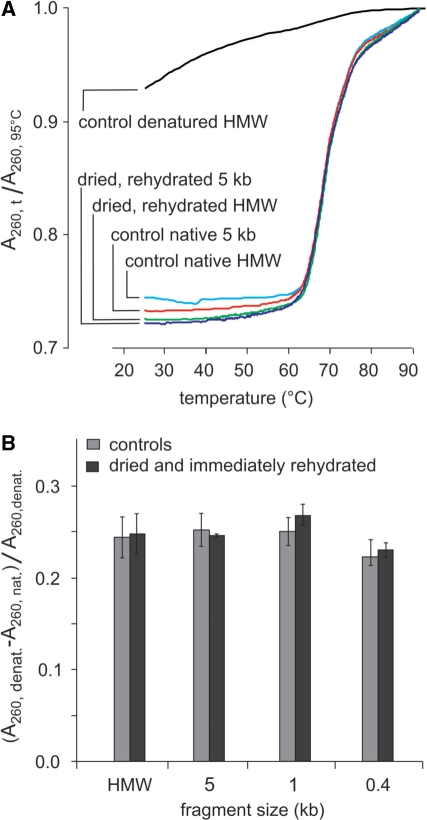
Another parameter to be considered for room-temperature conservation is the secondary structure of solid-state DNA. Previous studies have shown that, at room temperature, natural DNA undergoes a reversible denaturation upon dehydration. We confirmed this reversibility since melting curves run on high-molecular-weight molecules and samples fragmented to an average of 5 kb (Figure 12A) were undistinguishable from the undried DNA control.
Figure 12.
Hyperchromicity as a function of fragment size of dehydrated and immediately rehydrated DNA. (A) Melting analysis of vacuum-dried and rehydrated high-molecular-weight or 5-kb genomic DNA samples. Controls in solution are native or heat denatured DNA. HMW: high-molecular- weight DNA. (B) Relative hyperchromicity (A260, denatured–A260, native)/(A260, denatured) of DNA populations of decreasing fragment sizes before and after vacuum drying and immediate rehydration (measures done in triplicate).
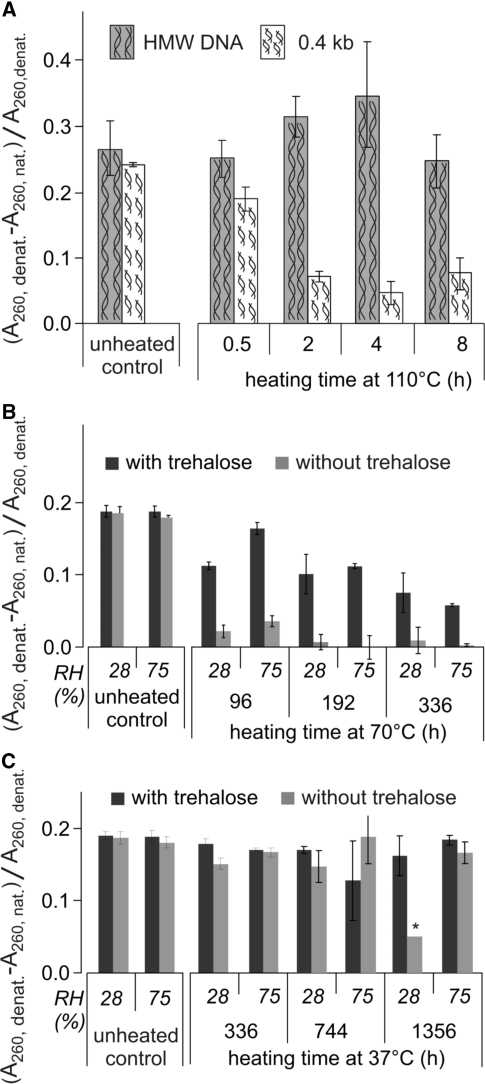
The experiment reported in Figure 12B extended this observation to smaller fragments. However, the results in Figure 3 suggested that upon heating at 110°C, some of the small DNA fragments underwent irreversible denaturation. For this reason, we studied the double-strand content in DNA fragments as a function of RH, fragment size, heating time, temperature and presence or absence of trehalose.
Figure 13A shows that in the absence of trehalose at 110°C, 200–400-bp fragments underwent an almost complete loss of reversibility of denaturation in 2–4 h. Figure 13B shows that the rate of loss was considerably lower in the presence of trehalose at 70°C. As expected, the kinetics at 110°C, 70°C and 37°C showed that this phenomenon was also strongly temperature dependent. Figure 13B and C show that the rate of loss was very similar at 28 and 75% RH. However, more experiments run at other humidity levels should be performed before concluding that the phenomenon is RH-dependent or -independent.
Figure 13.
Evolution of hyperchromicity as a function of size, presence of trehalose, RH and heating time. (A) evolution of hyperchromicity at 110°C in the absence of trehalose for high-molecular-weight DNA and 0.4-kb fragments. Controls were equilibrated for one night at the temperatures and in the atmospheres used in the experiments. All measures were done in triplicate. (B) Evolution at 70°C for 0.4-kb fragments in the presence or absence of trehalose and 28% RH and 75% RH. The controls were done as in (A). (C) Same as in (B), at 37°C, *average of only two measures.
To the best of our knowledge, this is the first time such an evolution of solid-state DNA has been reported. In the absence of trehalose, this may have some consequences for short fragments. However, for long fragments, the time required for the phenomenon to appear would be extremely long at room temperature.
These findings could be interpreted as follows. By removing the screening effect of water, dehydration might allow phosphate repulsion to overcome hydrogen bonding and stacking interactions in the double helix. Owing to the mobility restriction imposed by the solid state, only very slight movements are possible. Local stretching and compression might occur, leading to loss of base-pairing and stacking. Bases might be turned outwards from the distorted double helix. At this stage, the phenomenon is entirely reversible upon rehydration. However, if the DNA is heated, mobility is sufficiently increased to lead to shifts of one chain with respect to its complementary chains, with the result that the bases become ‘out of phase’. At this new stage, two alternative events may take place upon rehydration. If there are still one or several spots where the cognate bases are able to base-pair, the whole double strand reassociates immediately. If not, the chains separate completely. An alternative hypothesis has also been proposed by Sharma and Klibanov (82) to account for lyophilized DNA aggregation in the presence of moisture. The probability of separation obviously increases if the fragment size decreases. Either independently or not of this event, bases expelled from the double helix might stack between neighboring non-cognate chains to form small clusters. If given enough time or accelerated by heating, the clusters might then expand and become stronger, creating noncovalent cross-links that lead to irreversible aggregation.
The same mechanism (van der Waals interactions involving the bases) may explain DNA denaturation associated with irreversible adsorption on solid surfaces upon drying and even in solution (87–89). While it is clear that trehalose inhibits these phenomena, no mechanism for their inhibition has yet been demonstrated. Trehalose may act nonexclusively by stabilizing the DNA secondary structure, diminishing the molecular mobility or preventing immediate contact either between neighboring double helices or between DNA chains.
CONCLUSION
This work shows first that atmospheric water and oxygen are detrimental to DNA preservation at room temperature. Second, although the experiments were mostly done in the presence of atmospheric water and oxygen, it suggests that in the absence of both water and oxygen, DNA has a very long life time. Third, the DNA secondary structure is also likely preserved or restored upon rehydration, except possibly for DNA fragments smaller than 500 nt. Finally, these findings show that, if protected from water and oxygen, dehydrated DNA should maintain its primary and secondary structure for periods of time beyond the most demanding needs of conservation, thus validating the possibility of long-term room-temperature storage.
SUPPLEMENTARY DATA
Supplementary Data are available at NAR Online.
FUNDING
The Conseil Régional d’Aquitaine; the Pôle Aquitaine Santé; and Oséo Innovation. Funding for open access charge: IMAGENE Company.
Conflict of interest statement. Some of the authors have a Conflict of interest in relation to the submitted work: Tuffet,S. is CEO and shareholder of IMAGENE Company; Colotte,M. is an employee of IMAGENE Company; Bonnet,J. is a shareholder and a consultant for IMAGENE Company; Coudy,D. is an employee of IMAGENE Company.
Supplementary Material
ACKNOWLEDGEMENTS
We thank C. Cabané and A. Vekris for help and discussions, G. Campet and J. Etourneau for discussions and allowing us to use their dry box and P. Pourquier for the gift of plasmids, E. Creppy, J. Robert, C. Cullin, I. Lascu, J.J. Toulmé, J. Markovits and M. Bonneu for help and support. JP Benedetto is thanked for gifts of old/aged DNA samples and R. Cooke and A.-L. Fabre for editing the English.
REFERENCES
- 1.Lindahl T. Instability and decay of the primary structure of DNA. Nature. 1993;362:709–715. doi: 10.1038/362709a0. [DOI] [PubMed] [Google Scholar]
- 2.Mitchell D, Willerslev E, Hansen A. Damage and repair of ancient DNA. Mutat. Res. 2005;571:265–276. doi: 10.1016/j.mrfmmm.2004.06.060. [DOI] [PubMed] [Google Scholar]
- 3.Pogocki D, Schoneich C. Chemical stability of nucleic acid-derived drugs. J. Pharm. Sci. 2000;89:443–456. doi: 10.1002/(SICI)1520-6017(200004)89:4<443::AID-JPS2>3.0.CO;2-W. [DOI] [PubMed] [Google Scholar]
- 4.Pogozelski WK, Tullius TD. Oxidative strand scission of nucleic acids: routes initiated by hydrogen abstraction from the sugar moiety. Chem. Rev. 1998;98:1089–1108. doi: 10.1021/cr960437i. [DOI] [PubMed] [Google Scholar]
- 5.Vilenchik MM, Knudson AG., Jr Inverse radiation dose-rate effects on somatic and germ-line mutations and DNA damage rates. Proc. Natl Acad. Sci. USA. 2000;97:5381–5386. doi: 10.1073/pnas.090099497. [DOI] [PMC free article] [PubMed] [Google Scholar]
- 6.Frederico LA, Kunkel TA, Shaw BR. A sensitive genetic assay for the detection of cytosine deamination: determination of rate constants and the activation energy. Biochemistry. 1990;29:2532–2537. doi: 10.1021/bi00462a015. [DOI] [PubMed] [Google Scholar]
- 7.Lindahl T, Nyberg B. Heat-induced deamination of cytosine residues in deoxyribonucleic acid. Biochemistry. 1974;13:3405–3410. doi: 10.1021/bi00713a035. [DOI] [PubMed] [Google Scholar]
- 8.Schroeder GK, Lad C, Wyman P, Williams NH, Wolfenden R. The time required for water attack at the phosphorus atom of simple phosphodiesters and of DNA. Proc. Natl Acad. Sci. USA. 2006;103:4052–4055. doi: 10.1073/pnas.0510879103. [DOI] [PMC free article] [PubMed] [Google Scholar]
- 9.Burrows CJ, Muller JG. Oxidative nucleobase modifications leading to strand scission. Chem. Rev. 1998;98:1109–1151. doi: 10.1021/cr960421s. [DOI] [PubMed] [Google Scholar]
- 10.Cadet J, Delatour T, Douki T, Gasparutto D, Pouget JP, Ravanat JL, Sauvaigo S. Hydroxyl radicals and DNA base damage. Mutat. Res./Fundam. Mol. Mech. Mutagen. 1999;424:9–21. doi: 10.1016/s0027-5107(99)00004-4. [DOI] [PubMed] [Google Scholar]
- 11.Evans RK, Xu Z, Bohannon KE, Wang B, Bruner MW, Volkin DB. Evaluation of degradation pathways for plasmid DNA in pharmaceutical formulations via accelerated stability studies. J. Pharm. Sci. 2000;89:76–87. doi: 10.1002/(SICI)1520-6017(200001)89:1<76::AID-JPS8>3.0.CO;2-U. [DOI] [PubMed] [Google Scholar]
- 12.Lindahl T, Andersson A. Rate of chain breakage at apurinic sites in double-stranded deoxyribonucleic acid. Biochemistry. 1972;11:3618–3623. doi: 10.1021/bi00769a019. [DOI] [PubMed] [Google Scholar]
- 13.Lindahl T, Nyberg B. Rate of depurination of native deoxyribonucleic acid. Biochemistry. 1972;11:3610–3618. doi: 10.1021/bi00769a018. [DOI] [PubMed] [Google Scholar]
- 14.Suzuki T, Ohsumi S, Makino K. Mechanistic studies on depurination and apurinic site chain breakage in oligodeoxyribonucleotides. Nucleic Acids Res. 1994;22:4997–5003. doi: 10.1093/nar/22.23.4997. [DOI] [PMC free article] [PubMed] [Google Scholar]
- 15.Gut IG. Depurination of DNA and matrix-assisted laser desorption/ionization mass spectrometry. Int. J. Mass Spectrom. Ion Proc. 1997;169-170:313–322. [Google Scholar]
- 16.Bruskov VI, Malakhova LV, Masalimov ZK, Chernikov AV. Heat-induced formation of reactive oxygen species and 8-oxoguanine, a biomarker of damage to DNA. Nucleic Acids Res. 2002;30:1354–1363. doi: 10.1093/nar/30.6.1354. [DOI] [PMC free article] [PubMed] [Google Scholar]
- 17.Molina MDC, Anchordoquy TJ. Degradation of lyophilized lipid/DNA complexes during storage: the role of lipid and reactive oxygen species. Biochim. Biophys. Acta. 2008;1778:2119–2126. doi: 10.1016/j.bbamem.2008.04.003. [DOI] [PubMed] [Google Scholar]
- 18.Helbock HJ, Beckman KB, Shigenaga MK, Walter PB, Woodall AA, Yeo HC, Ames BN. DNA oxidation matters: the HPLC-electrochemical detection assay of 8- oxo-deoxyguanosine and 8-oxo-guanine. Proc. Natl Acad. Sci. USA. 1998;95:288–293. doi: 10.1073/pnas.95.1.288. [DOI] [PMC free article] [PubMed] [Google Scholar]
- 19.Zhang L, Wu Q. Single gene retrieval from thermally degraded DNA. J. Biosci. 2005;30:599–604. doi: 10.1007/BF02703559. [DOI] [PubMed] [Google Scholar]
- 20.Cadet J, Douki T, Gasparutto D, Ravanat JL. Oxidative damage to DNA: formation, measurement and biochemical features. Mutat. Res. 2003;531:5–23. doi: 10.1016/j.mrfmmm.2003.09.001. [DOI] [PubMed] [Google Scholar]
- 21.Aust AE, Eveleigh JF. Mechanisms of DNA oxidation. Proc. Soc. Exp. Biol. Med. 1999;222:246–252. doi: 10.1046/j.1525-1373.1999.d01-141.x. [DOI] [PubMed] [Google Scholar]
- 22.Cadet J, Douki T, Ravanat JL. Oxidatively generated damage to the guanine moiety of DNA: mechanistic aspects and formation in cells. Acc. Chem. Res. 2008;41:1075–1083. doi: 10.1021/ar700245e. [DOI] [PubMed] [Google Scholar]
- 23.Greenberg MM. DNA interstrand cross-links from modified nucleotides: mechanism and application. Nucleic Acids Symp. Ser. 2005;49:57–58. doi: 10.1093/nass/49.1.57. [DOI] [PubMed] [Google Scholar]
- 24.Hong IS, Greenberg MM. DNA interstrand cross-link formation initiated by reaction between singlet oxygen and a modified nucleotide. J. Am. Chem. Soc. 2005;127:10510–10511. doi: 10.1021/ja053493m. [DOI] [PMC free article] [PubMed] [Google Scholar]
- 25.Bieger-Dose A, Dose K, Meffert R, Mehler M, Risi S. Extreme dryness and DNA–protein cross-links. Adv. Space Res. 1992;12:265–270. doi: 10.1016/0273-1177(92)90181-v. [DOI] [PubMed] [Google Scholar]
- 26.Anchordoquy TJ, Molina MDC. Frontiers in clinical research. Preservation of DNA. Cell Preserv. Technol. 2007;5:180–188. [Google Scholar]
- 27.Briggs AW, Stenzel U, Johnson PLF, Green RE, Kelso J, Prufer K, Meyer M, Krause J, Ronan MT, Lachmann M, et al. Patterns of damage in genomic DNA sequences from a Neandertal. Proc. Natl Acad. Sci. USA. 2007;104:14616–14621. doi: 10.1073/pnas.0704665104. [DOI] [PMC free article] [PubMed] [Google Scholar]
- 28.Hoss M, Jaruga P, Zastawny TH, Dizdaroglu M, Paabo S. DNA damage and DNA sequence retrieval from ancient tissues. Nucleic Acids Res. 1996;24:1304–1307. doi: 10.1093/nar/24.7.1304. [DOI] [PMC free article] [PubMed] [Google Scholar]
- 29.Noonan JP, Coop G, Kudaravalli S, Smith D, Krause J, Alessi J, Chen F, Platt D, Paabo S, Pritchard JK, et al. Sequencing and analysis of Neanderthal genomic DNA. Science. 2006;314:1113–1118. doi: 10.1126/science.1131412. [DOI] [PMC free article] [PubMed] [Google Scholar]
- 30.Paabo S. Ancient DNA: extraction, characterization, molecular cloning, and enzymatic amplification. Proc. Natl Acad. Sci. USA. 1989;86:1939–1943. doi: 10.1073/pnas.86.6.1939. [DOI] [PMC free article] [PubMed] [Google Scholar]
- 31.Brotherton P, Endicott P, Sanchez JJ, Beaumont M, Barnett R, Austin J, Cooper A. Novel high-resolution characterization of ancient DNA reveals C > U-type base modification events as the sole cause of post mortem miscoding lesions. Nucleic Acids Res. 2007;17:5717–5728. doi: 10.1093/nar/gkm588. [DOI] [PMC free article] [PubMed] [Google Scholar]
- 32.Poinar HN, Hofreiter M, Spaulding WG, Martin PS, Stankiewicz BA, Bland H, Evershed RP, Possnert G, Paabo S. Molecular coproscopy: dung and diet of the extinct ground sloth Nothrotheriops shastensis. Science. 1998;281:402–406. doi: 10.1126/science.281.5375.402. [DOI] [PubMed] [Google Scholar]
- 33.Shirkey B, McMaster NJ, Smith SC, Wright DJ, Rodriguez H, Jaruga P, Birincioglu M, Helm RF, Potts M. Genomic DNA of Nostoc commune (Cyanobacteria) becomes covalently modified during long-term (decades) desiccation but is protected from oxidative damage and degradation. Nucleic Acids Res. 2003;31:2995–3005. doi: 10.1093/nar/gkg404. [DOI] [PMC free article] [PubMed] [Google Scholar]
- 34.Hansen AJ, Mitchell DL, Wiuf C, Paniker L, Brand TB, Binladen J, Gilichinsky DA, Ronn R, Willerslev E. Crosslinks rather than strand breaks determine access to ancient DNA sequences from frozen sediments. Genetics. 2006;173:1175–1179. doi: 10.1534/genetics.106.057349. [DOI] [PMC free article] [PubMed] [Google Scholar]
- 35.Evershed RP, Bland HA, van Bergen PF, Carter JF, Horton MC, Rowley-Conwy PA. Volatile compounds in archaeological plant remains and the Maillard reaction during decay of organic matter. Science. 1997;278:432–433. [Google Scholar]
- 36.Xu X, Muller JG, Ye Y, Burrows CJ. DNA–Protein cross-links between guanine and lysine depend on the mechanism of oxidation for formation of C5 vs C8 guanosine adducts. J. Am. Chem. Soc. 2007;130:703–709. doi: 10.1021/ja077102a. [DOI] [PubMed] [Google Scholar]
- 37.Luxford C, Morin B, Dean RT, Davies MJ. Histone H1- and other protein- and amino acid-hydroperoxides can give rise to free radicals which oxidize DNA. Biochem. J. 1999;344:125–134. [PMC free article] [PubMed] [Google Scholar]
- 38.Vilenchik MM. Studies of DNA damage and repair of thermal- and radiation-induced lesions in human cells. Int. J. Radiat. Biol. 1989;56:685–689. doi: 10.1080/09553008914551911. [DOI] [PubMed] [Google Scholar]
- 39.Schnier PD, Klassen JS, Strittmatter EF, Williams ER. Activation energies for dissociation of double strand oligonucleotide anions: evidence for Watson–Crick base pairing in vacuo. J. Am. Chem. Soc. 1998;120:9605–9613. doi: 10.1021/ja973534h. [DOI] [PMC free article] [PubMed] [Google Scholar]
- 40.Gabelica V, Pauw ED. Comparison between solution-phase stability and gas-phase kinetic stability of oligodeoxynucleotide duplexes. J. Mass. Spectrom. 2001;36:397–402. doi: 10.1002/jms.141. [DOI] [PubMed] [Google Scholar]
- 41.Wu J, McLuckey SA. Gas-phase fragmentation of oligonucleotide ions. Int. J. Mass Spectrom. 2004;237:197–241. [Google Scholar]
- 42.Matsuo S, Toyokuni S, Osaka M, Hamazaki S, Sugiyama T. Degradation of DNA in dried tissues by atmospheric oxygen. Biochem. Biophys. Res. Comm. 1995;208:1021–1027. doi: 10.1006/bbrc.1995.1436. [DOI] [PubMed] [Google Scholar]
- 43.Molina MD, Anchordoquy TJ. Metal contaminants promote degradation of lipid/DNA complexes during lyophilization. Biochim. Biophys. Acta. 2007;1768:669–677. doi: 10.1016/j.bbamem.2006.12.004. [DOI] [PMC free article] [PubMed] [Google Scholar]
- 44.Lee SL, Debenedetti PG, Errington JR, Pethica BA, Moore DJ. A calorimetric and spectroscopic study of DNA at low hydration. J. Phys. Chem. B. 2004;108:3098–3106. [Google Scholar]
- 45.Jarman M. Pyrolysis of deoxyribonucleic acid: isolation and mass spectrometry of individual pyrolysis products. J. Anal. Appl. Pyrolysis. 1980;2:217–223. [Google Scholar]
- 46.Glavin DP, Schubert M, Bada JL. Direct isolation of purines and pyrimidines from nucleic acids using sublimation. Anal. Chem. 2002;74:6408–6412. doi: 10.1021/ac0259663. [DOI] [PubMed] [Google Scholar]
- 47.Ptasinska S, Candori P, Denifl S, Yoon S, Grill V, Scheier P, Märk TD. Dissociative ionization of the nucleosides thymidine and uridine by electron impact. Chem. Phys. Lett. 2005;409:270–276. [Google Scholar]
- 48.Demers LM, Ostblom M, Zhang H, Jang NH, Liedberg B, Mirkin CA. Thermal desorption behavior and binding properties of DNA bases and nucleosides on gold. J. Am. Chem. Soc. 2002;124:11248–11249. doi: 10.1021/ja0265355. [DOI] [PubMed] [Google Scholar]
- 49.Byrn SR, Pfeiffer RR, Stowell JG. Solid-State Chemistry of Drugs. 2nd edn. West Lafayette, IN: SSCI, Inc.; 1999. [Google Scholar]
- 50.Byrn SR, Xu W, Newman AW. Chemical reactivity in solid-state pharmaceuticals: formulation implications. Adv. Drug Deliv. Rev. 2001;48:115–136. doi: 10.1016/s0169-409x(01)00102-8. [DOI] [PubMed] [Google Scholar]
- 51.Costantino HR, Griebenow K, Langer R, Klibanov AM. On the pH memory of lyophilized compounds containing protein functional groups. Biotech. Bioeng. 1997;53:345–348. doi: 10.1002/(SICI)1097-0290(19970205)53:3<345::AID-BIT14>3.0.CO;2-J. [DOI] [PubMed] [Google Scholar]
- 52.Shalaev EY, Lu Q, Shalaeva M, Zografi G. Acid-catalyzed inversion of sucrose in the amorphous state at very low levels of residual water. Pharm. Res. 2000;17:366–370. doi: 10.1023/a:1007517526245. [DOI] [PubMed] [Google Scholar]
- 53.Hancock BC, Zografi G. Characteristics and significance of the amorphous state in pharmaceutical systems. J. Pharm. Sci. 1997;86:1–12. doi: 10.1021/js9601896. [DOI] [PubMed] [Google Scholar]
- 54.Yoshioka S, Aso Y. Correlations between molecular mobility and chemical stability during storage of amorphous pharmaceuticals. J. Pharm. Sci. 2007;96:960–981. doi: 10.1002/jps.20926. [DOI] [PubMed] [Google Scholar]
- 55.Shalaev EY, Zografi G. How does residual water affect the solid-state degradation of drugs in the amorphous state? J. Pharm. Sci. 1996;85:1137–1141. doi: 10.1021/js960257o. [DOI] [PubMed] [Google Scholar]
- 56.Cherng JY, Talsma H, Crommelin DJ, Hennink WE. Long term stability of poly((2-dimethylamino)ethyl methacrylate)-based gene delivery systems. Pharm. Res. 1999;16:1417–1423. doi: 10.1023/a:1018907310472. [DOI] [PubMed] [Google Scholar]
- 57.Westhof E. water: an integral part of nucleic acid structure. Ann. Rev. Biophys. Biophys. Chem. 1988;17:125–144. doi: 10.1146/annurev.bb.17.060188.001013. [DOI] [PubMed] [Google Scholar]
- 58.Ayala-Torres S, Chen Y, Svoboda T, Rosenblatt J, Van Houten B. Analysis of gene-specific DNA damage and repair using quantitative polymerase chain reaction. Methods. 2000;22:135–147. doi: 10.1006/meth.2000.1054. [DOI] [PubMed] [Google Scholar]
- 59.Song Z, Antzutkin ON, Lee YK, Shekar SC, Rupprecht A, Levitt MH. Conformational transitions of the phosphodiester backbone in native DNA: two-dimensional magic-angle-spinning 31P-NMR of DNA fibers. Biophys. J. 1997;73:1539–1552. doi: 10.1016/S0006-3495(97)78186-4. [DOI] [PMC free article] [PubMed] [Google Scholar]
- 60.Fuller W, Forsyth T, Mahendrasingam A. Water-DNA interactions as studied by X-ray and neutron fibre diffraction. Philos. Trans. R. Soc Lond. B Biol. Sci. 2004;359:1237–1248. doi: 10.1098/rstb.2004.1501. [DOI] [PMC free article] [PubMed] [Google Scholar]
- 61.Falk M, Hartman KA, Lord RC. Hydration of deoxyribonucleic acid (DNA). II. An infrared study. J. Am. Chem. Soc. 1963;85:387–391. [Google Scholar]
- 62.Marlowe RL, Lukan AM, Lee SA, Anthony L, Chandrasekaran R, Rupprecht A. Differential scanning calorimetric and X-ray study of the binding of the water of primary hydration to calf-thymus DNA. J. Biomol. Struct. Dyn. 1996;14:373–379. doi: 10.1080/07391102.1996.10508132. [DOI] [PubMed] [Google Scholar]
- 63.Guzman MR, Liquier J, Taillandier E. Hydration and conformational transitions in DNA, RNA, and mixed DNA-RNA triplexes studied by gravimetry and FTIR spectroscopy. J. Biomol. Struct. Dyn. 2005;23:331–339. doi: 10.1080/07391102.2005.10507068. [DOI] [PubMed] [Google Scholar]
- 64.Pan S, Sun X, Lee JK. DNA stability in the gas versus solution phases: a systematic study of thirty-one duplexes with varying length, sequence, and charge level. J. Am. Soc. Mass. Spectrom. 2006;17:1383–1395. doi: 10.1016/j.jasms.2006.07.016. [DOI] [PubMed] [Google Scholar]
- 65.Sclavi B, Powell WLPJW. Fractal-like patterns in DNA films, B form at 0% relative humidity, and antiheteronomous DNA: An ir study. Biopolymers. 1994;34:1105–1113. doi: 10.1002/bip.360340814. [DOI] [PubMed] [Google Scholar]
- 66.Gabelica V, Rosu F, Houssier C, De Pauw E. Gas phase thermal denaturation of an oligonucleotide duplex and its complexes with minor groove binders. Rapid Comm. Mass Spectrom. 2000;14:464–467. doi: 10.1002/(SICI)1097-0231(20000331)14:6<464::AID-RCM895>3.0.CO;2-M. [DOI] [PubMed] [Google Scholar]
- 67.Abdurakhman H, Tajiri K, Yokoi H, Kuroda N, Matsui H, Yanagimachi T, Taniguchi M, Kawai T, Toyota N. Infrared spectroscopy on poly(dG)-poly(dC) DNA at low hydration. J. Phys. Soc. Jap. 2007;76:024009. [Google Scholar]
- 68.Kornyshev AA, Leikin S. Electrostatic interaction between helical macromolecules in dense aggregates: an impetus for DNA poly- and meso-morphism. Proc. Natl Acad. Sci. USA. 1998;95:13579–13584. doi: 10.1073/pnas.95.23.13579. [DOI] [PMC free article] [PubMed] [Google Scholar]
- 69.Minsky A. Information content and complexity in the high-order organization of DNA. Annu. Rev. Biophys. Biomol. Struct. 2004;33:317–342. doi: 10.1146/annurev.biophys.33.110502.133328. [DOI] [PubMed] [Google Scholar]
- 70.Timsit Y, Moras D. Self-fitting and self-modifying properties of theB-DNA Molecule. J. Mol. Biol. 1995;251:629–647. doi: 10.1006/jmbi.1995.0461. [DOI] [PubMed] [Google Scholar]
- 71.Cherstvy AG, Kornyshev AA, Leikin S. Torsional deformation of double helix in interaction and aggregation of DNA. J. Phys. Chem. B. 2004;108:6508–6518. doi: 10.1021/jp0380475. [DOI] [PubMed] [Google Scholar]
- 72.Zhu B, Furuki T, Okuda T, Sakurai M. Natural DNA mixed with trehalose persists in B-form double-stranding even in the dry state. J. Phys. Chem. B. 2007;111:5542–5544. doi: 10.1021/jp071974h. [DOI] [PubMed] [Google Scholar]
- 73.Alkhamis KA. Influence of solid-state acidity on the decomposition of sucrose in amorphous systems (I) In. J. Pharm. 2008;362:74–80. doi: 10.1016/j.ijpharm.2008.06.024. [DOI] [PubMed] [Google Scholar]
- 74.Rueda M, Kalko SG, Luque FJ, Orozco M. The structure and dynamics of DNA in the gas phase. J. Am. Chem. Soc. 2003;125:8007–8014. doi: 10.1021/ja0300564. [DOI] [PubMed] [Google Scholar]
- 75.Milligan JR, Aguilera JA, Ly A, Tran NQ, Hoang O, Ward JF. Repair of oxidative DNA damage by amino acids. Nucleic Acids Res. 2003;31:6258–6263. doi: 10.1093/nar/gkg816. [DOI] [PMC free article] [PubMed] [Google Scholar]
- 76.Hicks M, Gebicki JM. Rate constants for reaction of hydroxyl radicals with Tris, Tricine and HEPES buffers. FEBS Lett. 1986;199:92–94. [Google Scholar]
- 77.Sambrook J, Russel DW. Molecular Cloning: A Laboratory Manual. 3rd edn. Cold Spring Harbor, NY: Cold Spring Harbor Laboratory Press; 2001. [Google Scholar]
- 78.Lloyd RS, Haidle CW, Robberson DL. Bleomycin-specific fragmentation of double-stranded DNA. Biochemistry. 1978;17:1890–1896. doi: 10.1021/bi00603a014. [DOI] [PubMed] [Google Scholar]
- 79.Colotte M, Couallier V, Tuffet S, Bonnet J. Simultaneous assessment of average fragment size and amount in minute samples of degraded DNA. Anal. Biochem. 2009;388:345–347. doi: 10.1016/j.ab.2009.02.003. [DOI] [PubMed] [Google Scholar]
- 80.Cowan R, Collis CM, Grigg GW. Breakage of double-stranded DNA due to single-stranded nicking. J. Theor. Biol. 1987;127:229–245. doi: 10.1016/s0022-5193(87)80133-9. [DOI] [PubMed] [Google Scholar]
- 81.Brossalina E, Pascolo E, Toulme JJ. The binding of an antisense oligonucleotide to a hairpin structure via triplex formation inhibits chemical and biological reactions. Nucleic Acids Res. 1993;21:5616–5622. doi: 10.1093/nar/21.24.5616. [DOI] [PMC free article] [PubMed] [Google Scholar]
- 82.Sharma VK, Klibanov AM. Moisture-induced aggregation of lyophilized DNA and its prevention. Pharm. Res. 2006;4:168–175. doi: 10.1007/s11095-006-9138-7. [DOI] [PubMed] [Google Scholar]
- 83.Gasparutto D, Ait-Abbas M, Jaquinod M, Boiteux S, cadet J. Repair and coding properties of 5-hydroxy-5-methylhydantoin nucleosides inserted into DNA oligomers. Chem. Res. Toxicol. 2000;13:575–584. doi: 10.1021/tx000005+. [DOI] [PubMed] [Google Scholar]
- 84.Falk M, Hartman KA, Lord RC. Hydration of deoxyribonucleic acid. I. A gravimetric study. J. Am. Chem. Soc. 1962;84:3843–3846. [Google Scholar]
- 85.Chen Y, Li Y. Determination of water vapor transmission rate (WVTR) of HDPE bottles for pharmaceutical products. Int. J. Pharm. 2008;358:137–143. doi: 10.1016/j.ijpharm.2008.02.031. [DOI] [PubMed] [Google Scholar]
- 86.Molina MDC, Armstrong TK, Zhang Y, Patel MM, Lentz YK, Anchordoquy TJ. The Stability of lyophilized lipid/DNA complexes during prolonged storage. J. Pharm. Sci. 2004;93:2259–2273. doi: 10.1002/jps.20138. [DOI] [PubMed] [Google Scholar]
- 87.Gaillard C, Strauss F. Avoiding adsorption of DNA to polypropylene tubes and denaturation of short DNA fragments. Tech. Tips Online, Trends Genet. 1997;13:461–461. [Google Scholar]
- 88.Svaren J, Inagami S, Lovegren E, Chalkley R. DNA denatures upon drying after ethanol precipitation. Nucleic Acids Res. 1987;15:8739–8754. doi: 10.1093/nar/15.21.8739. [DOI] [PMC free article] [PubMed] [Google Scholar]
- 89.Yang J, Pong BK, Lee JY, Too HP. Dissociation of double-stranded DNA by small metal nanoparticles. J. Inorg. Biochem. 2007;101:824–830. doi: 10.1016/j.jinorgbio.2007.01.014. [DOI] [PubMed] [Google Scholar]
Associated Data
This section collects any data citations, data availability statements, or supplementary materials included in this article.


