


Abstract
We report that greA expression is driven by two strong, overlapping P1 and P2 promoters. The P1 promoter is σ70-dependent and P2 is σE-dependent. Two-thirds of transcripts terminate within the leader region and the remaining third comprises greA mRNA. Termination efficiency seems to be unaffected by growth phase. Two collections of small 40–50 (initiating from P2) and 50–60 nt (from P1) RNA chains, termed GraL, are demonstrable in vivo and in vitro. We document that GraL arrays arise from an intrinsic terminator with an 11 bp stem followed by an AU7GCU2 sequence. Atypical chain termination occurs at multiple sites; the 3′-ends differ by 1 nt over a range of 10 nt. Transcripts observed are shown to be insensitive to Gre factors and physically released from RNAP–DNA complexes. The abundance of individual chains within each cluster displays a characteristic pattern, which can be differentially altered by oligonucleotide probes. Multiple termination sites are particularly sensitive to changes at the bottom of the stem. Evolutionarily conserved GraL stem structures and fitness assays suggest a biological function for the RNA clusters themselves. Although GraL overexpression induces ≥3-fold transcriptional changes of over 100 genes, a direct target remains elusive.
INTRODUCTION
Transcription termination is important for gene expression. Terminators can occur in the intergenic regions as well as within open reading frames. Prokaryotic terminators are divided into two classes; intrinsic terminators can function with just RNA polymerase (RNAP) and the DNA template, whereas other terminators have a requirement for additional proteins (such as Rho, MFD). The distinction can be somewhat artificial because intrinsic terminators often can also be influenced by other protein factors, such as λN and Nus (1). About half of the terminators in the Escherichia coli genome are thought to be rho-independent, intrinsic terminators.
Usually, an intrinsic terminator consists of a GC-rich dyad symmetry stem followed by a U-rich tract. Termination typically occurs 7–8 bp downstream from the base of the stem. Many models of termination have been proposed over the years [for review, see ref. (2)], and refined by the availability of the structure of RNAP–DNA complexes and the ability to manipulate elongation complexes at different stages of termination (3–8). The most recent advances with single-molecule studies allow a unified view of this phenomenon (9). From this study and others, it is apparent that distinctly different mechanisms of termination (either forward translocation or shearing of the RNA–DNA hybrid induced by the formation of the hairpin) are determined by sequences upstream of the stem, the U-tract sequence itself, and basepairing within the stem. For example, for terminators like t500, forward translocation is necessary when U-tracts contain other bases than U (6,9). For terminators like tR2 and his, the pairing of the 2–3 bp at the bottom of the stem facilitates shearing of the RNA–DNA hybrids with a more uniform U-rich tract (4,9). This model does not exclude that conformational changes within the RNAP are also important for termination. Several allosteric models have been proposed (4,5,7,10).
Pausing of RNAP at the U-rich tract during elongation is thought to be a prerequisite for the folding of the terminator hairpin (7,9). Paused RNAP can also lead to elongation arrest due to backtracking, which can be rescued by transcription elongation factors such as GreA and GreB (11), that are homologues of eukaryotic TFIIS factor (12). These proteins bind to the secondary channel of RNAP and activate its intrinsic endonucleolytic activity to restore the proximity of the 3′-end of the nascent RNA in the catalytic center (11–16).
A growing class of proteins shares the ability to bind to the secondary channel of RNAP. Besides GreA and GreB, this family includes DksA, TraR, Rnk, Gfh1 (12,17–19) which do not apparently induce RNase activity, but have other regulatory functions.
DksA has been well studied with respect to its interaction with guanosine tetraphosphate (ppGpp). Both are implicated in positive and negative transcription regulation during the bacterial stringent response through direct interactions with RNAP (20,21). In E. coli, this response involves curtailing ribosomal RNA and tRNA synthesis during stress conditions, such as starvation for amino acids, carbon, iron, or phosphate. DksA and ppGpp regulation was shown to be in some cases synergistic (22–24), and in others independent or opposite (25,26).
Evidence that GreA’s effect on growth and rrnB P1 activity can be altered by the absence of DksA led to finding a role for GreA in the process of transcription initiation and to a proposal that a balance of these proteins might be needed for cell growth because of mutual competition (27). Indeed, the relative abundance of GreA, GreB and DksA seems to be maintained during all phases of growth (28).
Functional consequences do result from changing the balance of secondary channel proteins (25–28). We are unaware of studies of promoter region elements responsible for the expression of any of these transcription factors although the biochemical properties of GreA and GreB have been extensively characterized (11,13–16).
Here, the promoter region for greA gene expression is characterized and is found to be complex. An array of short transcripts, that we call GraL, originates from two overlapping upstream P1 (σ70) and P2 (σE) promoters. We first document that two clusters of RNA are generated by an intrinsic terminator present in the leader region. The imprecise termination over a range of 10 nt is very unusual. To our knowledge, a range of termination exceeding four sites and differing by 1 nt is not reported in prokaryotes or eukaryotes. Therefore, we attempt to characterize the basis for this atypical behavior. We also document the likelihood that GraL has a biological function.
MATERIALS AND METHODS
Strains and plasmids
The strains used are E. coli MG1655 derivatives and are listed in Supplementary Table S1. Transduction was performed as described in ref. (29). Single copy lysogens containing lacZ fusions were made according to ref. (30). The malT marker alleles were selected among spontaneous λvir resistant mutants and screened as white colonies on MacConkey-maltose plates.
Plasmids (pRS415 for transcriptional fusions) with flanking homology to λ were cut with BamHI/EcoRI and ligated with PCR products containing appropriate promoter regions similarly cut (Supplementary Table S1). An analogous construction of an yhbY-lacZ fusion was performed in pRS414 (translational fusion). The GraL overproducing plasmid (pKP-GraL) was constructed by ligating the GraL containing PCR fragment with pBR-plac, both cut with EcoRI and HindIII (Supplementary Table S1). pKP-GraLScrambled was constructed in a similar manner, using oligos listed in Supplementary Table S2. Induction of GraL by IPTG was verified by northern blots to be at least 20-fold in a lacIq background (CF15197 and CF15199); no induction lead to 2-fold increase in GraL. When lacIq was not present (CF14431 and CF15175), GraL was continuously overproduced by ∼20-fold even in the absence of IPTG. pKP-rpoE19 for σE overproduction was constructed as described for pPER70 (31).
Growth on CAS plates was carried out as described in ref. (32).
β-Galactosidase measurements
These were done basically as described in ref. (29).
Nucleotides and enzymes
RNAP holoenzyme and core were obtained from Epicentre Technologies; ribonucleotides from GE Healthcare; ApA and ApU dinuclotides, 3′-O-methylcytosine-5′-triphosphate, 3′-O-methylguanosine-5′- triphosphate, 3′-O-methyluridine-5′-triphosphate and 3′-O-methyladenosine-5′-triphosphate from TriLink Biotechnologies. ppGpp was synthesized and purified as described (33). Oligonucleotides were purchased from Integrated DNA Technologies and are listed in Supplementary Table S2.
Protein purification
GreA, GreB and DksA were purified as described in ref. (27). For σE purification, strain CF 14375 (BL21/pLysE/pKPrpoE-19) was used. Since σE overproduction is toxic, single colonies used to inoculate LB cultures were premonitored for this toxicity on plates in order to ensure wild-type σE production. Purification was carried out as described in ref. (34), but with two modifications. First, Ni2+–agarose resin (Qiagen) was used to bind his-σE, and second, the his-tag was removed with Thrombin Cleavage Capture Kit (Novagen). Samples containing pure σE were stored at −20°C in 20 mM Tris–Cl, pH 8.0, 50% glycerol, 0.5 M NaCl, 1 mM EDTA, 1 mM DTT.
Primer extension
The promoters in the greA leader region were mapped with a 32P-labeled primer annealing to lacZ gene downstream from the region of interest (pHMPr295). Total RNA (50 μg) isolated from cells carrying pKP-pAall plasmid was combined with the labeled primer in 170 mM KCl, final. Next, the sample was denatured at 95°C for 2 min, chilled on ice for 4 min, and incubated overnight at 45°C. After addition of extension buffer (yielding 50 mM Tris–Cl, pH 8.0, 10 mM DTT, 10 mM MgCl2, 500 μM dNTPs) and of AMV reverse transcriptase (10 U/50 μl; Promega), the mixture was incubated at 42°C for 1 h. Following RNA digestion with 0.1 μg/μl RNase H (Promega), cDNA was precipitated in ethanol with 0.55 M ammonium acetate. The samples were then resuspended in loading buffer (95% formamide, 0.05% bromophenol blue, 0.05% xylene cyanol) and resolved on an 7 M urea, 8% polyacrylamide sequencing gel, run in parallel with a sequencing reaction performed with the same labeled primer and pKP-pAall DNA (fmol DNA Cycle Sequencing Kit, Promega).
In vitro transcription assay
To visualize greAP1 activity, single round in vitro transcription assays were performed at 37°C with 10 nM linear templates and 30 nM RNAP, in the following buffer: 50 mM Tris–Cl (pH 8.0), 10 mM MgCl2, 10 mM β-mercaptoethanol, 10 µg/ml bovine serum albumin, 50 mM KCl, 6 µM ATP, 100 µM ApU, 100 µM GTP, and either 100 µM CTP and 10 µM UTP (10 µCi/reaction [α-32P]UTP, or 100 µM UTP and 10 µM CTP (10 µCi/reaction [α-32P]CTP), and heparin at 100 µg/ml. The ATP concentration used (6 µM) was found to be optimal to prevent stuttering at the four A residues at positions +4 to +7, relative to greAP1 start site. When present, ppGpp was used at 250 µM; GreA, GreB and DksA were at 300 nM, and were added at the time of open complex formation.
The template used was a PCR product spanning the whole greA promoter region, amplified with the use of HMPr368 and pBplasdw primers (Supplementary Table S2). The pAswap template was made by annealing primers pAsw1 and pAsw2. The dsDNA fragment was gel purified and served as a template in a PCR with pAsw2short and HMPr368 primers. The sequence of the template was verified by sequencing with the fmol DNA Cycle Sequencing Kit (Promega). The pAd1 and pAd2 templates were constructed in a similar manner with the use of primers pAd1up and pAdw1, and pAd2up and pAd2dw, respectively. Templates where stem basepairs were deleted progressively from the top of the stem (p10, p9, p8, p7) were constructed in a similar manner with corresponding primers listed in Supplementary Table S2.
To monitor accumulation of short transcripts over time, RNAP–DNA open complexes were allowed to form for 10 min at 37°C and the transcription reaction was initiated by the addition of nucleotides together with heparin. Samples were then removed at indicated times and added to an equal volume of stop buffer (95% formamide, 20 mM EDTA, 0.05% bromphenol blue and 0.05% xylene cyanol). Samples were analyzed on a 7 M urea, 8% polyacrylamide sequencing gel and quantified by phosphorimaging on a GE Healthcare imaging system.
To assay transcription initiating from the greAP2 promoter, the same transcription template was used as above, except that RNAP-σE holenzyme was used, and ApA was employed instead of ApU dinucleotide. Core RNAP was reconstituted with σE at a 1:6 ratio (30 nM: 180 nM final).
Effects of oligonucleotide ‘pins’ on termination
To monitor the effect of oligonucleotide ‘pins’ (listed in Supplementary Table S2 and depicted in Figure 4D), the reactions were carried out basically as described above, except that ‘pins’ (0–5 µM, as indicated) were added together with nucleotide substrates. The reactions were carried out for 8 min and processed as described above.
Figure 4.

Termination of P1 and P1P2 transcripts occurs in vivo and is altered by oligodeoxyribonucleotides complementary to the base of the GC-rich stem in vitro. (A) The sequence of the intrinsic terminator beginning with the +1 of greAP1 shows the upstream stem I and the downstream stem II followed by AU7GCU2. Oligodeoxynucleotide 20-mer ‘pins’ complementary to various portions of the sequence are also shown. (B) The putative terminator terminates greAP1P2 lacZ fusion in vivo. Shown are differential plots of the activities of single copy lacZ transcriptional fusions to the entire greA leader region (pAall), greAP1 (P1), greAP1P2 (P1 + P2) and greAP1P2 with the terminator present (P1P2+T). (C) A sample northern blot with probe complementary to 40 nt downstream of greAP2 region. RNA was extracted from wild-type strains with (lanes 1–4) or without (lane 5) appropriate plasmids. Lane 2—RNA from an rnc mutant deficient in RNase III. (D) Quantitation of full-length products from a single round transcription in the presence of ‘pins’ depicted in panel A.
Measurement of transcript release with immobilized templates
Transcription on immobilized DNA template was used to determine release of the short transcripts produced. This template was prepared as described above, except that biotinylated HMPr368 primer was used in the PCR reaction (Integrated DNA Technologies). The protocol was similar to that described in ref. (35). Briefly, 7.5 nM RNAP was pre-incubated with 2.5 nM biotinylated template in the transcription buffer (7.5 μl final volume) for 5 min at 37°C, whereupon 2.5 μl of streptavidin-coated agarose beads (50% slurry in transcription buffer; Pierce) were added and the incubation was continued for 10 min. The beads were then washed with 1 ml of transcription buffer. Next, nucleotides were added, bringing the total reaction volume to 20 µl. After 2 min, the samples were spun for ∼2 s, and 10 µl of the stop buffer was added simultaneously to an equal volume of supernatant and the remaining suspension containing beads, without washing the beads to further remove the supernatant. The samples were then processed as described above.
Direct RNA sequencing
Sequencing was performed as described in (36), but a 2-fold excess of 3′-O-methyl analogues were used over all four NTP substrates. The in vitro transcription reactions were as described above, except that in some instances, inosine triphosphate was used instead of GTP. Products were resolved on 12% polyacrylamide sequencing gel.
Northern blot analysis
RNA was isolated from 10 ml of cells grown exponentially in LB (A600 = 0.6). Immediately after sample removal, an equal volume of ice-cold RNAlater reagent was added (Ambion). RNA was isolated with Trizol reagent (Invitrogen).
For detection of GraL, 7.5 μg of total RNA was resolved on a 15% TBE–urea gel (Invitrogen NOVEX gels), run in 1 × TBE for 2 h at 160 V along with a ladder of oligonucleotide markers with the GraL sequences. This was followed by dry transfer with iBlot Gel Transfer Device (Invitrogen) using a rapid procedure we adopted from a western blot protocol. This employs nitrocellulose transfer stacks recommended by Invitrogen for western blotting, but with the GeneScreen Plus membrane (Perkin Elmer). Transfer of RNA was carried out at 20 V for 3.5 min. The transferred RNA was then crosslinked by UV and membranes were baked under vacuum for 30 min (80°C). Membranes were then blocked for 2 h with Ultrahyb OLIGO reagent (Ambion), and incubated with 32P-labeled probe for 12–16 h. Both steps were carried out at 42°C. This was followed by two washes at 25°C with 2 × SSC, 0.5% SDS buffer. Blots were analyzed by phosphor imaging with the use of GE Healthcare imaging system.
The anti-GraL probe used (pAp2sRNA40) anneals beyond the greAP2 region and is listed in Supplementary Table S2.
Microarray analysis
Strains were grown in LB medium with ampicillin (50 μg/ml) at 37°C. Induction of GraL was with 1 mM IPTG at A600 = 0.5 and the culture (CF15197 or CF15199 and their vector controls) was allowed to grow for another 15 min. Continuous exposure to GraL overproduction was achieved by growth of CF14431 or CF15175 in LB, sampling at a similar density.
Samples (five OD units) were immediately mixed with an equal volume of ice-cold RNAlater reagent (Ambion), and kept on ice for 20 min. Then RNA was isolated using Trizol reagent (Invitrogen). Total RNA samples (10 μg) were then processed as described in the Affymetrix GeneChip® Expression Analysis Technical Manual, with the recommended reagents and the E. coli 2.0 arrays (Affymetrix). Three biologically independent samples were processed for each comparison.
Data obtained was analyzed with the use of JMP software. To qualify as being affected by GraL, our criteria were that at least a 3-fold difference had to exist between two strains and at least one of the signal values had to be ≥300. This yielded 173 genes for the short-term exposure experiment; if only 2-fold difference was considered, over 500 genes seemed to be affected. The P-value was calculated either for each averaged comparison pair separately (short GraL induction experiments), or for all four averaged comparisons simultaneously (continuous GraL overproduction). In all cases, P-value had to be ≤0.05 to qualify. The microarray data is deposited at the GEO website (http://www.ncbi.nlm.nih.gov/geo), accession number GSE15406.
Western blot analysis
The following antibodies were used: Fur, rabbit polyclonal anti-Fur antibody; RpoA, mouse anti-alpha-CTD monoclonal antibody (Neoclone); GreA, polyclonal IgY made to our purified GreA protein (US Biological). Western blot analysis was carried out according to standard procedures.
Effects of GraL on cell fitness
To measure fitness, equal numbers of malT− cells carrying pGraL were mixed with malT+ cells carrying vector; to ensure the results were not biased by the malT marker, a reciprocal mix was monitored as well. The first culture was initiated by inoculating 106 cells of each type into 3 ml of LB supplemented with ampicillin (50 µg/ml). The cultures were grown overnight at 32°C, followed by inoculation of 103 cells into a fresh medium. This was carried out for five consecutive cycles. At each cycle a few hundred cells were plated on MacConkey-maltose plates (supplemented with ampicillin), and red and white colonies were scored. Separate cultures of each of the four strains were treated in a similar manner to monitor spontaneous conversion of malT+ into malT−, and vice versa. Similar experiments were performed with pKP-GraLScrambled, which was verified to be expressed to the same extent as RNA from pGraL.
RESULTS
Effects of deleting GreA, GreB and DksA on greA-lacZ operon fusions
Since GreA, GreB and DksA are structural homologues known to interact with the RNA polymerase secondary channel, with functionally competitive effects, we explored the possibility that these proteins might influence greA transcription. Therefore a greA-lacZ operon fusion was constructed in phage lambda by fusing the 250 bp intergenic region upstream of the greA orf to lacZ. Single copy lysogens of this phage were made in wild-type E. coli MG1655 ΔlacIZ (CF7968). Deletions of greA, greB or dskA were then transduced into this strain background and reporter activities measured during a cycle of growth in rich LB media. The differential plot (Figure 1A) reveals that only deleting greA gives a change in wild type activity, ∼3-fold derepression. Derepression of transcription by deleting greA suggests that its expression is subject to autorepression. Multicopy plasmids that increase GreA abundance (27), decrease the reporter activity 2–3-fold, consistent with autorepression (data not shown).
Figure 1.

Effects of deletions of RNAP secondary channel proteins on greA transcription and localization of the four potential greA promoters. (A) A differential plot of the activities of single copy lacZ transcriptional fusions to the entire dacB-greA intergenic region. Activities are measured during growth in LB medium for wild-type, ΔgreA, ΔgreB and ΔdksA strains. (B) Primer extension results and a sequencing ladder. Arrows indicate transcript lengths visualized relative to the AUG for greA P1-P4. (C) The sequence of the intergenic region. The +1 start sites of the various promoters are depicted as capitals in bold font; deduced consensus regions are shown in blue for σ70 promoter (P1; consensus sequence TTGACA N17 TATAAT) and in red for the σE (P2; consensus sequence GGAACTT N16 TCNAA) promoter. A hyphenated dyad symmetry stem (convergent arrows) and a downstream U-rich region (dashed line) are shown.
Primer extension mapping of greA promoters
Primer extension was used to identify possible promoters upstream of greA. Four apparently equally active transcripts are detected from the entire intergenic region just described using a primer that anneals beyond the first AUG of greA (Figure 1B). The +1 start sites of the greA P1–4 promoters are summarized in Figure 1C with start sites indicated in boldface capital letters. Judging from the sequence, the P1 promoter seems to be a σ70-dependent promoter, while P2 is σE-dependent. The σE-dependent promoter was previously predicted from a consensus sequence search but not experimentally verified (37). The +1 start sites from primer extensions allow estimates of –35 and –10 sequences for the P1 and P2 promoters from consensus sequences (colored in blue and red, respectively, in Figure 1C). For the P3 and P4 promoters we are unable to assign consensus regions with confidence. Therefore the bands identified by primer extension method might be processing sites, rather than promoter start sites (see below).
We verified that greA transcription is not affected under our conditions by transcription of the oppositely oriented dacB gene because parallel primer extension experiments did not reveal any transcripts (data not shown).
Activity and regulation of individual greA promoters
Next, we constructed chromosomal lacZ fusions of individual promoters in single copy for comparison with activity of the entire region (greA pA-all) described above. Figure 2A diagrams the fragments present in the P1, P3 and P4 single promoter fusions. We elected not to construct a P2 single promoter fusion because P1 and P2 start sites are 11 bp apart. Although P1 might be silenced by mutation of either its –10 or –35 region, we feared these might inadvertently affect the properties of P2. Instead we estimate P2 activity by comparing P1P2 activity with P1. Reporter activities of P1 as well as P1P2 are found to be ∼4-fold more active than pA-all (Figure 2B). The activities of P1 and P1P2 are nearly equivalent. The activities of the P3 and P4 individual promoters are found to be marginally active (17 and 6 Miller U, respectively) again suggesting they might not be active promoters (see ‘Discussion’ section).
Figure 2.

Constructs of individual greA promoters and their activities relative to overall transcription (greA pA-all). (A) Map of fragments used for promoter fusions. A single P2 promoter fragment was not constructed since the P1 and P2 promoters overlap by 11 bp (see text). (B) A differential plot of reporter activities of these promoters during growth in LB as in Figure 1A.
The different reporter activities of the individual promoters are in striking contrast with the primer extension estimates of transcript abundance (Figure 1B); this disparity will be addressed in the ‘Discussion’ section.
The greA promoter region yields an array of short transcripts
Why does P1 or P1P2 display greater activity than pA-all? We explore this question by transcribing a linear template of the same promoter region (greA pA-all) using either RNA polymerase σ70- or σE-holoenzyme (Figure 3). Figure 3A shows a time course of single round transcription with RNAP-σ70 holoenzyme under transcription conditions optimized for P1 promoter activity, using ApU dinucleotide for initiation (see ‘Materials and Methods’ section). As can be seen, accumulation of full-length run-off transcripts (labeled P1 FL) is accompanied by clusters of 50–60 nt long transcripts (marked by brackets). The time course of accumulation for the full-length transcripts is quantitatively similar for the short transcripts when the bracketed region activities are pooled (Figure 3A, subpanel).
Figure 3.

In vitro transcription of greA pA-all templates reveals termination of P1 and P2 transcripts and release of a cluster of small RNA chains. (A) Upper panel—gel depicts products from a single round transcription with σ70 holoenzyme; lower panel—quantitation of full-length (P1 FL, arrow) and small chain cluster (brackets) transcripts over time. (B) Same as (A), but with 300 nM GreB present. (C) As in A, but with σE holoenzyme to visualize transcription from the greA P2 promoter. The subpanels A, B and C are normalized in each case to the FL products present. Because of this normalization it is not apparent, but FL in (B) is 2.4-fold more abundant than in (A). (D) Transcription with σ70 holoenzyme on an immobilized template allowing resolution of supernatant (S) and supernatant with beads (S + B) fractions. The full-length and small chain cluster of transcripts are as in panels A, B and C. We interpret band ‘P’ as a pause band (see text for details).
The array of short transcripts is reminiscent of paused or arrested transcripts. Therefore the effect of adding GreB or GreA was measured with the expectation that these factors might eliminate pausing during transcription elongation and abolish the short transcripts. It can be seen from Figure 3B that GreB does alter the initial pattern of short transcripts. The Figure 3B subpanel shows GreB markedly reduces the time needed to reach the final plateau value of both full-length and short-transcripts. Compared to panel A, adding GreB increases the amount of both short- and full-length products by 2.4-fold (the values plotted in the subpanels are relative to 100% full-length activity).
GreA addition does not change the pattern of short transcripts and does not appreciably alter full-length product amount (only 1.4-fold), although the plateau is reached at the same time as when GreB is added (data not shown). The lack of inhibition by GreA is contrary to expectations of auto-repression by GreA seen in vivo (Figure 1). GreB-mediated transient changes verify that pause bands initially do exist; their faster disappearance shows the added GreB protein is catalytically active. The persistence of the cluster of short transcripts argues that the transcripts are refractory to reversal by Gre factors.
Similar results (Figure 3C) were obtained when RNAP-σE holoenzyme is used to initiate P2 transcription just 11 bp downstream from the P1 promoter. The P2 transcripts produced are appropriately shorter, 40–50 nt long, rather than 50–60 nt for P1, but the pattern seems to be the same, indicating the chain lengths must be due to differences in the 3′-ends.
The cluster of short transcripts arises from termination
The failure of Gre factors to abolish the short transcripts from the P1 or P2 promoters could be because even if rescued, elongation complexes cannot read through the arrest/pause site, or because the transcripts are released from elongation complexes independently of Gre factors. To decide, we measured transcript release in the absence of GreA or GreB. To do this, open complex formation is first allowed between RNAP and biotin-labeled templates linked to avidin-conjugated agarose beads, then NTP substrates are added. Short incubation times ensure a single round of transcription (see ‘Materials and Methods’ section). Equal volumes of supernatant (S) and supernatant containing beads (S+B fraction) are removed, and analyzed on gels to determine the proportion of short and full-length transcripts bound to the beads. Transcripts completely arrested or paused during elongation should not appear in the supernatant fraction. Transcripts completely released are expected to be equally abundant in both the S and S+B fractions because the beads are not further washed.
The results reveal similar amounts of short transcripts in both fractions when transcription is initiated with σ70-holoenzyme (Figure 3D), as well as with σE-holoenzyme (data not shown). One band is exceptional (marked P in Figure 3D), as it is twice as abundant in the bound fraction. This behavior suggests it is a paused band, whereas the other short transcripts are completely released (Figure 3D). Consistent with this notion is a similarly positioned band seen in Figure 3B that is eliminated after prolonged incubation with GreB. On the other hand, the full-length transcript is predominantly retained in the S + B fraction and not released. This feature of full-length transcript association with beads has been previously reported (35). Taken together, the appearance of short transcripts in the supernatant is due to release, not from pausing or arrest.
The terminator in the greA leader functions in vivo
The release of transcripts just described in the absence of additional factors in vitro (Figure 3D) indicates the presence of an intrinsic terminator despite the unusually broad range of chain terminating sites. The sequence of the region (Figure 1C) is also suggestive of an intrinsic terminator with a dyad symmetry stem followed by a run of U residues (Figure 4A). We constructed a lacZ fusion bearing the greAP1P2 promoters with this region present (P1P2+T) to compare with the previous greAP1P2 construct lacking this terminator. Reporter activity of the greAP1P2 fusion is lowered by the presence of the terminator to display activities that are similar to the original pA-all construct (Figure 4B), as if the terminator can solely account for the lowered reporter activity.
In order to verify that the short transcripts exist in vivo, a northern blot was performed (Figure 4C). Two clusters of short transcripts are detected, one centered ∼55 nt, and the other ∼45 nt, as if they arise from P1 and P2 promoter start sites. Notably, the clusters are present when pA-all and P1P2+T are present on a plasmid (lane 1 and 3), but nearly absent when the terminator is missing (lane 4). When present in single copy, these short transcripts are barely detectable by our northern blot assay (lane 5). One could argue that the range of RNA chain lengths in each cluster could be generated by exonuclease processing that depends on endonuclease activity of RNase III (38). However, an rnc mutation does not affect the pattern (lane 2), nor does a rne mutation (data not shown) which is well known to alter the abundance of small noncoding RNA (sncRNA) chains that function by pairing with mRNA targets (39).
In vitro probes of the terminator structures
The P1 and P2 promoted RNA chains begin at single sites (Figure 3A and C) but give rise to two clusters of transcripts, whose chain lengths vary over a range of 10 nt both in vitro and in vivo. Evidently termination, not initiation, is imprecise.
We now explore this phenomenon with a series of oligonucleotides. A set of 20-mer oligonucleotides (‘pins’), completely complementary to nascent RNA, was designed. Four members of the set (pins 1–4) anneal to progressively decreasing portions of the upstream stem I. A fifth (pin 5) anneals to all of stem II (Figure 4A). We reasoned that when each oligonucleotide is added to a transcription reaction, its potential to impair termination reflects its ability to disrupt or prevent pairing of a region of nascent RNA structure that is crucial for termination, provided the enzyme does not preclude annealing (3,10). We expect pin 5 to be a negative control, unable to disrupt RNA–RNA terminator structure because of inaccessibility, as well as that newly synthesized RNA of stem II would be more likely to anneal with the adjacent unpaired stem I RNA.
Figure 4D summarizes the effects on full-length product formation when pins are titrated in single round transcription assays. Since the saturation levels of pins 1–4 are reached at the same concentration, it seems that binding affinities of these pins are similar and yet produce different effects on termination efficiencies and patterns of terminated transcripts.
The pin that gives the least interference with termination is indeed control pin 5. Pins 3 and 4 give nearly three times more full-length transcripts than either adding pin 5 or omitting pins altogether. Therefore pins 3 and 4 are the most efficient inhibitors of termination. Pins 3 and 4 should not anneal to more than the first 7 nt of the upstream stem RNA. Pins 1 and 2 anneal to all, or almost all, of the upstream RNA stem, respectively; these alter full-length transcripts at only moderate levels. It is important that the effects of pins on full-length transcripts are accounted for by reciprocal changes of short frayed end transcripts (Figure 5). This behavior verifies that pin effects are terminator-specific whereas full-length transcripts generated by run off reflect terminator read-through.
Figure 5.

Oligodeoxyribonuclotide ‘pins’ differentially affect the pattern of short RNA chains produced during termination. (A) An example of the gel depicting products of a single round transcription in the absence (−) or the presence of 5 μM pin 1–5. Full-length product is marked with FL, arrow; the small RNA cluster is marked with an arrow in the direction of scans shown in (B). In each case, the red tracing is the scan in the presence of the pin, the black in the absence (control). The green dashed lines align the two major bands (3 and 8) as defined in (A). These experiments were repeated three or more times with similar results.
Tracings of transcript band density reveal that pins 1–4 have differential effects on the distribution of chain lengths as well (Figure 5B). For example, moderate overall inhibition of termination by pins 1 and 2 almost completely eliminates bands 3 and 10 but either has little effect (pin 2) or even slightly stimulates the mid-length species (pin 1) (bands 4–9). Pins 3 and 4 are the most efficient termination inhibitors but pin 4 seems to inhibit longer transcripts (bands 8–10) more severely than pin 3. As expected, pin 5 has little or no effect.
Changes in the terminator sequence at the bottom of the stem affect termination patterns and efficiencies
It is puzzling to find that pin 4 is such an efficient termination inhibitor when it could anneal only to the first four bases of the upstream RNA stem. The puzzle is because pins that anneal beyond these four bases are less effective, even when they anneal to all of stem I. In contrast, an oligo complementary to the entire stem I of tR2 completely inhibits termination (10).
This could reflect a key role for termination of these bases in the upstream stem or the importance of the unpaired bases upstream of the stem. Our first approach involves construction of a template in which three bases at the bottom of stem I were swapped with corresponding bases in stem II (Figure 6D). This swap preserves the same terminator structure that maintains the same content of G:C to G:U RNA base pairs, but changes the identity of the sequence adjacent to the U-rich region. The last base of the stem changes from U to G in the swapped template, creating a GAU7 from the wild-type UAU7 sequence. Intuitively, this would be expected to interfere with termination because it makes the region less AU-rich. Surprisingly, the swapped template markedly improves the precision of termination since a single short transcript now predominates (Figure 6A, lanes 1 and 2; and Figure 6E, band 2). Overall termination is also improved by the mutated template as judged by full-length transcript abundance (3.6-fold decrease). As a control, adding pin 4 to the swapped template that no longer allows it to anneal to its former site in stem I, does not alter the pattern of short transcripts (Figure 6B, lanes 5 and 6; and Figure 6E). However, the full-length product increases by ∼2-fold. This implies that regions upstream of stem I are involved in termination efficiency as well as the stem itself. With this caveat, pin effects on termination in Figure 5A are specific and the precision of termination is strongly dependent on the pairing at the bottom of the stem.
Figure 6.

Role of the terminator stem sequence and pairing on termination patterns. (A) An example of the gel depicting products of a single round transcription using wild-type (wt), pAswap (pAs), pAd1 (d1) and pAd2 (d2) greA templates. Full-length (FL) products and the small RNA cluster are marked as in Figure 5. (B) An example of the gel comparing single transcription products obtained with the pAswap template in the presence (+) or absence (−) of 5 μM pin 4. (C) Quantitative comparisons of FL from panel A, obtained from at least four independent experiments. (D) Schematic diagram highlighting differences between the four templates. Only the three basepairs at the bottom of the stem are indicated, the remaining sequences are as depicted in Figure 5A. (E) Comparative tracings of short transcript clusters taken from lanes in panels A and B. The green dashed lines align the two major bands (3 and 8) as defined in (A).
We conclude that when the pairing is preserved, the identity of the three bases at the bottom of this stem is important. Does the identity of the three bases adjacent to the run of U residues remain important if pairing is not preserved? Intuitively, the importance of this sequence is because of stem formation.
To address this, the three bases at the bottom of the stem were altered to disrupt base pairing by changing either the upstream (pAd1) or downstream (pAd2) triplet sequence (Figure 6D). If pairing is important, then it would be expected that pAd1 and pAd2 would yield more full-length transcripts than wild-type and pAswap, respectively. Indeed, pAd1 gives 2.5-fold more full-length transcripts than wild-type, and pAd2 gives 4-fold more than pAswap (Figure 6A and C).
On the other hand, if the identity of the downstream residues neighboring the U-rich sequence is important, then pAd2 should terminate more efficiently than pAd1, and be nearly as efficient as wild-type. This prediction comes from results with the pAswap template where the three bases preceding the U-rich region are UCG, the same as in pAd2 (Figure 6D). Again, we find that relative to each other, the pAd2 template gives more efficient termination than pAd1 (Figure 6C and E).We take these results to indicate that both pairing and the identity of the triplet sequence adjacent to the AU-rich region also contribute to termination efficiency at this terminator.
Both pAd1 and pAd2 disrupted templates change the patterns of transcripts within the cluster relative to both wild-type and pAswap template (Figure 6E). In both cases, the longer transcripts (bands 7–10) of the wild-type are abolished, which is consistent with the shorter stem. Unexpectedly, the shortened stem of pAd2 shifts the predominant terminated band to a position more equivalent to wild-type band 3, which is longer than the corresponding product found for pAswap (band 2).
These experiments suggest that both sequence and stem structure at the bottom of the stem are important for imprecise termination to occur (see ‘Discussion’ section).
Deleting terminator sequences at the top of the stem affect termination efficiencies but not the pattern
An array of termination sites could result from formation of alternative stem-loop structures as well as steric hindrance of RNAP by shorter versions of a long stem. In order to investigate this, we have examined a series of GraL derived templates with stems progressively shortened by a maximum of 4 bp just below the loop (Figure 7B). The transcripts of these templates reveal the pattern of multiple termination sites persists, although the termination is now less efficient (Figure 7A and C). The relative termination efficiency is systematically lowered to 4-fold, when stem length is reduced from 11 to 7 bp. This implies a key role for the bases at the bottom of the stem as determinants for termination site precision, as if alternative stem-loop structures do not form. Conversely, the length of this terminator is an important determinant of its termination efficiency.
Figure 7.

Role of the terminator stem length on termination efficiency and precision. (A) An example of the gel depicting products of a single round transcription using wild-type (wt), p10-7 greA templates generated by deleting basepairs at the top of the stem. Full-length products (FL) and the small RNA cluster are marked as in Figure 5. (B) Schematic diagram highlighting differences between the five templates. Only the four basepairs at the top of the stem are indicated, the remaining sequences are as depicted in Figure 5A. (C) Relative termination efficiencies are calculated as a percent from the densities of short transcripts divided by total transcripts produced (short+full length).
GraL sequences are conserved among enteric bacteria
The above experiments lead us to conclude that the strong P1 and P2 promoters and the intrinsic terminator in the greA leader region result in the formation in vivo and in vitro of a collection of small RNA chains in E. coli; we call this cluster collectively GraL (for greA-leader).
The next question is whether GraL has physiological significance. We find that this region is generally conserved in other enteric bacteria (Supplementary Figure S1A). In instances where sequences are not conserved the intrinsic terminator motif is nevertheless a conserved structure (Supplementary Figure S1B). For the four species considered, 17 out of 18 mutations in the stem region preserve the structure of the stem. This is a strong indication that there is an evolutionary pressure for the existence of a terminator structure associated with GraL.
We can calculate that the termination efficiency remains constant throughout growth (see ‘Discussion’ section). Thus the role for GraL could be regulation of greA expression in trans, through a variety of mechanisms. To test this, a plasmid with IPTG-inducible GraL, but not GreA, was constructed (pKP-graL) and its overproduction accompanying induction was verified by northern analysis (20-fold increase over wild-type levels). This plasmid and its vector control were introduced into strains with a chromosomal lacIq allele and its effect on the activity of the greA pA-all-lacZ fusion was monitored after GraL induction. No significant effects were found on β-gal activity, nor GreA abundance (data not shown).
Effect of GraL on cell fitness
Since greA seems not to be regulated by GraL, we searched for experimental evidence for a biological role of GraL. We asked if GraL overproduction affects cell fitness during repeated cycles of overnight growth and dilution into fresh rich (LB) media; this method provides a sensitive indication of a variety of biological functions (40). To initiate the test, we mixed equal numbers of wild-type cells harboring either a plasmid that constitutively overproduces GraL (pKP-graL), or its vector control. We monitored population abundance by marking one of the pair of strains with a malT allele. After each overnight growth cycle, cells were titrated on maltose-MacConkey plates, and red malT+ colonies and white malT mutant colonies were counted. To ensure that the malT marker mutation was not the source of fitness variation, two reciprocally marked culture mixtures were used, along with additional controls (Table 1). The reversion rate of malT− to malT+ was also monitored on maltose-MacConkey plates (data not shown). We find that the cells harboring the GraL overexpressing plasmid take over the population after four overnight cycles of growth reaching 92–95% of the population. This occurs whether GraL is overproduced in malT+ or in malT− hosts. Similar experiments were performed with a vector carrying scrambled GraL sequence (pKP-GraLScrambled), to confirm that the effects of GraL on fitness were sequence specific and not due to overproduction of any small RNA. The sequence upstream of the terminator stem was randomly mixed and the terminator hairpin was inverted. Northern blots verified that GraLScrambled expression was equivalent to GraL in the previous experiment (data not shown). As illustrated in Table 1, pKP-GraLScrambled has only a weak negative effect on fitness, in contrast to the strong positive effect of GraL. We take this to mean overproduced GraL does have a biological effect in that it clearly increases cell fitness during growth in rich media. We will discuss possible reasons below.
Table 1.
Multicopy graL improves cell fitness
| 1 | 2 | 3 | 4 | 5 | ||
|---|---|---|---|---|---|---|
| wt/vector | wt/vector | wt/pgraL | wt/vector | wt/pgraLScr | ||
| Cycle | malT/vector | malT/pgraL | malT/vector | malT/pgraLScr | malT/vector | |
| (days) | (% malT+) | (% GraL) | (% GraL) | (% GraLScr) | (% GraLScr) | |
| 0 | 55 | 49 | 48 | 47 | 48 | |
| 1 | 59 | 59 | 64 | 47 | 43 | |
| 2 | 69 | 80 | 74 | 45 | 35 | |
| 3 | 67 | 87 | 81 | 41 | 37 | |
| 4 | 72 | 96 | 90 | 37 | 34 | |
| 5 | 63 | 96 | 94 | 35 | 32 |
A control for the malT mutant is a malT mutant carrying vector control mixed with a malT+ strain also carrying vector control (column 1). A malT− strain carrying the pKP-GraL plasmid is mixed with a malT+ strain carrying a vector control and vice versa (columns 2 and 3). A malT− strain carrying the pKP-GraLScrambled plasmid is mixed with a malT+ strain carrying a vector control and vice versa (columns 4 and 5). In addition four unmixed controls are analyzed in parallel. These controls are wt/vector; wt/pgraL; malT/vector; malT/pgraL. After five cycles of daily growth, the control cultures gave few or no revertants as judged by colony color changes on maltose-MacConkey plates (data not shown). Cycle zero represents the initial distribution of the cell mixtures. The data shown are representative of three independent experiments.
We also searched MG1655 genomic sequences for possible GraL targets using Target RNA software (http://snowwhite.wellesley.edu/targetRNA) based on sequence complementarity between GraL and putative targets. Three candidates were elucidated: eco, yraM and yhbY (Supplementary Figure S2). Among these, yhbY seemed the most promising candidate as the predicted annealing sequence involved a 25 nt stretch spanning the AUG (Supplementary Figure S2). In addition, yhbY is present on the chromosome just beyond greA, in the opposite orientation. However, yhbY–lacZ translational fusion failed to reveal an effect of overproducing GraL (data not shown).
Effects of GraL overproduction revealed by microarray experiments
GraL conservation in enteric bacteria and its ability to enhance fitness led us to try to identify specific examples of GraL regulated gene expression by microarray analysis. We anticipate subtle changes would be detectable by microarrays because it took several days of culture for GraL overproducing strains to predominate. We chose to study the effects of GraL overproduction with an inducible promoter rather than deletion because eliminating the GraL terminator (with or without P1 and P2 promoters) would lead to changes in GreA levels. It has been shown that deleting or overexpressing GreA affects transcription of a large set of genes (41).
The effects of overproduced GraL were measured during exponential growth in LB as for the fitness experiments. We tested continuous exposure to elevated levels of GraL as well as a 15 min induction. We expected that short-term induction would reveal direct targets of GraL, whereas long-term exposure would generate many indirect effects as well. In all cases samples were collected in exponential phase of growth in LB (A600 = 0.6) (see ‘Materials and Methods’ section for details). Since few changes were found in a wild-type strain, similar experiments were performed in a ppGpp deficient strain (ppGpp0) because the absence of ppGpp renders cells vulnerable to a variety of global regulators. The absence of ppGpp does not result in a change of GreA levels (data not shown). We also find ppGpp has no significant effects on reporter fusions measured as in Figures 1A, 2B and 4B, nor in our in vitro transcription assays presented in Figure 3 (data not shown).
Our scoring criteria with some exceptions required at least a 3-fold change in the signal ratio, where both signals had to be significant (P ≤ 0.05) and at least one of the signal’s value had to be above 300 (see legend to Table 2 and Supplementary Tables S1 and S2). Four strains (wt/GraL, wt/vector, ppGpp0/GraL, ppGpp0/vector) are compared four ways. First, ppGpp0 strain ± GraL; second, wt strain ± GraL; third ppGpp0 strain + GraL with wt strain + GraL; fourth, ppGpp0 strain with wt (Supplementary Tables S3 and S4). Table 2 contains several categories that emerge from these comparisons, excluding genes affected by ppGpp only (this class of genes is beyond the focus of this study, but the data is included in Supplementary Tables S3 and S4).
Table 2.
GraL overproduction microarray analysis
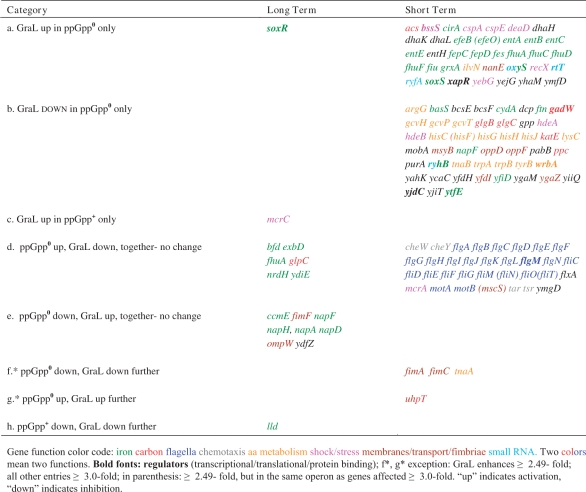 |
These comparisons are surprising in several ways. For example, although effects of GraL depend on presence or absence of ppGpp, there is no case where GraL has the same effect in both backgrounds. Also, it is evident that gene expression during long-term GraL overproduction is less severely affected than during the short term, judging by the number of genes (45 versus 173; or 17 versus 130 when genes exclusively affected by ppGpp are excluded). In general, genes affected in the short-term are not a subset of those affected in the long-term; instead the common set is limited to: efeB, efeU, fhuA, napF, oxyS, relA, ryhB and spoT (Table 2 and Supplementary Tables S3 and S4), but again they don’t appear in the same category. Of course relA and spoT are an exception because they are deleted in ppGpp0 strains and thus their abundance seems to be down-regulated whether or not GraL is present.
The most predominant functional classes of genes found to be affected are those involved in iron uptake and metabolism (33 genes); flagella (25 genes) and amino acid metabolism (17 genes). All of these are reported to be regulated by ppGpp itself (20,27), underscoring a relation between GraL and ppGpp. It is notable that different iron genes are affected after short- and long-term exposure to GraL, whereas flagella genes and amino acid metabolism genes are only affected during short-term exposure (see ‘Discussion’ section).
DISCUSSION
GreA itself is a transcription regulator that can interact with RNA polymerase at two levels, relief of elongational pausing (13,16) and promoter-specific facilitation of initiation (27). These features raise the possibility that GreA functions could be recruited to feedback regulate its own synthesis. Indeed, reporter lacZ fusions indicate that GreA can auto-regulate its expression; deletion of greA derepresses, and overproduction of GreA represses the reporter activity 2–3-fold. However, this phenomenon could not be reproduced with the pure in vitro transcription system. Thus we conclude that the auto-regulation is due to indirect effects or additional factors are necessary to observe it in vitro. We were instead rewarded with a different discovery. The greA leader region contains two strong promoters and an unusual terminator that gives rise to two clusters of small RNA chains that we call GraL.
Despite the primer extension evidence (Figure 1A), the existence of the P3 and P4 promoters is questionable. First, they lack clear consensus sequences (Figure 1C). Second, we are unable to find in vitro transcription conditions that detect their activity (with RNAPσ70 or σE; data not shown). Third, lacZ reporter fusions yield barely measurable activities. It seems likely P3 and P4 primer extension bands are generated post-transcriptionally. Also, note that the primer anneals to sequences downstream of the terminator and only the P1 and P2 transcripts that read through the terminator are detected.
The intrinsic terminator accounts for the differences in lacZ reporter activities between greApA-all and P1 or P1P2 (Figure 4B). Also, auto-regulation by GreA, mentioned above, seems to rely on the presence of this terminator as the activity of the greAP1P2+T fusion is derepressed in the absence of GreA, similar to the Pall fusion. On the other hand, greAP1 as well as greAP1P2 fusion strains did not exhibit this effect (data not shown).
The extent of termination in vivo can be calculated as 66% efficient from the difference between P1, P1P2 (∼750 U) and P1P2 + T or pA-all (∼250 U). The slopes of this differential plot seem constant over a wide range of cellular densities. In vivo termination efficiency is in good agreement with termination in vitro: ∼60% (Figures 3 and 7).
Termination at the greA intrinsic terminator is exceptionally imprecise. The GraL RNA chains comprise a population whose ends range over ten nucleotides. The occurrence of these frayed ends in vivo is demonstrable by northern blots (Figure 4C). This could be explained by post-transcriptional endonuclease attack, followed by exonucleolytic nibbling. However, the cluster of RNA chains is visualized in a pure in vitro transcription system (Figure 3A and B). The purity of the in vitro system is validated because more precise termination is accomplished by swapping three base pairs at the base of the stem, preserving the structure of the terminator (Figure 6). Nevertheless, we tested the effects of rnc and rne mutants by northern blots, and found no significant effect (Figure 4C and data not shown).
We attempted to identify the ends of the short RNA chains by direct RNA sequencing (using 3′deoxy-NTPs). However, compression due to the GC-rich sequence of stem II prevented a clear identification of the first termination site, despite substituting ITP for GTP in sequencing reactions (data not shown). Because of this caveat, we can pinpoint each terminated position ±2 nt in the UAU7GCU2 sequence.
The predicted structure with the 11 bp stem is rare; terminators with such long stems comprise only 12% among 148 natural terminators surveyed (42). To our knowledge, imprecise termination over a range of 10 sites is not reported previously in prokaryotes or eukaryotes. Rho-dependent termination, which is distinctly different from intrinsic termination, is known for its imprecision but the stop points are often spread over a 100 bp of DNA (43). Therefore, we decided the basis of this behavior warrants further investigation.
A recent allosteric termination model proposes that the terminator hairpin forms within RNAP and induces extensive conformation changes across polymerase (7). In this model, the 7–8 bp lambda tR2 hairpin ultimately clashes with the G(trigger)-loop to shorten the RNA–DNA hybrid that leads to the collapse of the transcription bubble and transcript release. It could be imagined that the 11 bp GraL stem might enhance the conformational constraints within RNAP. When the GraL hairpin is shortened without changing the 7 bp sequence at the bottom of the stem the termination efficiency is greatly reduced (Figure 7). This could be viewed as favoring or disfavoring the model. On one hand it could be expected that the GraL terminator should be very efficient while having just a 7 bp hairpin. On the other, if the base line value for the termination efficiency is applied from the GraL 7 bp hairpin construct, it is consistent that the longer the stem length the better termination. Without crosslinking studies and modeling it is difficult at this point to predict what would happen with an 11 bp stem.
It has been proposed that formation of 2–3 bp at the bottom of the stem is critical for termination through shearing of the RNA–DNA hybrid (4,9). Because of the space constraint, basepairing at the bottom of the stem might be limited for longer stems. Thus it can be imagined that the GraL hairpin does not form completely. Yet, if pairing is disrupted at the base of the stem (pAd1), termination efficiency is reduced (Figure 6), as if pairing of the wild-type GraL stem is complete.
On the other hand, the 3 nt sequence just upstream of the U-tract is also important for termination, independent of basepairing. If this sequence is changed but basepairing is maintained, as for pAswap, termination efficiency increases relative to wild-type. If the same 3 nt sequence is present without basepairing (pAd2), the efficiency of termination is restored to wild-type levels (Figure 6).
Still, the imprecision of the GraL terminator is yet another issue. Because of its uniqueness it is not addressed by current models, which are derived from studies of precise terminators. Our evidence is that basepairing and sequence at the bottom of the stem, not stem length, are important determinants of precision because imprecision persists when the stem is shortened from the top (Figure 7).
The UAU7GCU2 sequence of the GraL U-rich tract is also unique, as the first three residues of the tract are typically UUU (41). However, the second A residue in this region of GraL does not seem to be evolutionarily conserved (Supplementary Figure S1), whereas the bottom basepair GU is. The significance of this is uncertain without knowing the precision of the other terminators. Still, the precision is greatly improved when the GU basepair is replaced by UG (pAswap, Figure 6).
Overall, the GraL terminator is an exception in terms of both structure and multiple termination sites. Its study can provide additional insights and constraints into mechanisms of termination derived from models based on typical terminators. Unusual chimeric terminators have contributed useful information (44), and yet there are naturally occuring terminators that lack dyad symmetry stems and poly-U tracts that are unexplored (42).
It is a puzzle why transcription from the two strong promoters (P1 and P2) is terminated so that greA expression depends largely on read-through. To maintain a constant amount of greA expression (28) it would seem simpler to have a single constitutive promoter. The complexity of this region may be explained by additional role for GraL, independent of GreA.
An additional role for GraL is suggested by the conservation of its sequences and/or predicted structures among related enteric bacteria. The biological importance of GraL is experimentally verified by the fitness experiments described in Table 1. Cells with constitutive overexpression of GraL do enhance biological fitness as judged by their 95% predominance over cells with wild-type GraL expression during repeated cycles of overnight growth on rich LB media. This could be due to effects during exponential growth, stationary-phase or outgrowth after dilution into the fresh medium. Since overexpression of an RNA with scrambled GraL sequence did not show similar effect, we conclude these effects are GraL specific.
In parallel with wild-type strains, the fitness experiment was attempted in a ppGpp0 host. However, several malT alleles themselves had effects on fitness in this background and this prevented assessment of specific effects of GraL. We suspect this is because so many cell processes are affected by ppGpp (21) that the malT mutation is likely to give multiple indirect effects.
Profiles of global transcription activity were performed in search of presumably subtle changes due to GraL overproduction. Contrary to our expectation acute GraL induction did not produce the expected smaller subset of genes when compared to long-term exposure. Strikingly, short-term changes appear only in a ppGpp0 background. We attribute this to the likelihood that gene expression in a ppGpp0 strain is already imbalanced and a subtle perturbation caused by GraL overexpression can have more pronounced effects.
Many genes repressed by Fur are activated by GraL in ppGpp0 background during short-term exposure. A simple explanation would be that GraL affects Fur levels, instead of regulating expression of each gene individually. On the other hand, this does not explain why only some, and not all Fur-dependent genes are derepressed [specifically, the suf genes which are invariably affected by iron starvation (45)]. Since a western blot analysis reveals that Fur levels change by only ∼2-fold (Figure 8), perhaps there is a hierarchy of sensitivity of Fur operators, i.e. changes in Fur levels can titrate out operators with weak Fur binding. The mechanism by which GraL affects Fur levels remains to be determined.
Figure 8.
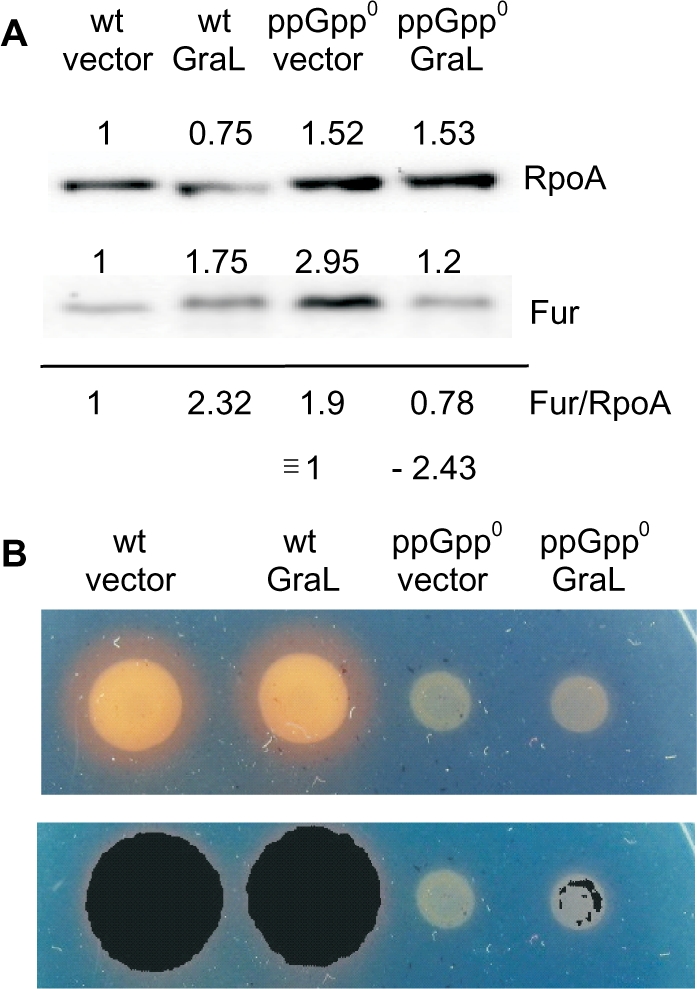
Effects of GraL overexpression on Fur levels and iron assimilation phenotypes. (A) Example of a western blot with anti-Fur and anti-RpoA (control) antibodies. The numbers above each band represent densities in arbitrary units. Numbers below the line give the ratios of Fur/RpoA, where the vector control ratio is defined as 1. Plasmid pKP-GraL is labeled GraL; the vector label corresponds to the plasmid control (pBR-plac). (B) Top—image of the appropriate cell cultures spotted on CAS plates. Bottom—Corel Draw software enhancements of color differences of upper panel images obtained by swapping orange for black, showing specks of black on the periphery of the ppGpp0 pGraL cells.
Does GraL nevertheless induce an unusual form of iron starvation or perhaps change the cell tolerance to limiting iron concentration? GraL activates some genes involved in the synthesis of enterochelin (entA, B, C and E) as well as the ent-Fe complex uptake (fepC, D) and its use (fes). The uptake of other forms of iron involves fhu, cirA and fiu. This reinforces the possibility that GraL overproduction causes or mimics an iron starvation.
We pursued this with the use of CAS plates, where the formation of orange color on blue plates is an indication of excreted enterochelin and thus demonstrates the cell’s need for iron. As evident from Figure 8B, there is no significant difference between strains bearing the GraL overproducing plasmid or the vector control in ppGpp+ background. However, a GraL-dependent slight color variation is detected in ppGpp0 strains that could be enhanced by color swapping software when black is substituted for orange (Figure 8B, lower panel). This might indicate perturbance of iron metabolism in the absence of ppGpp and presence of GraL.
On the other hand, GraL represses 25 genes involved in flagella synthesis and four chemotaxis genes during short-term exposure (Table 2). Analysis of the data from four way comparisons (Supplementary Table S4) reveals that these genes are actually induced in the ppGpp0 strain and GraL cancels this effect. These effects are evident for genes in early, middle and late operons for flagella synthesis, and include those regulated by σ70 and σF, and also apply to transcription of flagellar regulators flgM, flhDC (but not fliA that encodes σF itself). Exponential growth in LB is known to involve continuous switching between many different nutrients (46). There is also a report that carbon source starvation generally derepresses flagella and chemotaxis genes (47). Perhaps when GraL is overproduced in the absence of ppGpp, either starvation is not sensed, or there is not enough starvation to induce flagella. In support of this hypothesis, in a ppGpp0 strain, GraL represses 17 genes involved in amino acid metabolism, including arginine, glycine, histidine, lysine, tryptophan and tyrosine.
Clear biological effects can be attributed to GraL. Yet, despite regulatory effects on over 100 genes, we are unable to identify the complementarity with target mRNAs that is usually expected of many small RNAs (39). It is possible that GraL does not function through basepairing, but instead through binding of proteins, similarly to CsrA or 6S RNA (39).
It is interesting to note that in eukaryotes a chaperone that protects RNA polymerase III transcripts from 3′ exonucleases and promotes their maturation, La protein, binds RNA depending on the number of U residues at the 3′ termini (48). Products of PolIII that do not possess long enough 3′oligo U ends, undergo maturation in a different pathway. Perhaps something similar is happening in E. coli and there is a different function associated with different members of the GraL cluster, rather than all of the species acting similarly.
SUPPLEMENTARY DATA
Supplementary Data are available at NAR Online.
FUNDING
Funding for open access charge: this work was supported by Eunice Kennedy Shriver National Institute of Child Health and Human Development intramural program of the National Institutes of Health.
Conflict of interest statement. None declared.
ACKNOWLEDGEMENTS
The authors wish to acknowledge helpful discussions with Dr A. Bougdour, Dr N. Komissarova, Dr D.E.A. Lewis, Dr R. Maraia, Dr J.W. Roberts, Dr T. Velikodvorskaya, Dr D. Vinella and the Friday Seminar group. Dr M. Vasil provided the Fur antibody and Dr D. Vinella provided the CAS plates. O-methyl-NTPs were a gift from Dr N. Komissarova, and ApA from Dr V.J. Hernandez. M. Blum prepared growth media.
REFERENCES
- 1.Nudler E, Gottesman M. Transcription termination and anti-termination in E. coli. Genes Cells. 2002;7:755–768. doi: 10.1046/j.1365-2443.2002.00563.x. [DOI] [PubMed] [Google Scholar]
- 2.Greenblatt JF. Transcription termination: pulling out all the stops. Cell. 2008;132:917–918. doi: 10.1016/j.cell.2008.03.003. [DOI] [PubMed] [Google Scholar]
- 3.Yarnell WS, Roberts JW. Mechanism of intrinsic transcription termination and antitermination. Science. 1999;284:611–615. doi: 10.1126/science.284.5414.611. [DOI] [PubMed] [Google Scholar]
- 4.Komissarova N, Becker J, Solter S, Kireeva M, Kashlev M. Shortening of RNA:DNA hybrid in the elongation complex of RNA polymerase is a prerequisite for transcription termination. Mol. Cell. 2002;10:1151–1162. doi: 10.1016/s1097-2765(02)00738-4. [DOI] [PubMed] [Google Scholar]
- 5.Toulokhonov I, Landick R. The flap domain is required for pause RNA hairpin inhibition of catalysis by RNA polymerase and can modulate intrinsic termination. Mol. Cell. 2003;12:1125–1136. doi: 10.1016/s1097-2765(03)00439-8. [DOI] [PubMed] [Google Scholar]
- 6.Santangelo TJ, Roberts JW. Forward translocation is the natural pathway of RNA release at an intrinsic terminator. Mol. Cell. 2004;14:117–126. doi: 10.1016/s1097-2765(04)00154-6. [DOI] [PubMed] [Google Scholar]
- 7.Epshtein V, Cardinale CJ, Ruckenstein AE, Borukhov S, Nudler E. An allosteric path to transcription termination. Mol. Cell. 2008;28:991–1001. doi: 10.1016/j.molcel.2007.10.011. [DOI] [PubMed] [Google Scholar]
- 8.Datta K, von Hippel PH. Direct spectroscopic study of reconstituted transcription complexes reveals that intrinsic termination is driven primarily by thermodynamic destabilization of the nucleic acid framework. J. Biol. Chem. 2008;283:3537–3549. doi: 10.1074/jbc.M707998200. [DOI] [PMC free article] [PubMed] [Google Scholar]
- 9.Larson MH, Greenleaf WJ, Landick R, Block SM. Applied force reveals mechanistic and energetic details of transcription termination. Cell. 2008;132:971–982. doi: 10.1016/j.cell.2008.01.027. [DOI] [PMC free article] [PubMed] [Google Scholar]
- 10.Gusarov I, Nudler E. The mechanism of intrinsic transcription termination. Mol. Cell. 1999;3:495–504. doi: 10.1016/s1097-2765(00)80477-3. [DOI] [PubMed] [Google Scholar]
- 11.Komissarova N, Kashlev M. Transcriptional arrest: Escherichia coli RNA polymerase translocates backward, leaving the 3′ end of the RNA intact and extruded. Proc. Natl Acad. Sci. USA. 1997;94:1755–1780. doi: 10.1073/pnas.94.5.1755. [DOI] [PMC free article] [PubMed] [Google Scholar]
- 12.Nickels BE, Hochschild A. Regulation of RNA polymerase through the secondary channel. Cell. 2004;118:281–284. doi: 10.1016/j.cell.2004.07.021. [DOI] [PubMed] [Google Scholar]
- 13.Borukhov S, Sagitov V, Goldfarb A. Transcript cleavage factors from E. coli. Cell. 1993;72:459–466. doi: 10.1016/0092-8674(93)90121-6. [DOI] [PubMed] [Google Scholar]
- 14.Hsu LM, Vo NV, Chamberlin MJ. Escherichia coli transcript cleavage factors GreA and GreB stimulate promoter escape and gene expression in vivo and in vitro. Proc. Natl Acad. Sci. USA. 1995;92:11588–11592. doi: 10.1073/pnas.92.25.11588. [DOI] [PMC free article] [PubMed] [Google Scholar]
- 15.Laptenko O, Lee J, Lomakin I, Borukhov S. Transcript cleavage factors GreA and GreB act as a transient catalytic components of RNA polymerase. EMBO J. 2003;22:6322–6334. doi: 10.1093/emboj/cdg610. [DOI] [PMC free article] [PubMed] [Google Scholar]
- 16.Borukhov S, Lee J, Laptenko O. Bacterial transcription elongation factors: new insights into molecular mechanism of action. Mol. Microbiol. 2005;55:1315–1324. doi: 10.1111/j.1365-2958.2004.04481.x. [DOI] [PubMed] [Google Scholar]
- 17.Blankschein MD, Potrykus K, Grace E, Choudhary A, Vinella D, Cashel M, Herman C. TraR, a homolog of a RNAP secondary channel interactor, modulates transcription. PLoS Genet. 2008;5:e1000345. doi: 10.1371/journal.pgen.1000345. [DOI] [PMC free article] [PubMed] [Google Scholar]
- 18.Lamour V, Rutherford ST, Kuznedelov K, Ramagopal UA, Gourse RL, Severinov K, Darst SA. Crystal structure of Escherichia coli Rnk, a new RNA polymerase-interacting protein. J. Mol. Biol. 2008;383:367–379. doi: 10.1016/j.jmb.2008.08.011. [DOI] [PMC free article] [PubMed] [Google Scholar]
- 19.Lamour V, Hogan BP, Erie DA, Darst SA. Crystal structure of Thermus aquaticus Gfh1, a Gre-factor paralog that inhibits rather than stimulates transcript cleavage. J. Mol. Biol. 2006;356:179–188. doi: 10.1016/j.jmb.2005.10.083. [DOI] [PubMed] [Google Scholar]
- 20.Cashel M, Gentry D, Hernandez VJ, Vinella D. The stringent response. In: Neidhardt FC, editor. Escherichia coli and Salmonella: Cellular and Molecular Biology. Washington DC: ASM Press; 1996. pp. 1458–1496. [Google Scholar]
- 21.Potrykus K, Cashel M. (p)ppGpp: still Magical? Annu. Rev. Microbiol. 2008;62:35–51. doi: 10.1146/annurev.micro.62.081307.162903. [DOI] [PubMed] [Google Scholar]
- 22.Perederina A, Svetlov V, Vassylyeva MN, Tahirov TH, Yokoyama S, Artsimovitch I, Vassylyev DG. Regulation through the secondary channel-structural framework for ppGpp-DksA synergism during transcription. Cell. 2004;118:297–309. doi: 10.1016/j.cell.2004.06.030. [DOI] [PubMed] [Google Scholar]
- 23.Paul BJ, Berkmen MB, Gourse RL. DksA potentiates direct activation of amino acid promoters by ppGpp. Proc. Natl Acad. Sci. USA. 2005;102:7823–7828. doi: 10.1073/pnas.0501170102. [DOI] [PMC free article] [PubMed] [Google Scholar]
- 24.Artsimovitch I, Patlan V, Sekine S, Vassylyeva MN, Hosaka T, Ochi K, Yokoyama S, Vassylyev D. Structural basis for transcriptional regulation by alarmone ppGpp. Cell. 2004;117:299–310. doi: 10.1016/s0092-8674(04)00401-5. [DOI] [PubMed] [Google Scholar]
- 25.Magnusson LU, Gummesson B, Joksimovic P, Farewell A, Nystrom T. Identical, Independent, and Opposing roles of ppGpp and DksA in Escherichia coli. J. Bacteriol. 2007;189:5193–5202. doi: 10.1128/JB.00330-07. [DOI] [PMC free article] [PubMed] [Google Scholar]
- 26.Aberg A, Shingler V, Balsalobre C. Regulation of the fimB promoter: a case of differential regulation by ppGpp and DksA in vivo. Mol. Microbiol. 2008;67:1223–1241. doi: 10.1111/j.1365-2958.2008.06115.x. [DOI] [PubMed] [Google Scholar]
- 27.Potrykus K, Vinella D, Murphy H, Szalewska-Palasz A, D’Ari R, Cashel M. Antagonistic regulation of Escherichia coli ribosomal RNA rrnB P1 promoter activity by GreA and DksA. J. Biol. Chem. 2006;281:15238–15248. doi: 10.1074/jbc.M601531200. [DOI] [PubMed] [Google Scholar]
- 28.Rutherford ST, Lemke JJ, Vrentas CE, Gaal T, Ross W, Gourse RL. Effects of DksA, GreA, and GreB on transcription initiation: insights into the mechanisms of factors that bind in the secondary channel of RNA polymerase. J. Mol. Biol. 2007;366:1243–1257. doi: 10.1016/j.jmb.2006.12.013. [DOI] [PMC free article] [PubMed] [Google Scholar]
- 29.Miller JH. A Short Course in Bacterial Genetics. Cold Spring Harbor, NY: Cold Spring Harbor Laboratory Press; 1972. [Google Scholar]
- 30.Simons RW, Houman F, Kleckner N. Improved single and multicopy lac-based cloning vectors for protein and operon fusions. Gene. 1987;53:85–96. doi: 10.1016/0378-1119(87)90095-3. [DOI] [PubMed] [Google Scholar]
- 31.Rouviere PE, Penas AL, Mecsas J, Lu CZ, Rudd KE, Gross CA. rpoE, the gene encoding the second heat-shock sigma factor, σE, in Escherichia coli. EMBO J. 1995;14:1032–1042. doi: 10.1002/j.1460-2075.1995.tb07084.x. [DOI] [PMC free article] [PubMed] [Google Scholar]
- 32.Vinella D, Albrecht C, Cashel M, D'A;ri R. Iron limitation induces SpoT-dependent accumulation of ppGpp in Escherichia coli. Mol. Microbiol. 2005;56:958–970. doi: 10.1111/j.1365-2958.2005.04601.x. [DOI] [PubMed] [Google Scholar]
- 33.Cashel M. Preparation of guanosine tetraphosphate (ppGpp) and guanosine pentaphosphate (pppGpp) from Escherichia coli ribosomes. Anal. Biochem. 1974;57:100–107. doi: 10.1016/0003-2697(74)90056-6. [DOI] [PubMed] [Google Scholar]
- 34.Lane WJ, Darst SA. The structural basis for promoter -35 element recognition by the group IV σ factors. PLoS Biol. 2006;4:e269. doi: 10.1371/journal.pbio.0040269. [DOI] [PMC free article] [PubMed] [Google Scholar]
- 35.Kashlev M, Komissarova N. Transcription termination: primary intermediates and secondary adducts. J. Biol. Chem. 2002;277:14501–14508. doi: 10.1074/jbc.M200215200. [DOI] [PubMed] [Google Scholar]
- 36.Lewis DEA, Komissarova N, Le P, Kashlev M, Adhya S. DNA sequences in gal operon override transcription elongation blocks. J. Mol. Biol. 2008;382:843–858. doi: 10.1016/j.jmb.2008.07.060. [DOI] [PMC free article] [PubMed] [Google Scholar]
- 37.Rhodius VA, Suh WC, Nonaka G, West J, Gross CA. Conserved and variable functions of the sigmaE stress response in related genomes. PLoS Biol. 2006;4:e2. doi: 10.1371/journal.pbio.0040002. [DOI] [PMC free article] [PubMed] [Google Scholar]
- 38.Guarneros G, Montañez C, Hernandez T, Court D. Posttranscriptional control of bacteriophage lambda gene expression from a site distal to the gene. Proc. Natl Acad. Sci. USA. 1982;79:238–242. doi: 10.1073/pnas.79.2.238. [DOI] [PMC free article] [PubMed] [Google Scholar]
- 39.Gottesman S. The small RNA regulators of Escherichia coli, roles and mechanisms. Annu. Rev. Microbiol. 2004;58:303–328. doi: 10.1146/annurev.micro.58.030603.123841. [DOI] [PubMed] [Google Scholar]
- 40.Cooper TF, Rozen DE, Lenski RE. Parallel changes in gene expression after 20,000 generations of evolution in Escherichia coli. Proc. Natl Acad. Sci. USA. 2003;100:1072–1077. doi: 10.1073/pnas.0334340100. [DOI] [PMC free article] [PubMed] [Google Scholar]
- 41.Stepanova E, Lee J, Ozerova M, Semenova E, Datsenko K, Wanner BL, Severinov K, Borukhov S. Analysis of promoter targets for Escherichia coli transcription elongation factor GreA in vivo and in vitro. J. Bacteriol. 2007;189:8772–8785. doi: 10.1128/JB.00911-07. [DOI] [PMC free article] [PubMed] [Google Scholar]
- 42.d'A;ubenton Carafa Y, Brody E, Thermes C. Prediction of rho-independent Escherichia coli transcription terminators. A statistical analysis of their RNA stem-loop structures. J. Mol. Biol. 1990;216:835–858. doi: 10.1016/s0022-2836(99)80005-9. [DOI] [PubMed] [Google Scholar]
- 43.Richardson JP, Greenblatt JL. Control of RNA chain elongation and termination. In: Neidhardt FC, editor. Escherichia coli and Salmonella: Cellular and Molecular Biology. Washington DC: ASM Press; 1996. pp. 822–848. [Google Scholar]
- 44.Reynolds R, Chamberlin MJ. Parameters affecting transcription termination by Escherichia coli RNA. II. Construction and analysis of hybrid terminators. J. Mol. Biol. 1992;224:53–63. doi: 10.1016/0022-2836(92)90575-5. [DOI] [PubMed] [Google Scholar]
- 45.McHugh JP, Rodriguez-Quinones F, Abdul-Tehrani H, Svistunenko DA, Poole RK, Cooper CE, Andrews SC. Global iron-dependent gene regulation in Escherichia coli. A new mechanism for iron homeostasis. J. Biol. Chem. 2003;278:29478–29486. doi: 10.1074/jbc.M303381200. [DOI] [PubMed] [Google Scholar]
- 46.Sezonov G, Joseleau-Petit D, D'A;ri R. Escherichia coli physiology in Luria-Bertani broth. J. Bacteriol. 2007;189:8746–8749. doi: 10.1128/JB.01368-07. [DOI] [PMC free article] [PubMed] [Google Scholar]
- 47.Liu M, Durfee T, Cabrera JE, Zhao K, Jin DJ, Blattner FR. Global transcriptional programs reveal a carbon source foraging strategy by Escherichia coli. J. Biol. Chem. 2005;280:15921–15927. doi: 10.1074/jbc.M414050200. [DOI] [PubMed] [Google Scholar]
- 48.Huang Y, Intine RV, Mozlin A, Hasson S, Maraia RJ. Mutations in the RNA polymerase III subunit Rpc11p that decrease RNA 3′ cleavage activity increase 3′-terminal oligo(U) length and La-dependent tRNA processing. Mol. Cell Biol. 2005;25:621–636. doi: 10.1128/MCB.25.2.621-636.2005. [DOI] [PMC free article] [PubMed] [Google Scholar]