Abstract
In Arabidopsis thaliana, biosynthesis of the essential thiol antioxidant, glutathione (GSH), is plastid-regulated, but many GSH functions, including heavy metal detoxification and plant defense activation, depend on cytosolic GSH. This finding suggests that plastid and cytosol thiol pools are closely integrated and we show that in Arabidopsis this integration requires a family of three plastid thiol transporters homologous to the Plasmodium falciparum chloroquine-resistance transporter, PfCRT. Arabidopsis mutants lacking these transporters are heavy metal-sensitive, GSH-deficient, and hypersensitive to Phytophthora infection, confirming a direct requirement for correct GSH homeostasis in defense responses. Compartment-specific measurements of the glutathione redox potential using redox-sensitive GFP showed that knockout of the entire transporter family resulted in a more oxidized glutathione redox potential in the cytosol, but not in the plastids, indicating the GSH-deficient phenotype is restricted to the cytosolic compartment. Expression of the transporters in Xenopus oocytes confirmed that each can mediate GSH uptake. We conclude that these transporters play a significant role in regulating GSH levels and the redox potential of the cytosol.
Keywords: Arabidopsis, malaria, antioxidant, immune response
The potentially damaging end-products of aerobic energy metabolism, reactive oxygen species (ROS), are powerful signaling components linking growth, metabolism, and defense responses in cells (1 –4). In plant cells, a complex antioxidant network with glutathione (GSH) at its center has evolved to buffer ROS. Because both the levels and oxidation state of GSH are directly influenced by ROS, GSH is a key redox-signaling component (5 –10).
GSH is synthesized in two steps (11) catalyzed by the rate-limiting glutamate-cysteine ligase (GSH1; EC 6.3.2.2) and glutathione synthase (GSH2; EC 6.3.2.3). In Arabidopsis, GSH1 is exclusively targeted to the plastid, while GSH2 is targeted to both plastid and cytosol (12). Consequently, the pathway intermediate, γ-glutamylcysteine (γ-EC), must be exported from the plastid to allow for cytosolic GSH biosynthesis. This finding was recently confirmed by the observation that inviable gsh2 mutants can be fully complemented by expression of functional GSH2 only in the cytosol (13), suggesting that thiol transport between compartments is essential for maintaining both GSH levels and redox-based signaling pathways, although no plastid thiol transporters have yet been identified (13 –17).
Results
Identification of Mutants Resistant to a GSH Biosynthesis Inhibitor.
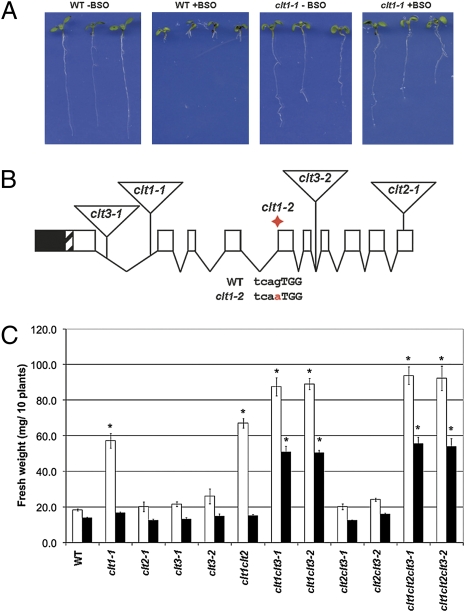
To gain insights into GSH homeostasis, we sought to identify mutants with altered GSH-dependent responses. We designed a genetic screen based on the observation that WT plants, grown in the presence of an inhibitor of GSH1, L-buthionine-SR-sulfoximine (BSO), phenocopy the severely GSH-deficient GSH1 mutant, rootmeristemless1 (rml1), which lacks meristematic activity in the root (18) (Fig. 1A). By selecting BSO-resistant mutants, we identified two alleles of locus At5g19380, encoding a predicted membrane transport protein (Fig. 1A and Table S1).
Fig. 1.
clt1 mutants are resistant to BSO. (A) WT and clt1-1 mutant seedlings were grown for 7 d in the absence and presence of 0.8-mM BSO on vertical plates. BSO arrests WT primary root growth, whereas clt1 mutations confer resistance to BSO. (B) A schematic of a generalized CLT gene showing exons (boxes) and introns (lines) (in CLT3 the last three exons are fused). The positions of clt T-DNA insertion alleles are shown by triangles and the red diamond indicates the splice site mutation in the clt1-2 allele (SI Materials and Methods). (C) WT and clt mutants were grown in the presence of 0.8-mM (open bars) and 1.2-mM (filled bars) BSO for 14 d. Shoot FW of pools of 10 plants was measured, n ≥ 4. Error bars represent SEM; * denotes a significant difference from the WT; P < 0.05 (Student’s t test,). In the absence of BSO, no significant difference in growth from the WT was observed for any line (Fig. S1).
We identified the malaria parasite CHLOROQUINE-RESISTANCE TRANSPORTER (PfCRT) as a homolog and consequently designated the BSO-resistance locus CRT-LIKE TRANSPORTER1 (CLT1) (Fig. 1B). Our homology search also revealed two related genes in Arabidopsis, At4g24460 (CLT2) and At5g12160/12170 (CLT3) (SI Materials and Methods) as well as homologs from higher plants, the moss, Physcomitrella patens, the alga, Chlamydomonas reinhardtii, the slime mold, Dictyostelium discoideum, and parasitic protozoans, such as Cryptosporidium parvum (Fig. S2). Of these, only PfCRT has been studied (19) and, although its function is unknown, it has been suggested that it may transport amino acids and small peptides (20).
To investigate CLT gene family function in Arabidopsis, we identified mutants in both CLT2 and CLT3 (Fig. 1B and Fig. S3). No WT transcript was detected in the clt1-1, clt2-1, and clt3-2 mutants, and full-length CLT3 transcript was decreased at least 10-fold in the clt3-1 mutant (Fig. S3). The alleles clt1-1, clt2-1, and clt3-1 are hereafter referred to as clt1, clt2, and clt3 and were used in all mutant combinations, unless otherwise stated. Under routine growth conditions, none of the clt mutants or mutant combinations exhibited different growth to WT (Fig S1). Among the single mutants, only clt1 exhibited increased resistance to 0.8-mM BSO (Fig. 1 A and C); however, in the presence of 1.2-mM BSO, only the clt1clt3 and clt1clt2clt3 mutants exhibited resistance (Fig. 1C). Thus, loss of CLT1 confers resistance to BSO, which is enhanced by loss of CLT3.
clt Mutants Are Sensitive to Cd2+ and Have Decreased GSH.
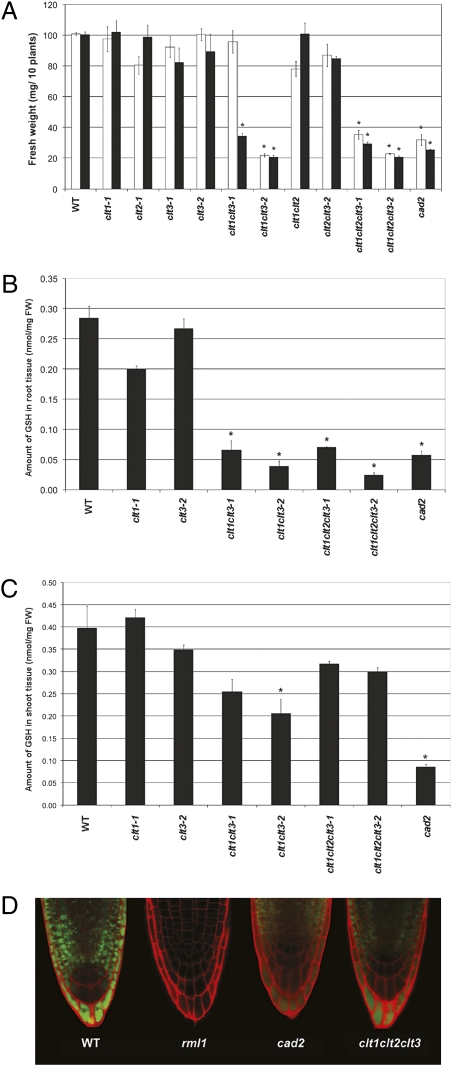
To investigate whether clt mutations affect GSH homeostasis, we tested the mutants for sensitivity to Cd2+, which correlates with GSH availability (21). These experiments included all mutant combinations made with both clt3 alleles. In the absence of Cd, all lines grew to the same extent (Fig. S1). Plants were grown in the presence of two concentrations of Cd2+ (1.8 and 3.0 μM) on which WT plants show no inhibition of growth (Fig. 2A). The single clt mutants showed no sensitivity to Cd2+, while among the multiple mutant combinations, only clt1clt3 and clt1clt2clt3 showed increased Cd2+-sensitivity, similar to the partially GSH-deficient biosynthetic mutant, cad2 (21) In the presence of 0.8 μM Cd2+, clt1clt3-2 was more sensitive than clt1clt3-1, consistent with the residual expression observed for the clt3-1 allele, and the clt1clt2clt3-1 triple mutant was more sensitive than clt1clt3-1, indicating that clt2 can also have an effect on Cd2+ sensitivity, although no apparent effect was observed in double mutant combinations including clt2.
Fig. 2.
clt mutants are Cd2+ hypersensitive and glutathione-deficient. (A) WT and cad2 and clt mutants were grown in the presence of 1.8 μM Cd2+ (open bars) and 3.0 μM Cd2+ (filled bars) for 14 d. Shoot FW of pools of 10 plants was measured, n ≥ 4. Error bars represent SEM; *, a significant difference from the WT; P < 0.05 (Student’s t test, n = 10). (B and C) GSH levels in roots (B) and shoots (C) of WT and cad2 and clt mutants. Error bars represent SEM; *, significant differences from the WT, P < 0.05 (Student’s t test, n = 3). (D) Cytosolic GSH levels, detected by conjugation with monochlorobimane (MCB) (green), are decreased in rml1, cad2, and clt1clt2clt3 root cells.
GSH levels in roots of clt1clt3 and clt1clt2clt3, but not the clt1 and clt3 single mutants, were decreased about fourfold compared to the WT (Fig. 2B). In situ labeling of cytosolic GSH in clt1clt2clt3 root cells with monochlorobimane (MCB) (9, 22) (see Materials and Methods) further corroborated these results, suggesting that cytosolic GSH is decreased (Fig. 2D). The combined effect of the clt1 and clt3 mutations suggests CLT1 and CLT3 exhibit some functional redundancy in maintaining the root GSH pool, whereas loss of CLT2 makes a lesser contribution to the mutant phenotype. Mean levels of GSH in shoots of clt1clt3 and clt1clt2clt3 mutants were less than in the WT, but in most lines were not significantly different (Fig. 2C).
CLTs Are Plastid-Localized and Cytosolic GSH Levels Are Decreased in clt Mutants.
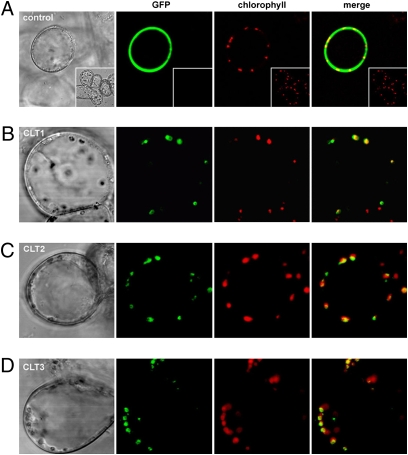
The Arabidopsis Information Resource predicts that each of the CLTs has a plastid target signal peptide, and we confirmed this localization by expressing all three CLTs as GFP fusions (Fig. 3). This localization, along with the decrease in cytosolic GSH observed in root cells using MCB, indicated that GSH partitioning between plastid and cytosol may be influenced by the CLTs. To investigate this we sought to measure differences in the plastid and cytosol GSH pools, particularly in leaves, between the WT and clt triple mutant.
Fig. 3.
CLT proteins localize to plastids. (A) Control cells expressing untargeted GFP (green) show strong fluorescence in the cytosol, which is not colocalized with plastids (red). The inset shows untransformed cells. Transient expression of full length cDNAs containing the upstream target peptide sequence fused to GFP for (B) CLT1, (C) CLT2, and (D) CLT3 show localization patterns that overlap chloroplast autofluorescence, indicating that CLTs are plastid-localized.
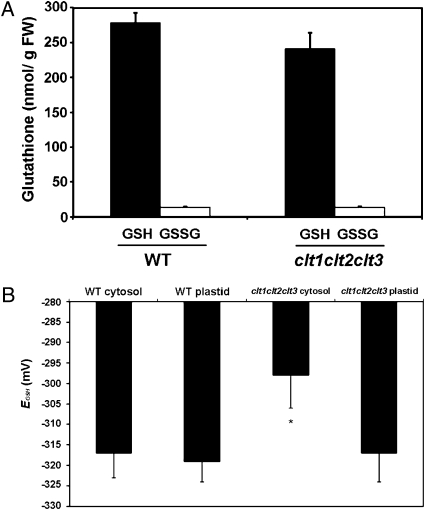
Although MCB preferentially labels GSH, the interpretation of images is complicated by vacuolar sequestration of GSH-bimane conjugates (22, 23). In addition, leaf cells can be difficult to load with the dye because of limited permeability of the leaf cuticle and the need for vacuum infiltration of leaf fragments. To overcome these limitations and to identify changes in the relative levels of cytosolic and chloroplastic GSH, we used the recently-described redox-sensitive GFP (roGFP2), which can be targeted to discrete subcellular compartments to report the local glutathione redox potential, E GSH (9, 24). The redox potential of glutathione is dependent on both the degree of oxidation and the total concentration of glutathione (9, 10). Using this technique, decreases in cellular GSH, caused either genetically in cad2 mutants or chemically with BSO inhibition of GSH1, were measured with accuracy (9). WT and clt1clt2clt3 plants have equivalent GSH/GSSG ratios (Fig. 4A). Thus, assuming unchanged glutathione reductase activity in chloroplasts and cytosol with a very low degree of GSH oxidation (10), it was expected that different roGFP2 fluorescence ratios in plastids and cytosol of clt triple mutants compared to the WT would be indicative of altered glutathione levels.
Fig. 4.
The clt1clt2clt3 mutants have normal GSH:GSSG ratios but roGFP analysis revealed decreased cytosolic levels of GSH. (A) GSH:GSSG ratios were measured in leaf tissue of 6-week-old WT and clt1clt2clt3 plants. (B) The GSH redox potential was measured in WT and clt1clt2clt3 leaf epidermal cells of 6-week-old plants expressing plastid- or cytosol-targeted roGFP2 (see Fig. S4 for roGFP ratiometric images).
Chloroplasts and cytosolic compartments of leaf epidermal cells from WT and clt1clt2clt3 plants expressing either chloroplast- or cytosol-targeted roGFP2 were analyzed (Fig. 4B and Fig. S4). In chloroplasts of the WT and cltl1clt2clt3 triple mutant, the roGFP2 fluorescence ratio was 0.58 ± SD 0.09 and 0.59 ± SD 0.10, respectively, indicating the GFP was almost completely reduced. In contrast, the fluorescence ratio of roGFP2 expressed in the cytosol of the clt1clt2clt3 triple mutant (0.82 ± SD 0.11) was significantly higher than in the WT (0.62 ± SD 0.07), corresponding to a glutathione redox potential in the clt mutant cytosol that is about 20 mV less reducing than in the WT (Fig. 4B). Because the oxidation state of glutathione is unchanged, this finding suggests a lower glutathione level in the cytosol—but not in the plastid—of the mutant under steady-state conditions. These data support the hypothesis that the CLTs influence GSH distribution within the cell from the site of synthesis in the plastid to the cytosol. The absence of a significant difference in total GSH levels in the shoots of the clt1clt2clt3 mutant (Fig. 2C), unlike in the roots, may be a result of differences in the relative contributions of the plastid and cytosolic GSH pools to total GSH in the two tissues.
clt Mutants Have Altered Systemic Acquired Resistance Response and Are Sensitive to Phytophthora Infection.
Cytosolic GSH is thought to be a key component of systemic acquired resistance (SAR) by allowing reduction of the NPR1 protein, thereby permitting its translocation to the nucleus where it activates expression of the PR genes (5, 25). Because the roGFP2 data from leaves revealed decreased cytosolic GSH availability, consistent with the decreased cytosolic thiol staining by MCB in roots of clt1clt2clt3, we hypothesized that this mutant may have an impaired signaling mechanism for SAR and, hence, have a dampened immune response. Leaves of clt1clt2clt3, cad2 and WT plants were treated with the SAR inducer, salicylic acid, and assayed for leaf expression of PR1. After a 24 h induction, PR1 transcript levels were approximately fivefold less in the cad2 mutant than in the WT, and were not detected in clt1clt2clt3 (Table S2 ). This finding confirms that clt1clt2clt3 is unable to properly activate an NPR1-mediated systemic immunity response (25), consistent with a significant decrease in cytosolic GSH levels.
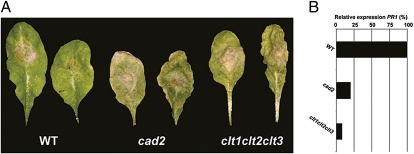
To assess the biological significance of CLTs in facilitating defense signaling, the sensitivity of clt1clt2clt3 and cad2 to infection by Phytophthora brassicae was determined (Fig. 5A). Both clt1clt2clt3 and cad2 were unable to contain the infection, whereas WT plants were resistant. In infected leaves of clt1clt2clt3 and cad2 plants, PR1 expression was ≈10-fold and 5-fold less, respectively, than in the WT (Fig. 5B), consistent with the effect observed after salicylic acid treatment. This extends observations from GSH biosynthetic mutants by demonstrating the importance of cytosolic rather than total GSH levels for proper activation of defense responses, and suggests that GSH is likely to be acting as a signaling component rather than as a ROS scavenger (25, 26).
Fig. 5.
The clt1clt2clt3 mutants are sensitive to infection by Phytophthora. (A) WT, cad2, and clt1clt2clt3 plants were infected with Phytophthora brassicae and leaves were observed for spread of the infection. Even though WT plants were resistant, neither cad2 nor clt1clt2clt3 could halt the spread of infection (n = 5). (B) PR1 expression was measured in leaves by RT-PCR 3 d postinfection and expressed relative to levels in the WT (mean, n = 3).
CLTs Facilitate Thiol Transport into Xenopus Oocytes.
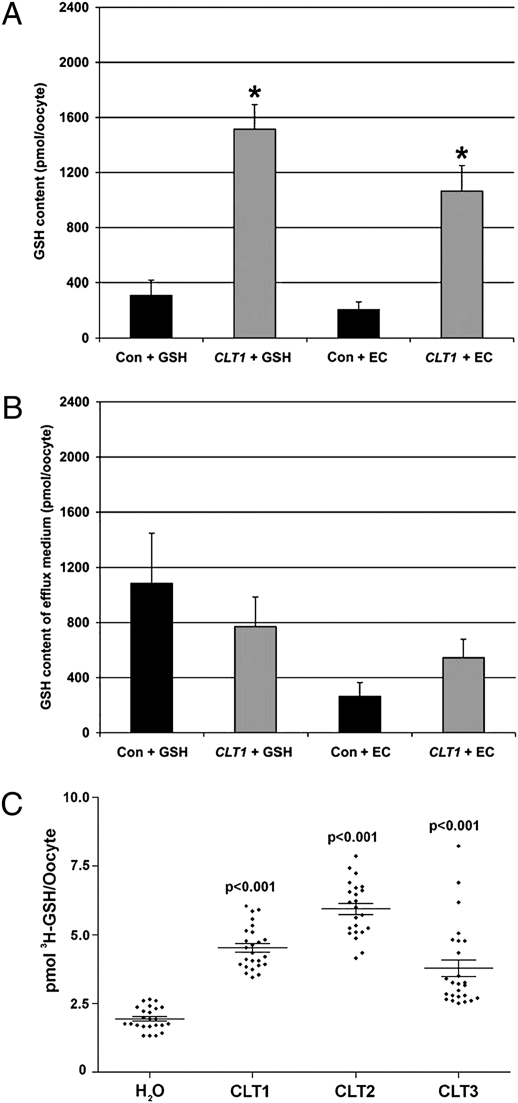
To directly test the function of the CLTs in transporting thiols, we performed two different experiments using Xenopus oocytes expressing different CLTs. In the first experiment, Xenopus oocytes expressing CLT1 and control oocytes were preincubated with GSH or γ-EC (see Materials and Methods). Following subsequent incubation in buffer alone for 16 h, both the oocytes and incubation medium were assayed for the uptake and subsequent efflux, respectively, of thiols (Fig. 6 A and B). These data show that when oocytes expressing CLT1 were exposed to either GSH or γ-EC, a subsequent three- to fourfold increase in intracellular GSH content was observed. However, no change was observed in γ-EC levels in either the oocytes or the efflux medium, and cysteine levels were not changed (Figs. S5 and S6). The increase in intracellular GSH but not γ-EC levels after γ-EC treatment is probably caused by the rapid conversion of γ-EC to GSH during the assay period (Fig. 6A).
Fig. 6.
CLT1 transports thiols in Xenopus oocytes. Oocytes expressing an unrelated nitrate transporter, AtNRT1, as control (Con; black bars) or CLT1 (gray bars) were incubated with either 1-mM GSH (+GSH) or 1-mM γ-EC (+EC) and then in buffer alone (see Materials and Methods). GSH was measured in oocytes (A) and in the efflux buffer (B). Error bars represent SEM; *, significant difference between Con and CLT1, P < 0.05, n ≥ 40 (Student’s t-test). No changes in cysteine or γ-EC levels were observed after exposure to either GSH or γ-EC (Fig. S6). (C) The uptake of [3H]-GSH by embryos expressing CLT1, CLT2, and CLT3, compared with H2O-injected controls, was measured after 40 min incubation (see Materials and Methods). Error bars represent SEM; all CLTs exhibited significant differences from the control, P < 0.001, n ≥ 23 (Student’s t-test).
Although significant accumulation of GSH was observed in oocytes expressing CLT1 after preincubation with thiols, the long time-period of the assay complicated the interpretation of this result. Therefore, Xenopus oocytes expressing either CLT1, CLT2, or CLT3 and control oocytes were incubated with radiolabeled GSH ([3H]-GSH) and assayed for [3H]-GSH uptake after 40 min (see Materials and Methods). These data show that oocytes expressing either CLT1, CLT2, or CLT3 accumulated labeled GSH to levels significantly higher than controls (Fig. 6C). We conclude that expression of CLT proteins allows net transport of GSH into oocytes.
Discussion
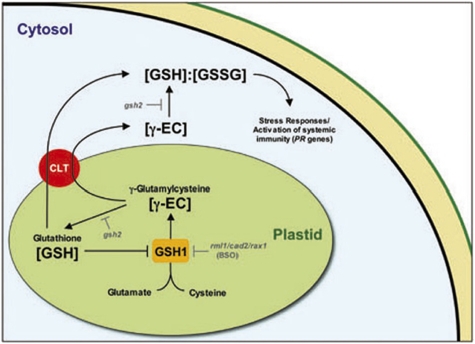
In Arabidopsis, the GSH precursor, γ-EC, is exclusively made in the plastid where GSH biosynthesis is regulated. Recently, the crystal structure of a plant GSH1 has been resolved and a redox-sensitive mechanism was found to regulate enzymatic activity (27, 28). In this way plastid thiol levels directly regulate GSH1. The plastid thiol pool is also influenced by efflux transport, as some γ-EC must be transported to the cytosol where it is used by cytosolic GSH2 (13). GSH synthesized in the plastid may also be directly transported to the cytosol. Our data indicate that the CLT transporters are essential for the transport of thiols from the plastid: clt1clt2clt3 (and clt1clt3) mutants are clearly GSH-deficient in roots and are Cd-sensitive. Only the clt1 single mutant was resistant to BSO and clt1clt3 double mutants show increased BSO resistance. One possibility is that CLT1 and CLT3 transport BSO into the plastid, where it inhibits GSH1, and loss of function of both confers a high level of BSO resistance. In leaves, although total GSH levels are generally not significantly decreased in clt mutants, experiments using redox-sensitive roGFP2 indicate that the glutathione redox potential is decreased in the cytosol, but not the plastids, consistent with a decrease in cytosolic GSH levels. This finding is also consistent with the significant decrease in PR1 induction in leaves and the sensitivity of leaves to pathogen infection. Loss of function of CLT2, although apparently expressed in the same tissues as CLT1 and CLT3 at similar levels, had little effect on the phenotypes tested. Thiol accumulation in Xenopus oocytes indicated transport of either γ-EC (assuming γ-EC is rapidly converted to GSH in the oocyte) or GSH may be facilitated by expression of CLT1, and short-term uptake experiments confirmed that all three CLTs could facilitate uptake of labeled GSH into Xenopus oocytes. Thus, we propose that the CLTs play a significant role in thiol transport from the plastid (Fig. 7).
Fig. 7.
A model for the role of CLTs in GSH homeostasis based on the genetic analysis of the clt mutants and Xenopus transport assays (see text for discussion).
GSH is an important cellular signaling compound (6, 7) and recent evidence suggests that the plastid is a key site of redox signaling reporting on environmental conditions and transducing signals to the nucleus (29). For example, the plastid-localized proteins EXECUTER1 and EXECUTER2 facilitate singlet oxygen signaling from the plastid to the nucleus that regulates stress-responsive gene transcription (2, 30). Similarly, f-type thioredoxins are reversibly glutathionylated within the plastid, a process that is responsive to light and presumed to be a regulator of the Calvin cycle (8). Here we have shown that the movement of plastid thiols by CLTs influences the levels of cytosolic GSH and, hence, the redox potential of the cytosol, which subsequently influences GSH-dependent signaling pathways (Fig. 7). The failure of clt1clt2clt3 to activate defense responses in leaves, despite total GSH levels similar to WT (Fig. 2C), highlights the importance of this aspect of GSH homeostasis and emphasizes the role of the CLTs in connecting the plastid and cytosolic thiol pools. This indicates that the clt mutants, which have affected subcellular GSH levels, will be a useful tool to probe redox-dependent plastid-nucleus signaling mechanisms.
The conservation of CLTs in various genomes suggests an ancient ancestry (Fig. S2). The identification of the malaria parasite PfCRT as a CLT homolog supports this theory, because it contains a relic plastid derived from an early endosymbiotic event with a cyanobacterium (31, 32). Interestingly, both clt mutants and chloroquine-resistant plasmodia carrying PfCRT mutations have altered GSH homeostasis (33). This observation, combined with the shared evolution of these proteins, suggests a level of functional conservation between CLTs and PfCRT. Hence, the identification of CLT function may provide for previously unexplored directions in PfCRT functional analysis.
Materials and Methods
See SI Materials and Methods for biological material, gene expression, and genetic analysis.
Phenotypic Analysis.
L-buthionine-SR-sulfoximine (BSO) and Cd2+ sensitivity was measured by growing plants on agar medium containing added BSO or Cd2+, respectively, and measuring shoot FW after 14 d. Glutathione assays were as described (34), using 6.67% sulfosalicylic acid for acid extraction of thiols in the recycling assay.
Microscopy.
Confocal microscopy was performed on a Zeiss LSM510META microscope. Localization studies used transient expression in Arabidopsis cells and GFP was detected as described previously (9). In situ detection of low molecular weight thiols in WT, rml1, cad2, and clt1clt2clt3 using MCB was performed by incubating roots in 100-μM MCB and 50-μM propidium iodide for 25 min (23, 35). For in situ imaging of E GSH, roGFP2 was expressed separately in the cytosol and chloroplasts, as reported previously (9, 36). Ratiometric imaging was done as described (9).
Uptake/Efflux and Transport Assays.
For the thiol accumulation assays, cDNAs of CLT1, CLT2, and CLT3, without the predicted chloroplast signal-peptide coding regions, and AtNRT1A (an unrelated nitrate transporter protein) were cloned into the pT7TS vector for cRNA synthesis (37). All cRNA was prepared using the mMESSAGEmMACHINE (Ambion) technology. For the uptake/efflux assays, individual Xenopus oocytes were injected with CLT1 or AtNRT1A cRNA. Two days posttransfection, pairs of oocytes were bathed in either 1 mL of saline buffer or buffer containing 1 mM reduced γ-EC or GSH for 4 h. The oocytes were washed five times with 1 mL of saline and left for a further 16 h in 250-μL saline solution. The oocytes and surrounding efflux medium were taken separately and assayed for thiol content using HPLC (34).
For the GSH transport assays, Xenopus oocytes were injected with CLT cRNA (0.5 μg/μl) alongside control oocytes injected with water (38). Three to four days posttransfection, groups of 10 oocytes were incubated in modified Barth’s buffer containing [3H]-GSH (50 nM; 41.5 Ci/mmol). Initially, individual oocytes expressing CLT1 were taken at time intervals (0, 15, 30, and 40 min) and [3H]-GSH uptake measured by scintillation counting to determine a suitable time point for observing transport (39) (Fig. S7). Based on these experiments, oocytes expressing CLTs were assayed after 40 min incubation with [3H]-GSH.
SAR Induction and Pathogen Response.
Salicylic acid induction was performed using concentrations and techniques similar to those described previously (25). Total RNA was extracted from leaf tissue 24 h postinduction and assayed for PR1 expression using real-time RT-PCR (Table S2). Infection with Phytophthora brassicae isolate D (CBS179.89) used 2-mm diameter agar plugs cut out from growing mycelia as described (40). Infected plants were maintained under high humidity to allow for optimal fungal growth. Leaves were harvested 3 d postinfection for RNA extraction.
Supplementary Material
Acknowledgments
We thank Walter Dewitte for assistance with confocal imagery, Susan Howroyd for plant line maintenance, and Peter Crouch for assistance with thiol biochemistry. We also thank Stuart Ralph for help with generating the phylogenetic tree and the protein sequence alignment on which it is based. This work was supported by The Biotechnology and Biological Sciences Research Council (BBSRC) of the United Kingdom through awards BB/C515047/1 (to J.A.H.M and S.C.M), BB/C51508X/1 (to C.F); the University of Melbourne for Melbourne Research Scholarships (to S.C.M and N.C); Bayer CropScience for a collaborative award (to S.C.M); the European Union through Marie Curie Fellowships 509962 (to S.C.M) and 010666 (to J.N), and RTN Grant HPRN-CT-2002-00247 (to A.J. Miller); and the Deutsche Forschungsgemeinschaft through award ME1367/3-2 (to A.J. Meyer). Rothamsted Research is grant-aided by the BBSRC.
Footnotes
The authors declare no conflict of interest.
This article contains supporting information online at www.pnas.org/cgi/content/full/0913689107/DCSupplemental.
References
- 1.May MJ, Vernoux T, Sánchez-Fernández R, Van Montagu M, Inzé D. Evidence for posttranscriptional activation of gamma-glutamylcysteine synthetase during plant stress responses. Proc Natl Acad Sci USA. 1998;95:12049–12054. doi: 10.1073/pnas.95.20.12049. [DOI] [PMC free article] [PubMed] [Google Scholar]
- 2.Wagner D, et al. The genetic basis of singlet oxygen-induced stress responses of Arabidopsis thaliana . Science. 2004;306:1183–1185. doi: 10.1126/science.1103178. [DOI] [PubMed] [Google Scholar]
- 3.Torres MA, Jones JD, Dangl JL. Pathogen-induced, NADPH oxidase-derived reactive oxygen intermediates suppress spread of cell death in Arabidopsis thaliana . Nat Genet. 2005;37:1130–1134. doi: 10.1038/ng1639. [DOI] [PubMed] [Google Scholar]
- 4.Rhee SG. Cell signaling. H2O2, a necessary evil for cell signaling. Science. 2006;312:1882–1883. doi: 10.1126/science.1130481. [DOI] [PubMed] [Google Scholar]
- 5.Ball L, et al. Evidence for a direct link between glutathione biosynthesis and stress defense gene expression in Arabidopsis. Plant Cell. 2004;16:2448–2462. doi: 10.1105/tpc.104.022608. [DOI] [PMC free article] [PubMed] [Google Scholar]
- 6.Buchanan BB, Balmer Y. Redox regulation: a broadening horizon. Annu Rev Plant Biol. 2005;56:187–220. doi: 10.1146/annurev.arplant.56.032604.144246. [DOI] [PubMed] [Google Scholar]
- 7.Foyer CH, Noctor G. Redox homeostasis and antioxidant signaling: a metabolic interface between stress perception and physiological responses. Plant Cell. 2005;17:1866–1875. doi: 10.1105/tpc.105.033589. [DOI] [PMC free article] [PubMed] [Google Scholar]
- 8.Michelet L, et al. Glutathionylation of chloroplast thioredoxin f is a redox signaling mechanism in plants. Proc Natl Acad Sci USA. 2005;102:16478–16483. doi: 10.1073/pnas.0507498102. [DOI] [PMC free article] [PubMed] [Google Scholar]
- 9.Meyer AJ, et al. Redox-sensitive GFP in Arabidopsis thaliana is a quantitative biosensor for the redox potential of the cellular glutathione redox buffer. Plant J. 2007;52:973–986. doi: 10.1111/j.1365-313X.2007.03280.x. [DOI] [PubMed] [Google Scholar]
- 10.Marty L, et al. The NADPH-dependent thioredoxin system constitutes a functional backup for cytosolic glutathione reductase in Arabidopsis. Proc Natl Acad Sci USA. 2009;106:9109–9114. doi: 10.1073/pnas.0900206106. [DOI] [PMC free article] [PubMed] [Google Scholar]
- 11.Meister A. Glutathione biosynthesis and its inhibition. Methods Enzymol. 1995;252:26–30. doi: 10.1016/0076-6879(95)52005-8. [DOI] [PubMed] [Google Scholar]
- 12.Wachter A, Wolf S, Steininger H, Bogs J, Rausch T. Differential targeting of GSH1 and GSH2 is achieved by multiple transcription initiation: implications for the compartmentation of glutathione biosynthesis in the Brassicaceae . Plant J. 2005;41:15–30. doi: 10.1111/j.1365-313X.2004.02269.x. [DOI] [PubMed] [Google Scholar]
- 13.Pasternak M, et al. Restricting glutathione biosynthesis to the cytosol is sufficient for normal plant development. Plant J. 2008;53:999–1012. doi: 10.1111/j.1365-313X.2007.03389.x. [DOI] [PubMed] [Google Scholar]
- 14.Lu YP, Li ZS, Rea PA. AtMRP1 gene of Arabidopsis encodes a glutathione S-conjugate pump: isolation and functional definition of a plant ATP-binding cassette transporter gene. Proc Natl Acad Sci USA. 1997;94:8243–8248. doi: 10.1073/pnas.94.15.8243. [DOI] [PMC free article] [PubMed] [Google Scholar]
- 15.Foyer CH, Theodoulou FL, Delrot S. The functions of inter- and intracellular glutathione transport systems in plants. Trends Plant Sci. 2001;6:486–492. doi: 10.1016/s1360-1385(01)02086-6. [DOI] [PubMed] [Google Scholar]
- 16.Gaedeke N, et al. The Arabidopsis thaliana ABC transporter AtMRP5 controls root development and stomata movement. EMBO J. 2001;20:1875–1887. doi: 10.1093/emboj/20.8.1875. [DOI] [PMC free article] [PubMed] [Google Scholar]
- 17.Liu G, Sánchez-Fernández R, Li ZS, Rea PA. Enhanced multispecificity of Arabidopsis vacuolar multidrug resistance-associated protein-type ATP-binding cassette transporter, AtMRP2. J Biol Chem. 2001;276:8648–8656. doi: 10.1074/jbc.M009690200. [DOI] [PubMed] [Google Scholar]
- 18.Vernoux T, et al. The ROOT MERISTEMLESS1/CADMIUM SENSITIVE2 gene defines a glutathione-dependent pathway involved in initiation and maintenance of cell division during postembryonic root development. Plant Cell. 2000;12:97–110. doi: 10.1105/tpc.12.1.97. [DOI] [PMC free article] [PubMed] [Google Scholar]
- 19.Sidhu AB, Verdier-Pinard D, Fidock DA. Chloroquine resistance in Plasmodium falciparum malaria parasites conferred by pfcrt mutations. Science. 2002;298:210–213. doi: 10.1126/science.1074045. [DOI] [PMC free article] [PubMed] [Google Scholar]
- 20.Martin RE, Kirk K. The malaria parasite’s chloroquine resistance transporter is a member of the drug/metabolite transporter superfamily. Mol Biol Evol. 2004;21:1938–1949. doi: 10.1093/molbev/msh205. [DOI] [PubMed] [Google Scholar]
- 21.Howden R, Andersen CR, Goldsbrough PB, Cobbett CS. A cadmium-sensitive, glutathione-deficient mutant of Arabidopsis thaliana . Plant Physiol. 1995;107:1067–1073. doi: 10.1104/pp.107.4.1067. [DOI] [PMC free article] [PubMed] [Google Scholar]
- 22.Cairns NG, Pasternak M, Wachter A, Cobbett CS, Meyer AJ. Maturation of Arabidopsis seeds is dependent on glutathione biosynthesis within the embryo. Plant Physiol. 2006;141:446–455. doi: 10.1104/pp.106.077982. [DOI] [PMC free article] [PubMed] [Google Scholar]
- 23.Meyer AJ, May MJ, Fricker M. Quantitative in vivo measurement of glutathione in Arabidopsis cells. Plant J. 2001;27:67–78. doi: 10.1046/j.1365-313x.2001.01071.x. [DOI] [PubMed] [Google Scholar]
- 24.Gutscher M, et al. Real-time imaging of the intracellular glutathione redox potential. Nat Methods. 2008;5:553–559. doi: 10.1038/nmeth.1212. [DOI] [PubMed] [Google Scholar]
- 25.Mou Z, Fan W, Dong X. Inducers of plant systemic acquired resistance regulate NPR1 function through redox changes. Cell. 2003;113:935–944. doi: 10.1016/s0092-8674(03)00429-x. [DOI] [PubMed] [Google Scholar]
- 26.Parisy V, et al. Identification of PAD2 as a gamma-glutamylcysteine synthetase highlights the importance of glutathione in disease resistance of Arabidopsis. Plant J. 2007;49:159–172. doi: 10.1111/j.1365-313X.2006.02938.x. [DOI] [PubMed] [Google Scholar]
- 27.Hothorn M, et al. Structural basis for the redox control of plant glutamate cysteine ligase. J Biol Chem. 2006;281:27557–27565. doi: 10.1074/jbc.M602770200. [DOI] [PubMed] [Google Scholar]
- 28.Hicks LM, et al. Thiol-based regulation of redox-active glutamate-cysteine ligase from Arabidopsis thaliana . Plant Cell. 2007;19:2653–2661. doi: 10.1105/tpc.107.052597. [DOI] [PMC free article] [PubMed] [Google Scholar]
- 29.Woodson JD, Chory J. Coordination of gene expression between organellar and nuclear genomes. Nat Rev Genet. 2008;9:383–395. doi: 10.1038/nrg2348. [DOI] [PMC free article] [PubMed] [Google Scholar]
- 30.Lee KP, Kim C, Landgraf F, Apel K. EXECUTER1- and EXECUTER2-dependent transfer of stress-related signals from the plastid to the nucleus of Arabidopsis thaliana . Proc Natl Acad Sci USA. 2007;104:10270–10275. doi: 10.1073/pnas.0702061104. [DOI] [PMC free article] [PubMed] [Google Scholar]
- 31.McFadden GI, Reith ME, Munholland J, Lang-Unnasch N. Plastid in human parasites. Nature. 1996;381:482. doi: 10.1038/381482a0. [DOI] [PubMed] [Google Scholar]
- 32.Ralph SA, et al. Tropical infectious diseases: metabolic maps and functions of the Plasmodium falciparum apicoplast. Nat Rev Microbiol. 2004;2:203–216. doi: 10.1038/nrmicro843. [DOI] [PubMed] [Google Scholar]
- 33.Meierjohann S, Walter RD, Müller S. Regulation of intracellular glutathione levels in erythrocytes infected with chloroquine-sensitive and chloroquine-resistant Plasmodium falciparum . Biochem J. 2002;368:761–768. doi: 10.1042/BJ20020962. [DOI] [PMC free article] [PubMed] [Google Scholar]
- 34.Noctor G, Foyer CH. Simultaneous measurement of foliar glutathione, gamma-glutamylcysteine, and amino acids by high-performance liquid chromatography: comparison with two other assay methods for glutathione. Anal Biochem. 1998;264:98–110. doi: 10.1006/abio.1998.2794. [DOI] [PubMed] [Google Scholar]
- 35.Meyer AJ, Fricker MD. Control of demand-driven biosynthesis of glutathione in green Arabidopsis suspension culture cells. Plant Physiol. 2002;130:1927–1937. doi: 10.1104/pp.008243. [DOI] [PMC free article] [PubMed] [Google Scholar]
- 36.Schwarzländer M, et al. Confocal imaging of glutathione redox potential in living plant cells. J Microsc. 2008;231:299–316. doi: 10.1111/j.1365-2818.2008.02030.x. [DOI] [PubMed] [Google Scholar]
- 37.Tong Y, Zhou JJ, Li Z, Miller AJ. A two-component high-affinity nitrate uptake system in barley. Plant J. 2005;41:442–450. doi: 10.1111/j.1365-313X.2004.02310.x. [DOI] [PubMed] [Google Scholar]
- 38.Goldin AL. Maintenance of Xenopus laevis and oocyte injection. Methods Enzymol. 1992;207:266–279. doi: 10.1016/0076-6879(92)07017-i. [DOI] [PubMed] [Google Scholar]
- 39.Woodrow CJ, Burchmore RJ, Krishna S. Hexose permeation pathways in Plasmodium falciparum-infected erythrocytes. Proc Natl Acad Sci USA. 2000;97:9931–9936. doi: 10.1073/pnas.170153097. [DOI] [PMC free article] [PubMed] [Google Scholar]
- 40.Roetschi A, Si-Ammour A, Belbahri L, Mauch F, Mauch-Mani B. Characterization of an Arabidopsis-Phytophthora pathosystem: resistance requires a functional PAD2 gene and is independent of salicylic acid, ethylene and jasmonic acid signalling. Plant J. 2001;28:293–305. doi: 10.1046/j.1365-313x.2001.01148.x. [DOI] [PubMed] [Google Scholar]
Associated Data
This section collects any data citations, data availability statements, or supplementary materials included in this article.


