

Abstract
Physical interactions between distinct chromosomal genomic loci are important for genomic functions including recombination and gene expression, but the mechanisms by which these interactions occur remain obscure. Using telomeric association as a model system, we analyzed here the in vivo organization of chromosome ends of haploid yeast cells during interphase. We separately labeled most of the 32 subtelomeres and analyzed their positions both in nuclear space and relative to three representative reference subtelomeres by high-throughput 3D microscopy and image processing. We show that subtelomeres are positioned nonrandomly at the nuclear periphery, depending on the genomic size of their chromosome arm, centromere attachment to the microtubule organizing center (spindle pole body, SPB), and the volume of the nucleolus. The distance of subtelomeres to the SPB increases consistently with chromosome arm length up to ≈300 kb; for larger arms the influence of chromosome arm length is weaker, but the effect of the nucleolar volume is stronger. Distances between pairs of subtelomeres also exhibit arm-length dependence and suggest, together with dynamic tracking experiments, that potential associations between subtelomeres are unexpectedly infrequent and transient. Our results suggest that interactions between subtelomeres are nonspecific and instead governed by physical constraints, including chromosome structure, attachment to the SPB, and nuclear crowding.
Keywords: genome organization, telomeric foci, image analysis
The 3D organization of genes and chromosomes in nuclear space plays an important role in genome replication, repair, and regulation of gene expression (1 –3). Chromosomes can fold, form territories and loops, and interact with nuclear landmarks such as nuclear pores, the lamina, or nucleoli. Loci at large genomic distances along the same chromosome or on different chromosomes can come into contact or spatial proximity (4). The nature and extent of intrachromosomal and interchromosomal associations remain to be deciphered in detail. Chromosome configuration capture technologies allow mapping of interaction frequencies in cross-linked cells (5, 6), whereas light microscopy can be used to determine 3D distances and study the dynamics of these interactions in individual living cells (7).
In some species, telomeres, the ends of chromosomes, are believed to form clusters or foci and provide a model for trans-associations of distant loci with potentially high functional importance. In the malaria agent Plasmodium falciparum, telomeric foci could favor DNA recombination between variable subtelomeric alleles and enhance the parasite’s ability to escape the immune response (8). In the budding yeast Saccharomyces cerevisiae, evidence for clustering of the 32 telomeres in haploid cells comes from the observation of a smaller number of foci, identified using either a probe against subtelomeric Y’ sequences or the fluorescently tagged protein Rap1, which binds to the repeated (TG1-3) telomeric sequences (9 –11). Spatial clustering of chromosome ends is intimately linked to their anchoring to the nuclear envelope (12 –14). In this yeast, telomeric foci are proposed to promote transcriptional silencing by increasing the local concentration of silencing proteins such as the Rap1p binding partners Sir3p and Sir4p, as described for specific subtelomeres (15).
Little is known about the chromosomal interactions thought to underlie telomeric foci in budding yeast. In vitro, Rap1p can favor interactions between distant regions and form DNA loops (16). Rap1p can also promote interactions between the single-strand telomeric extension and the double-stranded TG1-3 telomeric repeats (17). Likewise, short hypoacetylated chromatin fibers (208 bp) containing high concentrations of Sir3p are able to form intrafiber connections, as well as some local interfiber connections in vitro (18). However, there is no evidence that similar interactions occur in vivo, where analyses are hampered by the high genomic redundancy of subtelomeres (19). Recently, Rap1p-GFP and Sir3p-GFP signals were observed to split and fuse within 1–5 min, suggesting that protein–protein associations are transient (20). Persistent associations of telomeres with Rap1p during 3–8 min were reported, despite the mobility of telomere Tel6R at the nuclear periphery during the entire cell cycle (20, 21).
The telomeric composition of S. cerevisiae foci and the principles underlying it remain unknown. Specific interactions based on sequence homology (counting Y’ sequences) were excluded (20). Instead, preferential associations were observed between the subtelomeres on the opposite ends of the same chromosome, for two short chromosomes of equal arm lengths (<150 kb) (22). The role of arm length similarity in subtelomere proximity was confirmed by chromosome arm exchange experiments (20, 22). It was suggested that a subtelomeric sequence recognized by an unidentified factor favored interactions between subtelomeres of chromosome 6 (20). It remains unclear how these findings extend to other chromosomes.
Here we analyze the 3D distances between 63 pairs of subtelomeres in populations of thousands of living yeast cells. We find that genomic chromosomal arm length is a major determinant of spatial distances and proximity of subtelomeres. The smallest distances are found between subtelomeres on chromosome arms of similar size, up to ≈300 kb. Our data indicate that the number of subtelomeres within foci is very low and that possible interactions are very transient (<30 s). Finally, we demonstrate that physical constraints, including centromere anchoring and the nucleolar mass, influence intranuclear positions of and associations between subtelomeres.
Results
To characterize associations and relative positions of S. cerevisiae subtelomeres in vivo, we systematically analyzed distances between pairs of differently labeled subtelomeres observed with 3D light microscopy. Twenty-nine of 32 subtelomeres (i.e., 90%) were labeled in green using 256 lacO repeats bound by lacI-GFP (23) (Tables S1 and S2). Three reference subtelomeres were labeled in red with 112 tetO repeats bound by tetR-mRFP (24). These were chosen on chromosome arms of representative sizes, considering that S. cerevisiae chromosome arms range from 80 kb to 1,050 kb: Tel6R (122 kb; short), Tel10R (310 kb; medium), and Tel4R (1,050 kb; long). Each reference strain was then mated with the collection of green-labeled subtelomeres and sporulated, resulting in 63 haploid strains carrying two differentially labeled subtelomeres. After 3D imaging by confocal spinning disk microscopy, we computed the 3D distances between pairs of loci in n > 500 cells for each strain, using specifically designed software (Materials and Methods).
Chromosome Arm Length Determines Distances Between Subtelomeres.
We first analyzed the median distance of each reference subtelomere to the other subtelomeres as a function of its chromosome arm length (Fig. 1). Our data reveal a very clear and consistent dependence of the median distance with chromosome arm length: for both Tel6R and Tel10R (short and medium arms), the median distance to other subtelomeres increases with the length of their chromosome arm from 0.9 μm to 1.3 μm, whereas for Tel4R (long arm), this trend is reversed. We fitted these relationships using linear regression and performed change points analyses to detect points where the slope of regression changes (Materials and Methods), ignoring only subtelomeric pairs from the same chromosome. For both Tel6R and Tel4R, a change point was detected for arms near 310 kb [95% confidence intervals (CI), 266–326 kb and 266–394 kb, respectively]. In contrast, no change point was detected for the medium-arm subtelomere Tel10R. For this subtelomere, median distances increase regularly with and are well predicted by chromosome arm length, with a slope of 0.4 nm/kb and a high regression coefficient, R 2 = 0.78. For Tel6R, R 2 = 0.91 and a slope of 0.9 nm/kb for arms <310 kb indicates that, up to this size, median distances are very accurately predicted by and rapidly increase with chromosome arm length (Fig. 1A). At the opposite, for Tel4R, median distances <310 kb decrease with a negative slope of −0.4 nm/kb, but the correlation is much weaker (R 2 = 0.25). Both for Tel6R and Tel4R, median distances increase only slightly for chromosome arms beyond 310 kb (slope 0.2 nm/kb), with medium and poor correlation, respectively (R 2 = 0.55 and R 2 = 0.25).
Fig. 1.

Chromosome arm length influences median and small subtelomere–subtelomere distances. Each dot represents the median distance (MD) between a reference (ref.) subtelomere (indicated at top right of each panel) and another subtelomere, labeled according to its chromosome arm. Each cross represents the frequency for distances below 250 nm. Arm lengths are indicated on the x axis. Orange indicates subtelomeres on the same chromosome. Vertical dashed lines represent the change point, shaded area indicates the 95% confidence interval, pink and red for median and short distances, respectively. No change point was detected for Tel10R. Regression relationships for MD, indicated by solid lines, are as follows, where L is the arm length in kilobases: MDTel6R = 0.83 + 9.3 10−4 × L μm, for L ≤ 310 kb, R 2 = 0.91 and MDTel6R = 1.1 + 1.8 10−4 × L μm, for L > 310 kb, R 2 = 0.55; MDTel10R = 0.99 + 3.9 10−4 × L μm, R 2 = 0.78 and MDTel4R = 1.29–4.3 10−4 × L μm, for L ≤ 326 kb, R 2 = 0.25 and MDTel4R = 0.97 + 2.0 10−4 × L μm, for L > 326 kb, R 2 = 0.25. Horizontal dashed lines represent the theoretical frequencies for subtelomeres with equi-probable associations for 16 (bottom line) or 8 (upper line) foci.
For Tel6R and Tel10R, the smallest computed median distance corresponded to the subtelomere on the other end of the same chromosome and was significantly smaller than the distance to subtelomeres on other chromosomes of similar arm lengths (Tel6R: 0.6μm, SD = 0.35 μm; Tel10R: 0.9 μm, SD = 0.45 μm) (orange dots, Fig. 1 A and B). Our data agree with previous reports on Tel6R and Tel6L (20, 22). In contrast, for Tel4R the median distance to Tel4L was similar to the distance with subtelomeres on other chromosome arms of similar lengths (Fig. 1C).
Small Distances Between Pairs of Subtelomeres Are Infrequent in Vivo.
The median distances reported above range from 0.9 μm to 1.3 μm. Such distances clearly exclude systematic physical interactions between subtelomeres. However, because median distances may not reflect transient interactions between subtelomere pairs in telomeric foci, we analyzed the frequency of small distances consistent with such interactions.
Locus positions computed from the images naturally suffer from random measurement errors, due to image noise and motion, leading to an overestimation of most distances and blurring of distance distributions. To quantify this, we used cells in which an array of tet operators is bound by both tetR-GFP and tetR-mRFP and computed the distance between the green and red fluorescence spots. The median and 95% percentile distances were 70 nm and ≈250 nm, respectively, confirming the method’s ability to detect distances between differently labeled loci below the optical resolution (Fig. S1). We examined the frequency of cells in which measured 3D distances were <250 nm (Fig. 1). These frequencies ranged from 0.3% to 4%, except for the pair Tel6R-Tel6L (9.4%), with median values of 1–1.5%. The frequencies also correlated with chromosome arm length, with trends reversed from the median distances (Fig. 1). If subtelomeres were always physically associated to the same subtelomere, the frequencies should be ≈95% for at least some of the pairs (although data on 7–13 of the 31 subtelomere pairs were lacking for each reference subtelomere, the probability that stably associated pair were missed is <3% if foci contain four or more subtelomeres). Therefore, constant association of subtelomeres in four to eight foci can be ruled out. If subtelomeres were randomly associated to other subtelomeres, within 16, 8, or 4 foci, constant frequencies of association to the reference subtelomere at 3.2%, 9.7%, or 22.6% (1 of 31, 3 of 31, or 7 of 31) are expected, respectively (Fig. 1). Thus, our data are also incompatible with completely random associations. Furthermore, the rather low frequency of small distances suggests that subtelomeres are mostly found in isolation and not in foci composed of multiple subtelomeres in physical contact. This stands in contrast to what was reported on the basis of detection of Y’ probes by in situ hybridization in fixed cells (9, 13). To determine whether fixation artifacts can explain this discrepancy, we measured distances between the pair Tel6R-Tel4R on cells treated with standard fixation conditions. Our data indicate that median 3D distances were reduced by 30% compared with the living cells, whereas probabilities for distances <250 nm increased by 45% (Fig. 2). We conclude that fixation, by diminishing spatial distances, might lead to an overestimation of the number of subtelomeres per focus and suggest that in living cells, potential contacts between subtelomeres are more loose and/or transient.
Fig. 2.

Fixation reduces distances between subtelomeres. Box plots for 3D distances between Tel6R andTel4R (short–long arm), labeled in green and red, respectively. Two independent experiments both in living cells (Left) and fixed cells (Right) are shown. The median is represented by a dark line, the box represents the interquartile range, and whiskers the data range (except for outliers, shown as open circles). N, number of cells analyzed.
Subtelomere Associations Are Rapid and Infrequent.
To test this, we monitored the dynamics of individual subtelomeres by real-time imaging. We tracked subtelomere pairs in 3D movies in ≈400 to ≈1,000 nuclei over 5.4 min (8.1-s intervals between consecutive 3D stacks; Materials and Methods). We chose four pairs according to arm length: Tel6R-Tel3L (short–short), Tel4R-Tel15R and Tel4R-Tel13R (long–long), and Tel6R-Tel4R (short–long). To find potential interactions, we defined a run as a set of consecutive frames during which the pairwise distance was consistently <600 nm. This large value was chosen conservatively so as not to miss any possible interactions and on the basis of estimated size of Rap1p foci (SI Materials and Methods). We defined a “stable association” as a run persisting >60 s and a “frequent association” as a high number (>10) of shorter runs (Table 1 and Fig. S2). As a positive control, we used a strain carrying the tetO and lacO arrays located 15.7 kb apart. On this strain, we found stable (maximum run length: mean=196.8 s, SD = 88.7s) and frequent associations (35.5 runs, SD = 5.2), confirming the ability of our method to detect potential stable interactions between pairs of loci. As a negative control, we used the pair Tel16R-URA3. Because URA3 is located at the nuclear center (25), these two loci are unlikely to frequently associate. Consistently, we found only a small number (5.3, SD = 7.5) of rather short runs (18.6 s, SD = 28). All of the subtelomeres pairs monitored behave close to the negative control (3.3–8.7 runs, 12.4–31.5 s), although potential interactions were slightly more frequent and stable for subtelomeres on arms of similar lengths, especially if short (short–short or long–long; Table 1). Thus, these subtelomeres cannot interact often, and interactions, if any, occur for short periods of time.
Table 1.
Dynamic analyses of pair-wise subtelomere distances
| Parameter | 6R-2loci | 16R-URA3 | 6R-3L (S–S) | 4R-13R (L–L) | 4R-15R (L–L) | 6R-4R (S–L) |
| Total run length | ||||||
| Frames | ||||||
| Mean | 35.5 | 5.3 | 8.7 | 7.3 | 7.9 | 3.3 |
| SD | 5.2 | 7.5 | 9.9 | 9.1 | 9.6 | 6.1 |
| Seconds | ||||||
| Mean | 287.7 | 42.8 | 70.3 | 59.3 | 63.7 | 26.4 |
| SD | 42.3 | 60.4 | 80.2 | 73.9 | 77.7 | 49.8 |
| Maximum run length | ||||||
| Frames | ||||||
| Mean | 24.3 | 2.3 | 3.9 | 2.9 | 3.7 | 1.5 |
| SD | 10.9 | 3.5 | 5.2 | 3.9 | 5.1 | 2.9 |
| Seconds | ||||||
| Mean | 196.8 | 18.6 | 31.5 | 23.8 | 29.6 | 12.4 |
| SD | 88.7 | 28 | 42.3 | 31.4 | 41.5 | 23.7 |
Cells were visualized for 5.4 min in the two channels (100-ms illumination per frame, 40 consecutive stacks). Arrays of lac and tet operators were inserted 15.7 kb apart (6R-2loci), between a subtelomere and a central region (16R-URA3) or between two subtelomeres from short (S) or long (L) chromosome arms. 4R, 15R contain Y’ sequences. A run is defined as a set of consecutive frames for which the distance between two labeled loci is <600 nm. The number of runs during the duration of the experiment indicates the frequency of a possible interaction, whereas stability is indicated by the maximum run length.
Subtelomere Focus Composition from Statistical Clustering.
What is the number and identity of telomeres in foci resulting from potential transient interactions? Differential labeling of all telomeres could in principle provide direct answers, but is technically unfeasible. Instead, we attempt to determine the composition of foci containing one of the reference subtelomeres (hereafter called “reference focus”) by assuming that distances between different pairs measured in distinct cells are statistically independent. For each pair of labeled subtelomeres, one random sample was taken from the corresponding ≈500 measured distances and assigned to a virtual nucleus, and this procedure was repeated 100,000 times (SI Materials and Methods; Fig. S3). If one or more subtelomeres belong to a reference focus, the distances between these subtelomeres and the reference one should be small (≤600 nm; see above) and more similar to one another than to distances between the reference subtelomere and other subtelomeres. We used statistical cluster analysis to define clusters of subtelomere pairs of similar distances (separately for each of the three reference subtelomeres and in each virtual nucleus) and computed the probability that a given labeled subtelomere belongs to a reference focus, independently or concomitantly with other subtelomeres (SI Materials and Methods and Table S3). We find that probabilities for a given subtelomere to be inside one of the three reference foci range from 1% to 15%, and that these probabilities increase with arm length for Tel6R (short) and Tel10R (medium) but decrease for Tel4R (long). This arm length dependence cannot result from the randomization procedure and indicates that subtelomeres with similar arm lengths are more likely to share a focus than subtelomeres on arms of different sizes. Thus the composition of potential foci is not entirely random. The estimated average number of subtelomeres in reference foci was ≈3.2–3.6 (3.6 ± 1.7, 3.2 ± 2.55, and 3.5 ± 1.55 for Tel6R, Tel10R, and Tel4R, respectively). These values are smaller than estimated previously, based alone on the number of observed foci (for 4-8 foci, this average should be 4-8 (32/8, 32/4) if all subtelomeres are inside a focus) (9) and further suggest that interactions between subtelomeres are rare.
Arm Length Influences Intranuclear Subtelomere Positions.
We next asked whether the observed differences in relative subtelomere positions are related to nonrandom positioning of chromosome ends in nuclear space. For this purpose, we analyzed 11 subtelomeres using a computational method that maps the position of individual loci in thousands of nuclei oriented according to the position of the nucleolus (25). All 11 subtelomeres concentrated into probabilities territories (25), much smaller than the nucleus (Fig. 3A). These territories were located near the nuclear edge, as expected (14, 22, 26), but exhibited different distributions of the angle α with the axis joining the nuclear center and the nucleolar centroid (Fig. 3A). The median α increased linearly with chromosome arm length up to ≈300 kb (from 47.8° to 72.1°; Fig. 3B). Thus subtelomeres on shorter chromosome arms are closer to the expected position of the spindle pole body (SPB) opposite the nucleolus (25), whereas subtelomeres on longer arms move closer to the nucleolus (Fig. 3C). Beyond a change point located between 157 kb and 310 kb (95% CI), the median α no longer depends on arm length and remains approximately constant, at ≈70°. Thus the position of subtelomeres at the nuclear edge is not random and extends further from the SPB as arm size increases for short to middle chromosome arms.
Fig. 3.

Arm length influences localization of subtelomeres at the nuclear periphery. (A) 2D localization probability maps for different subtelomeres. Top and bottom halves are mirrored (around the green dashed line) for visual convenience. Yellow circle and red dotted outline represent a “median” nuclear envelope and nucleolus, respectively. The probability to find the locus inside different regions of the nucleus is indicated by the percentage of the enclosing contour. Hot colors indicate higher probability densities. Chromosome arm sizes are indicated on the right (kb). N, number of cells analyzed. (B) Median polar angle vs. chromosome arm length, annotated with the subtelomere label. Dashed vertical line represents the change point value, gray area represents its 95% CI. Linear regression relationships are Y (°) = 46.3 + 6.1 10−2 × L (kb), for arm length L ≤ 430 kb and Y (°) = 85.5–1.9 10−2 × L (kb), for L > 430 kb. (C) Median subtelomere–SPB distances calculated as dist(Tel, SPB) = sqrt(R_Tel2 + R_SPB2 + 2 R_Tel R_Tel cos α), where R_Tel is the distance of subtelomere to the nuclear center, R_SPB is the distance of SPB from the nuclear center = 900 nm, and α is the angle with the horizontal axis. Dashed vertical and gray areas are defined as in B.
Delocalization of Centromeres and Nucleolar Size Affect Distances Between Subtelomeres.
What causes the observed dependence of intranuclear subtelomere positions on chromosome arm length? A plausible explanation is that chromosomes are attached to the SPB at their centromeres via microtubules (27). We perturbed this attachment by depolymerization of microtubules through addition of nocodazole (Materials and Methods). The efficiency of the drug was tested by monitoring the microtubule protein α-tubulin Tub1p (28). We found that the position of a tetO centromere was displaced from a median α = 42.6° (SD = 1.9°) to α = 52.6°, (SD = 3.9°; Fig. S4). In presence of the drug, the subtelomere of a 85-kb arm subtelomere (Tel9R) was less peripheral (median radial distance R = 0.88 μm, vs. R = 0.94 μm in control; Wilcoxon test, P < 10−16) and gene territories differ (2D χ2 test, P < 10−16) (25). In contrast, radial distances for subtelomeres of a 310-kb arm (Tel10R) and a 1,050-kb arm (Tel4R) were unchanged (for Tel10R, R = 0.97 μm; R control = 0.96 μm, P = 0.056 and for Tel4R, R = 0.90 μm; R control = 0.92 μm, P = 0.23) and gene territories differ moderately (2D χ2 test, P = 0.009 and P = 1.5 10−7 for Tel10R and Tel4R, respectively; Fig. 4A). Nocodazole significantly increased median distances for Tel6R-Tel3L (short–short) from 0.9 μm to 1.1 μm (Wilcoxon test, P < 10−5) but not for Tel6R-Tel4R (short–long; 1.22 μm to 1.24 μm, P = 0.074) (Fig. 4B).
Fig. 4.

SPB–centromere link influences subtelomere–subtelomere distances, whereas nucleolar volume limits subtelomere positioning and increases subtelomere–subtelomere distances. (A) Localization probability maps for subtelomeres from a short arm (Tel9R), a middle arm (Tel10R), and a long arm (Tel4R). The size in kilobases of the respective arms is indicated between brackets. Maps are displayed as in Fig. 3. (B) Box plots (as in Fig. 2) for pairwise distances in the absence or presence of nocodazole (+noco) for subtelomere pairs Tel6R-Tel3L (short–short) and Tel6R-Tel4R (short–long). (C) Probability maps for subtelomeres of short arms (left) or long arms (right). Cells were either grown without rapamycin (control) or in the presence of rapamycin (+rapa) for 20 min. The size of the nucleolus is reduced in the presence of rapamycin (quantified in Table S4). (D) Median polar angle vs. chromosome arm length, as in Fig. 3. Median polar angles in the absence (red triangles) or presence (black circles) of rapamycin plotted as a function of chromosome arm size. A change point of similar value and CI is found in both conditions. (E) Box plots for pairwise distances in the absence or presence of rapamycin (+rapa) for subtelomere pairs Tel6R-Tel3L (short–short) and Tel6R-Tel4R (short–long).
We likewise hypothesized that arms longer than ≈300 kb are prevented from extending further away from the SPB by the dense mass of the nucleolus. To test this, we exposed cells to rapamycin, an inhibitor of polII-dependendent ribosomal gene transcription (29). In the presence of rapamycin, the nuclear volume remained unchanged, but the nucleolar volume was reproducibly halved (Table S4). Subtelomeres again remained peripheral (Fig. 4C), but the median α increased by 12–15% for medium and long arms (Tel10R, Tel11L, Tel13R, and Tel4R) and by 6–10% for short arms (Tel9R and Tel6R; Fig. 4D). Consistently, median distances between Tel6R and Tel3L and between Tel6R and Tel4R increased significantly, from 0.9 μm to 1.1 μm and from 1.3 μm to 1.4 μm, respectively (Wilcoxon test, P < 10−5 for both; Fig. 4E).
Discussion
We have analyzed the intranuclear positions of 11 subtelomeres and the distributions of distances between 63 pairs of subtelomeres in ≈60,000 living yeast cells both in normal conditions and in experiments in which nuclear constraints were altered. Our results have strong implications for the nuclear organization of chromosomes and telomeric foci.
Nuclear Organization of Chromosomes.
The principles that govern chromosome organization in interphase are largely unknown. In S. cerevisiae, centromeres form ring-like clusters close to the SPB (27), and several subtelomeres are positioned close to the periphery (26) via nuclear envelope factors including nuclear pore components (12, 14, 30). Here, by determining the positions of 11 subtelomeres, including 6 new ones, we establish that localization of chromosome ends close to the nuclear envelope is a general rule in budding yeast. Importantly, our work adds a dimension to subtelomere positioning by defining an orientation for each nucleus, allowing us to map their locations both in radius and angle from the SPB–nucleolar axis. We found that the length of chromosome arms strongly determines the angular distributions of subtelomeres (Fig. 5).
Fig. 5.
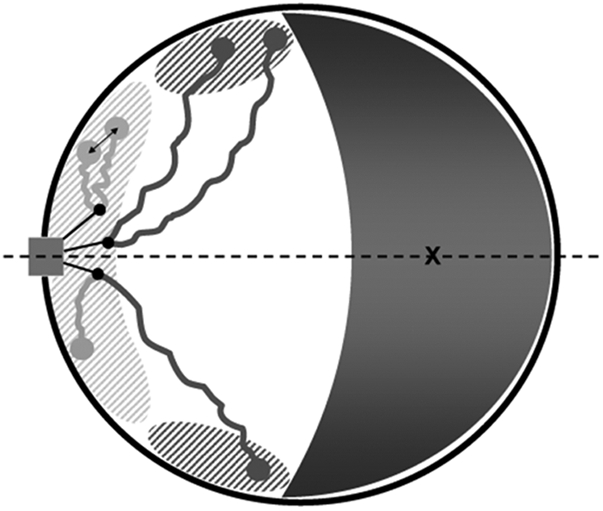
Chromosome organization model in the yeast nucleus. The SPB (rectangle), embedded in the double nuclear envelope (circle), forms a central axis (dotted line) with the centroid (cross) of the nucleolus (gray crescent). Nuclear microtubules (three are shown for simplicity) emanate from the SPB and bind to the centromeric kinetochores (black dots). The length of chromosome arms determines the angular distribution of subtelomeres, with those of smaller arms (<≈300 kb) (light gray) mostly restricted to the vicinity of the SPB (shaded light gray), whereas subtelomeres of longer arms (dark gray) are mostly excluded from this region, extend further away, and are closer to the nucleolus (shaded dark gray).
The consistent increase in subtelomere angle with arm lengths up to ≈300 kb strongly indicates that the compaction and flexibility of the chromatin prevent short chromosome arms from exploring the entire nucleoplasm and instead confine them to a territory close to the SPB. Although the compaction and flexibility of interphase chromosomes are not known with certainty, previously reported values are consistent with this notion [e.g., with a compaction of ≈100 bp/nm and a persistence length of ≈200 nm (31), or with more recent estimates of 18–36 bp/nm and 66–134 nm (32), the mean end-to-end distance of a 300-kb chromosome arm as predicted by a worm-like chain model is between ≈750 and 1,500 nm, i.e., smaller than the nuclear diameter]. This also agrees with our observation that the distance of gene territories to the SPB increases with genomic distance from the centromere (25). Consistent with an influence of the SPB–centromere link on chromosome end positioning, interference with microtubules by nocodazole reduced the peripheral confinement of a short arm subtelomere. Despite this delocalization, subtelomeres still remained confined to a small region of the nucleoplasm, presumably because the ≈15-min nocodazole treatment was insufficient to entirely disrupt the microtubule link.
Increases in arm length beyond 300 kb did not noticeably affect positioning of subtelomeres, which remained excluded from the nucleolar volume, suggesting that the dense nucleolus provides a physical barrier to these chromosomes. We anticipated and verified that reducing the nucleolar volume by rapamycin allowed subtelomeres on long arms to extend further away from the SPB. The stronger effect of nucleolus size on long arm subtelomeres is expected if these arms are more frequently in contact with the nucleolus, whereas the smaller but noticeable effect on smaller chromosome arm subtelomeres could arise from nuclear crowding; compression of the genomic mass by the nucleolar volume is only partially transmitted to the shorter arms, not directly in contact with it, via the longer arms located in between.
Organization of Subtelomeric Foci.
The principles of chromosome organization we have defined here have important consequences on the understanding of subtelomeric foci composition and formation. Observation of telomere-bound protein Rap1p (9, 20) led to the current view that the 32 telomeres of haploid yeast cells are contained in 4-8 Rap1 foci. Here, we show by analyzing 3D distances for 63 pairs of subtelomeres at small distances, below the diffraction limit, that the physical constraints described above largely determine the proximities of subtelomeres. Importantly, the observation that relative positions of subtelomeres are strongly determined by arm length eliminates a completely random equi-probable association of subtelomeres, and our data also rule out deterministic foci composition.
What do we learn about interactions between chromosome ends inside a focus? The low frequency of small distances (from 0.3% to 4%) and our statistical clustering analysis indicated that subtelomeric foci contain fewer subtelomeres than inferred from earlier studies of Rap1 (9). Furthermore, our dynamic data show only very transient (<30 s) potential associations between subtelomeres, indicating that physical interactions inside a focus are rare. This observation is compatible with a model whereby silencing proteins from a given subtelomere nucleate and attract other silencing proteins, as shown in vitro (33, 34). Distances between subtelomeres in living cells are actually larger than those observed in fixed cells, suggesting that fixation conditions enhance protein–protein interactions.
Why does Rap1 staining give rise to four to eight foci, when in fact subtelomeres are mostly not clustered? The limited resolution and signal-to-noise ratio of Rap1 images is one possible explanation, because subtelomeres several hundreds of nanometers apart may appear to be in the same fluorescent spot, whereas individual subtelomeres may have insufficient Rap1 signal to be detected. It is also possible that some Rap1p foci are devoid of telomeres, as suggested previously (10). Alternatively, we cannot exclude that the tattoos inserted between 1.1 kb and 22.2 kb from telomeres do not accurately indicate the position of the very tip of chromosomes, where Rap1 is localized. The experimental system, based on bacterial arrays, might also modify local chromatin structure, although these insertions do not abolish subtelomeric silencing and colocalization with Rap1-GFP foci or Y’ FISH (13, 20, 35). Importantly, our observations are not incompatible with the previously described constrained movement of a subtelomere at the nuclear envelope (21). They furthermore imply that more stable associations are not favored, perhaps because they would hamper harmonious cell division.
Functional and Evolutionary Considerations.
The genomic organization described here confirms earlier observations on recombination frequencies. Cre/loxP site-specific recombination was used to characterize the probabilities of interactions between pairs of genomic loci (36). Recombination rates between loxP sites were observed to decrease with increasing difference between their genomic distance to the centromere, up to 170 kb, the largest genomic distance tested. Our data are in accordance with these observations, because subtelomeres tend to be closer when their arms have comparable lengths, thereby likely increasing their interaction frequencies. Our data allow predictions of recombination rates for loci at larger genomic distances; for instance, recombination rates between sites at equal distances from the centromere are predicted to be roughly constant beyond 300 kb.
The evolutionary advantages given by the chromosome organization described here remain to be understood. We speculate that a driving selection existed for organizing principles, like nuclear anchoring systems. Recent work on human chromosome organization suggests that associations with the nuclear periphery are not entirely random (37). Constraints similar to the ones observed in this work are, therefore, likely to be universal.
Materials and Methods
Growth, Live Imaging, and Image Analysis.
Live growth conditions and imaging were performed as described previously (14, 25) and as detailed in SI Materials and Methods. Images were analyzed by the nucloc software (25), modified to display probability maps as percentiles using a kernel density estimate (38), and extended to allow detection and tracking of pairs of differentially labeled loci. 3D distances were computed after correction for chromatic aberrations (see SI Materials and Methods).
Change Point Analyses.
This statistical analysis method allowed searching for transitions in the regression analyses (39). The optimal number of change points is determined according to the derivatives of the Bayesian information criterion, and a regression relationship is fitted in each of the segments induced by the change points.
Hierarchical Clustering.
The probabilistic composition of a focus, the average radius, and number of subtelomeres in a focus were established using hierarchical clustering (39, 40), detailed in SI Materials and Methods.
Supplementary Material
Acknowledgments
We thank C. Machu and the Dynamic Imaging Platform of the Pasteur Institute for help with confocal microscopy; A. Berger and F. Feuerbach, for sharing strains or plasmids; R. Koszul, G. Fischer, G.-F. Richard, F. Feuerbach, and F. d’Alché-Buc for their critical reading; and H. Wong for discussions. P.T. was the recipient of predoctoral fellowships of the Ministère de la Recherche et Technologie and Association pour la Recherche sur le Cancer; B.D. is a member of the Institut Universitaire de France. The work benefited from Institut Pasteur’s Projet Transversal de Recherche Grant 218.
Footnotes
The authors declare no conflict of interest.
This article contains supporting information online at www.pnas.org/cgi/content/full/0914187107/DCSupplemental.
References
- 1.Parada L, Misteli T. Chromosome positioning in the interphase nucleus. Trends Cell Biol. 2002;12:425–432. doi: 10.1016/s0962-8924(02)02351-6. [DOI] [PubMed] [Google Scholar]
- 2.Kumaran RI, Thakar R, Spector DL. Chromatin dynamics and gene positioning. Cell. 2008;132:929–934. doi: 10.1016/j.cell.2008.03.004. [DOI] [PMC free article] [PubMed] [Google Scholar]
- 3.Cremer T, Cremer C. Chromosome territories, nuclear architecture and gene regulation in mammalian cells. Nat Rev Genet. 2001;2:292–301. doi: 10.1038/35066075. [DOI] [PubMed] [Google Scholar]
- 4.Dekker J. Gene regulation in the third dimension. Science. 2008;319:1793–1794. doi: 10.1126/science.1152850. [DOI] [PMC free article] [PubMed] [Google Scholar]
- 5.Simonis M, et al. Nuclear organization of active and inactive chromatin domains uncovered by chromosome conformation capture-on-chip (4C) Nat Genet. 2006;38:1348–1354. doi: 10.1038/ng1896. [DOI] [PubMed] [Google Scholar]
- 6.Dekker J, Rippe K, Dekker M, Kleckner N. Capturing chromosome conformation. Science. 2002;295:1306–1311. doi: 10.1126/science.1067799. [DOI] [PubMed] [Google Scholar]
- 7.Miele A, Bystricky K, Dekker J. Yeast silent mating type loci form heterochromatic clusters through silencer protein-dependent long-range interactions. PLoS Genet. 2009;5:e1000478. doi: 10.1371/journal.pgen.1000478. [DOI] [PMC free article] [PubMed] [Google Scholar]
- 8.Freitas-Junior LH, et al. Frequent ectopic recombination of virulence factor genes in telomeric chromosome clusters of P. falciparum . Nature. 2000;407:1018–1022. doi: 10.1038/35039531. [DOI] [PubMed] [Google Scholar]
- 9.Gotta M, et al. The clustering of telomeres and colocalization with Rap1, Sir3, and Sir4 proteins in wild-type Saccharomyces cerevisiae . J Cell Biol. 1996;134:1349–1363. doi: 10.1083/jcb.134.6.1349. [DOI] [PMC free article] [PubMed] [Google Scholar]
- 10.Enomoto S, McCune-Zierath PD, Gerami-Nejad M, Sanders MA, Berman J. RLF2, a subunit of yeast chromatin assembly factor-I, is required for telomeric chromatin function in vivo. Genes Dev. 1997;11:358–370. doi: 10.1101/gad.11.3.358. [DOI] [PubMed] [Google Scholar]
- 11.Galy V, et al. Nuclear pore complexes in the organization of silent telomeric chromatin. Nature. 2000;403:108–112. doi: 10.1038/47528. [DOI] [PubMed] [Google Scholar]
- 12.Laroche T, et al. Mutation of yeast Ku genes disrupts the subnuclear organization of telomeres. Curr Biol. 1998;8:653–656. doi: 10.1016/s0960-9822(98)70252-0. [DOI] [PubMed] [Google Scholar]
- 13.Feuerbach F, et al. Nuclear architecture and spatial positioning help establish transcriptional states of telomeres in yeast. Nat Cell Biol. 2002;4:214–221. doi: 10.1038/ncb756. [DOI] [PubMed] [Google Scholar]
- 14.Therizols P, et al. Telomere tethering at the nuclear periphery is essential for efficient DNA double strand break repair in subtelomeric region. J Cell Biol. 2006;172:189–199. doi: 10.1083/jcb.200505159. [DOI] [PMC free article] [PubMed] [Google Scholar]
- 15.Cockell M, Gasser SM. Nuclear compartments and gene regulation. Curr Opin Genet Dev. 1999;9:199–205. doi: 10.1016/S0959-437X(99)80030-6. [DOI] [PubMed] [Google Scholar]
- 16.Hofmann JF, Laroche T, Brand AH, Gasser SM. RAP-1 factor is necessary for DNA loop formation in vitro at the silent mating type locus HML. Cell. 1989;57:725–737. doi: 10.1016/0092-8674(89)90788-5. [DOI] [PubMed] [Google Scholar]
- 17.Gilson E, Müller T, Sogo J, Laroche T, Gasser SM. RAP1 stimulates single- to double-strand association of yeast telomeric DNA: Implications for telomere-telomere interactions. Nucleic Acids Res. 1994;22:5310–5320. doi: 10.1093/nar/22.24.5310. [DOI] [PMC free article] [PubMed] [Google Scholar]
- 18.McBryant SJ, Krause C, Woodcock CL, Hansen JC. The silent information regulator 3 protein, SIR3p, binds to chromatin fibers and assembles a hypercondensed chromatin architecture in the presence of salt. Mol Cell Biol. 2008;28:3563–3572. doi: 10.1128/MCB.01389-07. [DOI] [PMC free article] [PubMed] [Google Scholar]
- 19.Louis EJ, Haber JE. The structure and evolution of subtelomeric Y’ repeats in Saccharomyces cerevisiae . Genetics. 1992;131:559–574. doi: 10.1093/genetics/131.3.559. [DOI] [PMC free article] [PubMed] [Google Scholar]
- 20.Schober H, et al. Controlled exchange of chromosomal arms reveals principles driving telomere interactions in yeast. Genome Res. 2008;18:261–271. doi: 10.1101/gr.6687808. [DOI] [PMC free article] [PubMed] [Google Scholar]
- 21.Heun P, Laroche T, Shimada K, Furrer P, Gasser SM. Chromosome dynamics in the yeast interphase nucleus. Science. 2001;294:2181–2186. doi: 10.1126/science.1065366. [DOI] [PubMed] [Google Scholar]
- 22.Bystricky K, Laroche T, van Houwe G, Blaszczyk M, Gasser SM. Chromosome looping in yeast: Telomere pairing and coordinated movement reflect anchoring efficiency and territorial organization. J Cell Biol. 2005;168:375–387. doi: 10.1083/jcb.200409091. [DOI] [PMC free article] [PubMed] [Google Scholar]
- 23.Robinett CC, et al. In vivo localization of DNA sequences and visualization of large-scale chromatin organization using lac operator/repressor recognition. J Cell Biol. 1996;135:1685–1700. doi: 10.1083/jcb.135.6.1685. [DOI] [PMC free article] [PubMed] [Google Scholar]
- 24.Michaelis C, Ciosk R, Nasmyth K. Cohesins: Chromosomal proteins that prevent premature separation of sister chromatids. Cell. 1997;91:35–45. doi: 10.1016/s0092-8674(01)80007-6. [DOI] [PubMed] [Google Scholar]
- 25.Berger AB, et al. High-resolution statistical mapping reveals gene territories in live yeast. Nat Methods. 2008;5:1031–1037. doi: 10.1038/nmeth.1266. [DOI] [PubMed] [Google Scholar]
- 26.Hediger F, Neumann FR, Van Houwe G, Dubrana K, Gasser SM. Live imaging of telomeres: yKu and Sir proteins define redundant telomere-anchoring pathways in yeast. Curr Biol. 2002;12:2076–2089. doi: 10.1016/s0960-9822(02)01338-6. [DOI] [PubMed] [Google Scholar]
- 27.Jin QW, Fuchs J, Loidl J. Centromere clustering is a major determinant of yeast interphase nuclear organization. J Cell Sci. 2000;113:1903–1912. doi: 10.1242/jcs.113.11.1903. [DOI] [PubMed] [Google Scholar]
- 28.Straight AF, Marshall WF, Sedat JW, Murray AW. Mitosis in living budding yeast: Anaphase A but no metaphase plate. Science. 1997;277:574–578. doi: 10.1126/science.277.5325.574. [DOI] [PubMed] [Google Scholar]
- 29.Powers T, Walter P. Regulation of ribosome biogenesis by the rapamycin-sensitive TOR-signaling pathway in Saccharomyces cerevisiae . Mol Biol Cell. 1999;10:987–1000. doi: 10.1091/mbc.10.4.987. [DOI] [PMC free article] [PubMed] [Google Scholar]
- 30.Bupp JM, Martin AE, Stensrud ES, Jaspersen SL. Telomere anchoring at the nuclear periphery requires the budding yeast Sad1-UNC-84 domain protein Mps3. J Cell Biol. 2007;179:845–854. doi: 10.1083/jcb.200706040. [DOI] [PMC free article] [PubMed] [Google Scholar]
- 31.Bystricky K, Heun P, Gehlen L, Langowski J, Gasser SM. Long-range compaction and flexibility of interphase chromatin in budding yeast analyzed by high-resolution imaging techniques. Proc Natl Acad Sci USA. 2004;101:16495–16500. doi: 10.1073/pnas.0402766101. [DOI] [PMC free article] [PubMed] [Google Scholar]
- 32.Dekker J. Mapping in vivo chromatin interactions in yeast suggests an extended chromatin fiber with regional variation in compaction. J Biol Chem. 2008;283:34532–34540. doi: 10.1074/jbc.M806479200. [DOI] [PMC free article] [PubMed] [Google Scholar]
- 33.McBryant SJ, Krause C, Hansen JC. Domain organization and quaternary structure of the Saccharomyces cerevisiae silent information regulator 3 protein, Sir3p. Biochemistry. 2006;45:15941–15948. doi: 10.1021/bi061693k. [DOI] [PubMed] [Google Scholar]
- 34.Marenduzzo D, Finan K, Cook PR. The depletion attraction: An underappreciated force driving cellular organization. J Cell Biol. 2006;175:681–686. doi: 10.1083/jcb.200609066. [DOI] [PMC free article] [PubMed] [Google Scholar]
- 35.Mondoux MA, Scaife JG, Zakian VA. Differential nuclear localization does not determine the silencing status of Saccharomyces cerevisiae telomeres. Genetics. 2007;177:2019–2029. doi: 10.1534/genetics.107.079848. [DOI] [PMC free article] [PubMed] [Google Scholar]
- 36.Burgess SM, Kleckner N. Collisions between yeast chromosomal loci in vivo are governed by three layers of organization. Genes Dev. 1999;13:1871–1883. doi: 10.1101/gad.13.14.1871. [DOI] [PMC free article] [PubMed] [Google Scholar]
- 37.Guelen L, et al. Domain organization of human chromosomes revealed by mapping of nuclear lamina interactions. Nature. 2008;453:948–951. doi: 10.1038/nature06947. [DOI] [PubMed] [Google Scholar]
- 38.Simonoff JS. Smoothing Methods in Statistics. New York: Springer; 1996. [Google Scholar]
- 39.Zeileis A, Kleiber C, Krämer W, Hornik K. Testing and dating of structural changes in practice. Comput Stat Data Anal. 2003;44:109–123. [Google Scholar]
- 40.Gordon AD. Classification. London: CRC; 1999. [Google Scholar]
Associated Data
This section collects any data citations, data availability statements, or supplementary materials included in this article.