Abstract
Prostaglandin (PG) E2 has multiple actions that may affect blood pressure. It is synthesized from arachidonic acid by the sequential actions of phospholipases, cyclooxygenases, and PGE synthases. While microsomal PGE synthase 1 (mPGES1) is the only genetically-verified PGE synthase, results of previous studies examining the consequences of mPGES1-deficiency on blood pressure (BP) are conflicting. To determine whether genetic background modifies the impact of mPGES1 on BP, we generated mPGES1−/− mice on two distinct inbred backgrounds, DBA/1lacJ and 129/SvEv. On the DBA/1 background, baseline BP was similar between wild-type (WT) and mPGES1−/− mice. By contrast, on the 129 background, baseline BPs were significantly higher in mPGES1−/− animals than WT controls. During angiotensin II infusion, the DBA/1 mPGES1−/− and WT mice developed mild hypertension of similar magnitude, while 129-mPGES1−/− mice developed more severe hypertension than WT controls. DBA/1 animals developed only minimal albuminuria in response to angiotensin II infusion. By contrast, WT 129 mice had significantly higher levels of albumin excretion than WT DBA/1 and the extent of albuminuria was further augmented in 129 mPGES1−/− animals. In WT mice of both strains, the increase in urinary excretion of PGE2 with angiotensin II was attenuated in mPGES1−/− animals. Urinary excretion of thromboxane was unaffected by angiotensin II in the DBA/1 lines but increased more than 4-fold in 129 mPGES1−/− mice. These data indicate that genetic background significantly modifies the BP response to mPGES1 deficiency. Exaggerated production of thromboxane may contribute to the robust hypertension and albuminuria in 129 mPGES1-deficient mice.
Keywords: prostanoids, PGE synthase, blood pressure, strain, hypertension
INTRODUCTION
Prostaglandin (PG) E2 is a key product of the cyclooxygenase (COX) pathway of arachidonic acid metabolism. This lipid mediator has diverse actions that include cytoprotective functions in the GI tract, regulating smooth muscle tone in airways and vasculature, modulating the immune system, and triggering febrile responses in the brain1-3. In the kidney, PGE2 is one of the most abundant metabolites of arachidonic acid and thus has a significant capacity to influence renal blood flow, sodium excretion, and regulation of blood pressure 4. These actions may be through direct effects on renal vascular tone 5, 6 and epithelial function 7, 8, and indirectly through its actions to trigger renin release at the macula densa 9-11.
PGE2 is produced by a series of three enzymatic reactions: release of arachidonic acid from membrane phospholipids by the actions of phospholipases, conversion of arachidonic acid to unstable endoperoxide intermediates by cyclooxygenases (COX-1 and –2), and finally, isomerization of PGH2 to PGE2 by terminal PGE synthases (PGES). The temporal and spatial properties of PGE2 synthesis are determined by the regulated expression of each of the enzymes involved in this cascade. The first PGE synthase to be identified was microsomal PGE synthase 1 (mPGES1) 12, and to date it remains the only genetically-verified PGE synthase. Other putative PGE synthases including mPGES2 and cytosolic PGES (cPGES) have been described based on their capacity to generate PGE2 in vitro 13, 14. However, recent evidence indicates that neither of these proteins function as PGE synthases in vivo 15, 16.
Studies using mPGES1−/− mice indicate that mPGES1 is responsible for the late phase of PGE2 synthesis during inflammation via a pathway that depends on COX-2 17. Febrile responses to LPS are also mediated by mPGES1 18 and mPGES1 is the source of PGE2 that facilitates acute inflammatory pain 17. Expression of mPGES1 is markedly upregulated in synovial tissues in arthritis 19, contributing to the pathogenesis of joint inflammation and swelling 17. Taken together, these observations suggest that inhibition of mPGES1 might be useful for the treatment of inflammation and pain, providing a more limited therapeutic target than non-steroidal anti-inflammatory drugs (NSAIDs) or COX-2 inhibitors that cause a more global suppression of prostanoid synthesis. Moreover, since blockade of mPGES1 would not directly affect synthesis of PGI2, an important vasodilator and anti-aggregant compound in the vasculature, adverse cardiovascular consequences such as hypertension and coronary thrombosis associated with COX inhibitors might be avoided by specific mPGES1 inhibitors.
The effects of mPGES1 deficiency on blood pressure and atherosclerosis have also been examined in several previous studies. For example, in a mouse model of atherosclerosis, the absence of mPGES1 was associated with attenuated atherogenesis 20. On the other hand, studies of blood pressure regulation in mPGES1-deficient mice have yielded conflicting results, where in mPGES1-deficient mice have been reported to have normal 20-23 or reduced 24, 25 baseline blood pressures with normal or exaggerated responses to high salt feeding 21, 24. Moreover, one group has reported that these animals have increased susceptibility to angiotensin II-dependent hypertension 24. The genetic background of these various mPGES1-deficient mouse lines were all different. Since genetic background can have a marked influence on the phenotypes of genetically modified mice 26-28, we considered the possibility that the variable blood pressure responses observed in studies of mPGES1−/− mice might be related to effects of strain-specific genetic modifiers. To address this issue, we generated mPGES1−/− mice on two distinct inbred backgrounds, DBA/1lacJ (DBA/1) and 129/SvEv (129), and compared blood pressure at baseline and during Ang II-dependent hypertension. We find strong effects of genetic background to influence the consequences of mPGES1 deficiency on blood pressure, albuminuria, and the generation of other vasoactive prostanoids.
MATERIALS AND METHODS
Animals
Production of inbred DBA/1 mice with targeted disruption of the mPGES1 (Ptges1) gene using embryonic stem (ES) cells derived from DBA/1lacJ inbred mice has been described previously 17. 129/SvEv mPGES1−/− and +/+ mice were generated by back-crossing the mPGES1 mutation onto the 129/SvEv genetic background for more than eight generations. Inbred DBA/1lacJ and 129/SvEv mPGES1−/− and +/+ male mice generated by inter-crossing mPGES1+/− mice of each strain were used for the studies described here. Animals were maintained in the animal facility of the Durham Veterans Affairs Medical Center and studied between two and four months of age. The experimental procedures described below were approved by the respective IACUCs of the Durham VA and Duke University Medical Centers. Mice were fed a normal chow diet (0.4% NaCl; LabDiet, Richmond, IN).
Radiotelemetry measurements of intra-arterial pressure
Blood pressure was measured in conscious mice by radiotelemetry using TA11PA-C10 transmitters (Data Sciences International, St. Paul, MN) as described previously29, 30. Mice were allowed to recover for 7 days after surgery to regain their normal circadian rhythms before experiments were initiated. During blood pressure measurements, mice were housed in a monitoring room in the animal facility where quiet is maintained and no other activities are permitted. Data were collected continuously with sampling every 5 minutes for 10-second intervals using Dataquest A.R.T. software (Data Sciences International).
Angiotensin II-induced hypertension
Baseline blood pressure was recorded for three consecutive days, and then an osmotic minipump (Alzet model 2004, DURECT, Cupertino, CA) infusing Ang II (Sigma, St. Louis, MO) at a rate of 1,000 ng/kg/min was implanted subcutaneously, as described previously 30, and blood pressure measurements continued for three weeks.
Reverse transcription and real-time quantitative PCR
Total RNA was extracted (Tri-Reagent, Sigma) from mouse kidneys and reverse transcription and real-time PCR were performed as previously described 31. Primers and dual-labeled probe (5’-FAM, 3’-TAMRA) targeting renin were synthesized based on previously published sequences32. Primer-probe sets for COX-1 (assay ID Mm00477214_m1) and COX-2 (assay ID Mm00478374_m1) were purchased from Applied Biosystems (Foster City, CA).
Urinary excretion of albumin and prostanoid metabolites
24-hour urine samples were collected by metabolic cage at baseline and after three weeks of Ang II infusion. Urine samples were centrifuged briefly to remove particulate matter, then immediately aliquoted and frozen at –80°C until assay. Urinary albumin excretion was measured using a specific ELISA assay for mouse albumin (Albuwell, Exocell, Philadelphia, PA). Stable prostanoid metabolites [13, 14-dihydro-15-keto-PGE1/PGE2 (prostaglandin E2), TxB2 (thromboxane A2) , and 6-keto-PGF1α (prostaglandin I2)] in urine were measured using specific competitive enzyme immunoassays for each molecule (Cayman Chemical, Ann Arbor, MI). Creatinine levels in urine were assessed using an alkaline picrate assay (Creatinine Companion, Exocell, Inc., Philadelphia, PA).
Statistical analyses
All data are presented as mean ± SEM. Differences between groups were analyzed by unpaired t-test or two-way ANOVA followed by Bonferroni post-hoc test, as indicated, using GraphPad Prism software version 4.00 (GraphPad Software, San Diego, CA). Differences within groups, before and after Ang II infusion, were analyzed by paired t-test. A p-value of less than 0.05 was considered significant.
RESULTS
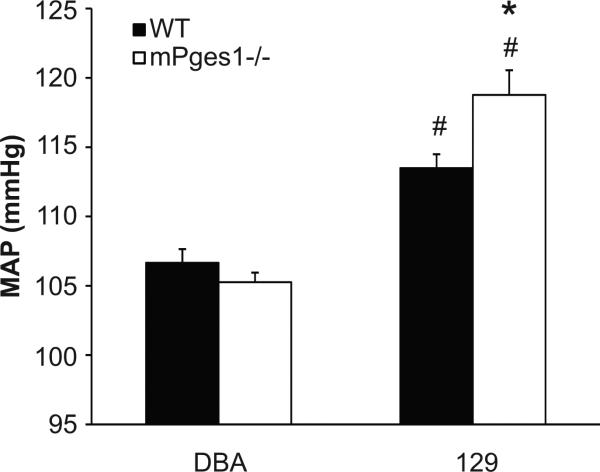
We first measured blood pressures in the different mouse lines using radiotelemetry. At baseline, blood pressures in the WT 129 mice (113±1 mm Hg) were significantly higher than the WT DBA/1 animals (105±1 mm Hg; p<0.001). As shown in Figure 1, there were no differences in blood pressure between DBA/1 WT and mPGES1−/− mice (MAP 105±1 vs. 107±1 mm Hg). By contrast, baseline blood pressures were significantly higher in the 129-mPGES1−/− animals (119±2 mm Hg) compared to the 129-WT controls (113±1 mm Hg; p=0.008).
Figure 1.
Baseline mean arterial pressure (MAP) in wild-type (black bars, n=8-10) and mPGES1−/− (white bars, n=5-9) mice on the DBA/1lacJ and 129/SvEv genetic backgrounds. Blood pressure was measured continuously in conscious animals by radiotelemetry. Data are 24-hour mean values for three consecutive days of recordings. *p<0.05 vs. WT, # p<0.05 vs. DBA/1lacJ by two-way ANOVA with Bonferroni post test.
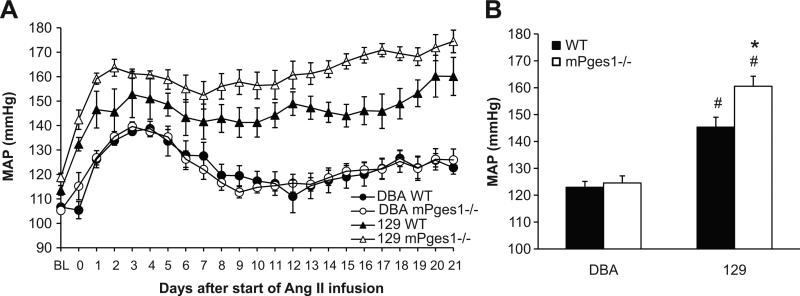
It has been suggested that stimulation of PGE2 synthesis may attenuate blood pressure elevation in various hypertensive states 33. Therefore, we next investigated the consequences of mPGES1 deficiency on Ang II-induced hypertension. As shown in Figure 2A, continuous infusion of Ang II increased blood pressure by 30-40 mm Hg over the first 3-4 days in the WT DBA/1 mice, followed by a waning of the blood pressure level over the next week, achieving a new, more modestly elevated level by the end of the infusion period. The pattern and magnitude of the hypertensive response to chronic Ang II was virtually identical in the DBA/1 mice lacking mPGES1 and, thus, the average of the mean arterial pressures for the 3 weeks of angiotensin II infusion were similar in the DBA/1 WT (123±2 mm Hg) and mPGES1-deficient mice (124±3 mm Hg; Figure 2B). As shown in Figures 2A and B, the extent of the blood pressure elevation in the WT 129 mice was significantly greater than the WT DBA/1 animals (145±4 vs. 123±2 m Hg; p<0.001). Moreover, the marked elevation in blood pressure in the 129-WT group was sustained throughout the 3 weeks of infusion (Figure 2A). The 129-mPGES1−/− group developed hypertension that was significantly more severe compared to their WT-129 littermates, (160±4 vs. 145±4 mm Hg, p=0.01; Fig. 2B).
Figure 2.
Angiotensin II-dependent hypertension in DBA/1lacJ and 129/SvEv mice in the presence and absence of mPGES1. Ang II (1000 ng/kg/min) was infused for three weeks by osmotic mini-pump while blood pressure was measured simultaneously by radiotelemetry. A: Time course of Ang II-induced hypertension in WT and mPGES1-deficient mice on the DBA/1lacJ and 129/SvEv genetic backgrounds. B: Group means for three weeks of Ang II infusion in DBA/1 (WT, n=9; mPGES1−/−, n=8) and 129/SvEv (WT, n=8; mPGES1−/−, n=5) mice. *p<0.05 vs. WT, # p<0.05 vs. DBA/1 by two-way ANOVA with Bonferroni post test.
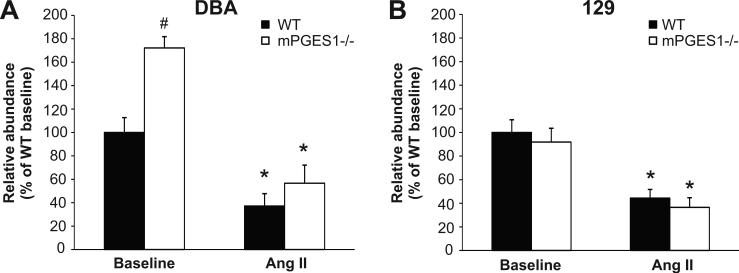
As shown in Figure 3 (left panel), levels of renin mRNA expression were significantly higher in kidneys from mPGES1−/− DBA/1 than their WT controls at baseline (172±10 vs. 100±13% of WT, p<0.05). This baseline difference was not seen in the 129 mice (100±11 vs. 92±12% of WT). Renin mRNA expression was suppressed significantly and to similar levels in both the DBA/1 (37±10 vs. 57±16% of WT baseline; WT p<0.05 vs. baseline) and 129 mice (44±7 vs. 36±8% of WT baseline; p<0.01 vs. baseline) during angiotensin II infusion.
Figure 3.
Renin mRNA expression in kidneys of DBA/1 and 129/SvEv mice. Whole kidney cDNA was used for real-time quantitative RT-PCR analysis of renin mRNA levels at baseline and after three weeks of Ang II infusion. Data are expressed as % of DBA/1 and 129 WT baseline. * p<0.05 vs. baseline, # p<0.05 vs. WT by two-way ANOVA with Bonferroni post test.
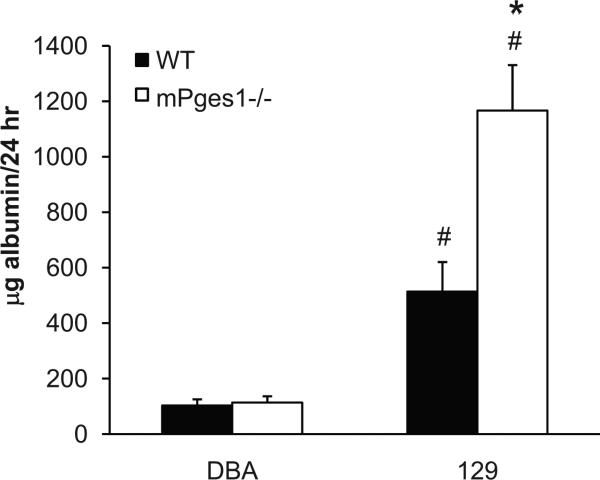
To determine whether mPGES1 affects kidney damage induced by angiotensin II, we measured urinary albumin excretion at baseline and after three weeks of Ang II infusion. Basal levels of albumin excretion were similar in DBA and 129 WT mice (50±18 vs. 15±4 μg/24hr), and were unaffected by mPGES1 deletion in both strains of mice (DBA: 37±7; 129: 17±3 μg/24hr) (data not shown). With Ang II infusion, urinary albumin excretion increased only modestly in the WT DBA/1 animals (103±22 μg/24 hrs) and levels of albuminuria were basically unaffected by the absence of mPGES1 in the DBA/1-mPGES1−/− group (114±23 μg/24 hrs; Figure 4). By contrast, Ang II caused marked proteinuria in the WT 129 mice such that their levels of albumin excretion (514±106 μg/24 hrs) were significantly higher than the WT DBA/1 group (p=0.002), as shown in Figure 4. The extent of albuminuria was further augmented in the 129 mPGES1−/− animals (1167±164 μg/24h; p=0.003 vs. WT).
Figure 4.
Urinary albumin excretion after chronic Ang II infusion in DBA/1 and 129/SvEv WT and mPGES1−/− animals. Albumin levels were measured by ELISA in 24-hour urine samples after three weeks of Ang II infusion. * p<0.05 vs. WT, # p<0.05 vs. DBA/1 by two-way ANOVA with Bonferroni post test.
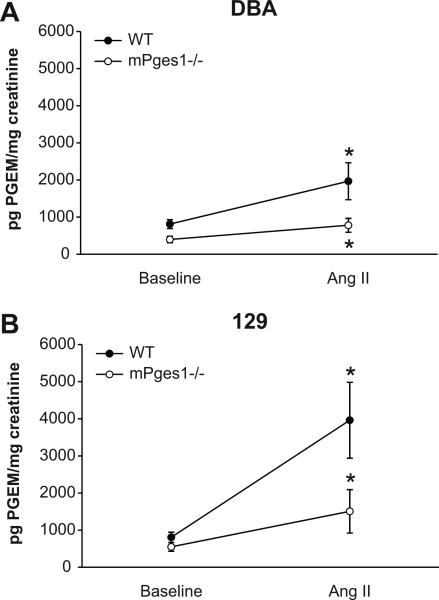
To examine whether the absence of mPGES1 affected prostanoid metabolism and whether this might be affected by genetic background, we measured urinary prostanoid excretion in the various lines at baseline and during Ang II infusion. At baseline, urinary PGE2 excretion was similar in DBA and 129 WT mice (813±120 vs. 808±137 pg/mg creatinine, Fig. 5). Mice lacking mPGES1 had reduced baseline PGE2 excretion compared to WT, though the difference did not reach statistical significance in 129 animals (DBA: 398±87 pg/mg creatinine, p=0.01; 129: 550±119 pg/mg creatinine, p=0.09; Fig. 5). Chronic infusion of Ang II caused significant increases in urinary excretion of PGE2 metabolite in WT mice of both strains (DBA: 1968±498 pg/mg creatinine, p<0.01 vs. baseline; 129: 3962±1022 pg/mg creatinine, p<0.001 vs. baseline; Fig. 5). The levels of PGE2 metabolite in urine during Ang II infusion tended to be higher in the WT 129 compared to WT DBA/1, however this difference did not achieve statistical significance. As shown in Figure 5, the increased PGE2 excretion during Ang II-dependent hypertension was attenuated in the mPGES1−/− animals of both strains compared to WT controls, though again the difference between 129-WT and mPGES1−/− animals was not statistically significant (DBA: 781±187 (mPGES1−/−) vs. 1968±498 (WT) pg/mg creatinine, p=0.032; 129: 1508±585 (mPGES1−/−) vs. 3962±1022 (WT) pg/mg creatinine, p=0.06).
Figure 5.
Urinary PGE metabolite excretion. PGE metabolite levels were measured in 24-hour urine samples before and after three weeks of Ang II infusion in DBA/1lacJ (left panel) and 129/SvEv (right panel) mice comparing WT (black circles) and mPGES1-deficient (white circles) mice. * p<0.05 vs. baseline by paired t-test.
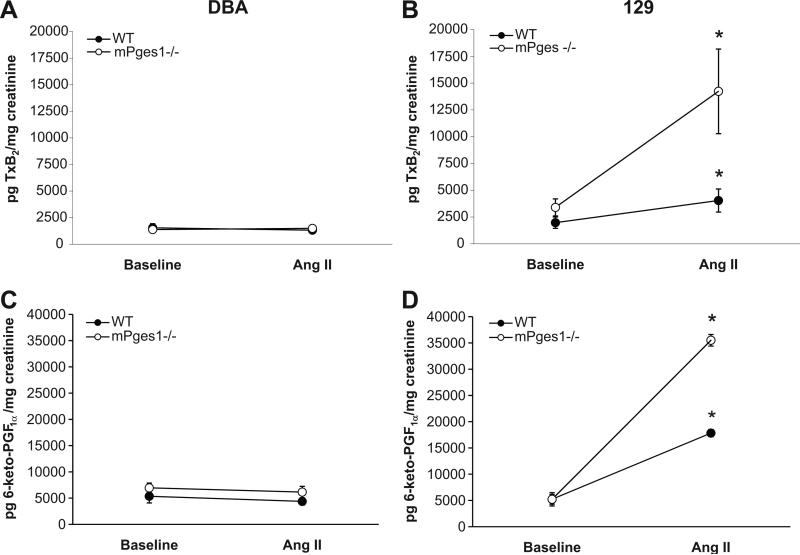
We next measured urinary excretion of thromboxane (Tx) B2, the stable metabolite of the potent vasocontrsictor prostanoid TxA2 (Fig. 6, top panels), which has been implicated in the pathogenesis of Ang II-dependent hypertension 34-36. At baseline, there were no differences in excretion of urinary TxB2 between WT DBA/1 and 129 mice (1542±391 vs. 1976±529 pg/mg creatinine). On the DBA/1 background, absence of mPGES1 has no effect on TxB2 excretion at baseline (1376±232 vs.1542±391 pg/mg creatinine, p=NS), whereas urinary TxB2 was higher in 129-mPGES1−/− mice compared to the 129 WT controls, though the difference was not statistically significant (3402±796 vs. 1976±529: p=0.074). As shown in Figure 6 (top panels), chronic infusion of Ang II had no effect on urinary TxB2 excretion in the DBA lines (WT 1542±391 to 1319±172 pg/mg creatinine, p=NS; mPGES1−/− 1376±232 to 1488±300 pg/mg creatinine, p=NS). In marked contrast, there were significant increases in urinary TxB2 excretion with Ang II infusion by 2-fold in 129 WT (1976±529 to 4043±1077 pg/mg creatinine, p=0.047) and more than 4-fold in 129 mPGES1−/− mice (3402±796 to 14235±3948 pg/mg creatinine, p=0.002) (Fig. 5, right panel).
Figure 6.
Urinary excretion of thromboxane A2 and prostacylin metabolites. Levels of TxB2 (top panels) and 6-keto-PGF1α (bottom panels) were measured in 24-hour urine samples by enzyme immunoassay in DBA/1 and 129 mice. * p<0.05 vs. baseline by paired t-test.
We measured urinary excretion of 6-keto-PGF1α, the stable metabolite of prostacyclin, a potent vasodilator and anti-thrombotic prostanoid (Fig. 6). At baseline, excretion of urinary 6-keto-PGF1α was very similar in all 4 experimental groups and there was no difference in excretion of the PGI2 metabolite between WT and mPGES1-deficient mice on the DBA/1 (5350±1264 vs.6948±924 pg/mg creatinine, p=NS) or 129 backgrounds (5223±1291 vs. 5218±1153, p=NS). As shown in Figure 6, urinary 6-keto-PGF1α excretion in the DBA lines was virtually unaffected by chronic infusion of angiotensin II (WT 5350±1264 to 4375±670 pg/mg creatinine, p=NS; mPGES1−/− 6948±924 to 6145±1108 pg/mg creatinine, p=NS). By contrast, there were significant increases in urinary 6-keto-PGF1α excretion with Ang II infusion by more than 3-fold in 129 WT (5223±1291 to 17836±4088 pg/mg creatinine, p<0.01) and by nearly 7-fold in 129 mPGES1−/− mice (5218±1153 to 35517±5463 pg/mg creatinine, p<0.001).
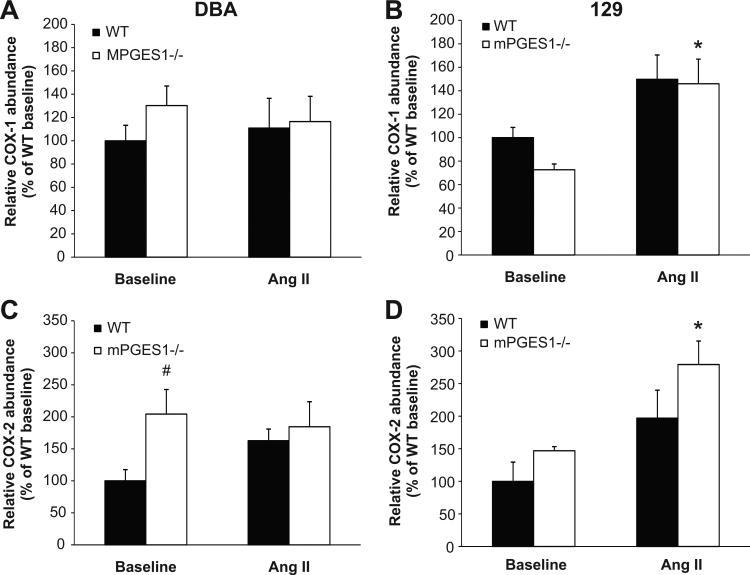
We next measured mRNA levels for the cyclo-oxygenase enzymes COX-1 and -2 (Fig. 7). At baseline, the relative expression of COX-1 in the kidney was not significantly different between WT and mPGES1 deficient mice from both strains (100±13 vs. 130±17% for DBA/1 and 100±9 vs. 73±5% of WT for 129). Infusion of angiotensin II did not affect COX-1 mRNA abundance in the DBA/1 mice (WT 111±26 vs. mPGES1−/− 116±22% of WT baseline). In contrast, COX-1 mRNA levels increased with Ang II infusion by ≈50% in both 129 WT (150±21% of WT baseline, p=NS) and mPGES1−/− animals (146±21% of WT baseline, p<0.05), although this increase was statistically significant only in the mPGES1−/− group. As shown in Figure 7, baseline COX-2 expression was 2-fold higher in kidneys of DBA/1 mPGES1−/− animals than their WT controls (100±18 vs. 204±38% of WT; p<0.05), but there was no difference in COX-2 mRNA levels in the 129 mPGES1−/− mice at baseline (100±29 vs. 147±6% of WT; p=0.061). Ang II infusion did not significantly alter COX-2 mRNA abundance in either group of DBA/1 mice (WT 163±18 vs. mPGES1−/− 184±39% of WT baseline), whereas COX-2 mRNA levels increased 2-fold with Ang II infusion in both 129 WT (197±43% of WT baseline, p=NS) and mPGES1−/− animals (279±36% of WT baseline, p<0.05), but this increase was statistically significant only in the 129-mPGES1−/− group.
Figure 7.
Expression of cyclo-oxygenase (COX) isoforms COX-1 and COX-2 in mouse kidneys. Total RNA was isolated from kidneys and levels of mRNA for COX-1 (upper panels) and COX-2 (lower panels) were measured by real-time RT-PCR at baseline and after three weeks of Ang II infusion in DBA/1 (A,C) and 129/SvEv (B,D) mice. * p<0.05 vs. baseline by two-way ANOVA with Bonferroni post test; # p<0.05 vs. WT by two-way ANOVA with Bonferroni post test.
DISCUSSION
A role for PGE2 in blood pressure homeostasis was first suggested by studies documenting its vasodilator actions in the systemic circulation 37, 38. Infusion of PGE2 into the kidney commonly causes renal vasodilation 39, 40. Moreover, relative to other COX products, PGE2 is generated in substantial quantities by the kidney, where it is has potent natriuretic effects. The major sites of PGE2 generation by the kidney are renal medullary interstitial cells and collecting duct 8, 41, 42. This segment of the nephron plays a critical role in the final adjustments of sodium excretion that have a major impact on fluid volume and blood pressure homeostasis.
To examine the contributions of PGE2 to blood pressure homeostasis, mice lacking mPGES1 have been utilized. We previously found that the absence of mPGES1 in mice on an inbred DBA/1 background had no effect on blood pressures during feeding of normal (0.4% NaCl) or high (6% NaCl) salt diets 21. These findings were similar to the report from the FitzGerald group demonstrating normal blood pressures in mice lacking mPGES1 22. By contrast, Yang and associates found that mPGES1-deficient mice developed hypertension with high salt feeding 24. Moreover, they also reported that mPGES1-deficient mice were more susceptible to hypertension caused by chronic infusion of angiotensin II, manifesting exaggerated oxidative stress in this setting 25. On the other hand, subsequent work by FitzGerald and associates showed that deletion of mPGES1 in LDL receptor-deficient mice does not affect their hypertensive response to chronic infusions of angiotensin II but protects them from aortic aneurysm formation and significantly reduces oxidative stress 23. The reasons for the differing outcomes of these studies of mPGES1-deficient mice are not clear. Because the strain combinations are different in each of the mPGES1-deficient lines from these studies, the effects of genetic background to influence the mPGES1 phenotype may be one factor explaining the different phenotypes.
To evaluate the potential for strain-specific factors to modify the phenotype of mPGES1-deficiency, we generated mice lacking mPGES1 on two distinct genetic backgrounds: DBA/1lacJ and 129/SvEv. DBA/1 mice are susceptible to the development of collagen-induced arthritis and 129 mice are salt-sensitive with enhanced susceptibility to kidney injury 17, 26-28. We found that wild-type 129/SvEv mice have higher baseline blood pressure than wild-type DBA/1lacJ animals. Although deletion of mPGES1 had no effect on blood pressure on the DBA/1 background, blood pressures were significantly higher in mPGES1-deficient 129 mice compared to the 129 wild-type controls. Thus, genetic background significantly modifies the consequences of mPGES1-deficiency on baseline blood pressure.
Along with the effects on baseline blood pressure, the 129 background also proved more susceptible to the development of hypertension. Whereas the mPGES1-deficient mice on the DBA/1 background had blood pressure responses to chronic angiotensin II infusion that were virtually identical to the DBA/1 wild-type group, the severity of hypertension was substantially augmented in the 129-mPGES1−/− mice compared to the 129 wild-type controls (Figure 2). Our findings are generally consistent with previous studies indicating that there are strain-specific genetic modifiers enhancing susceptibility to hypertension in 129 mice 28, 43, 44. Moreover, our studies indicate a significant impact of mPGES1 to attenuate hypertension in the 129 but not the DBA/1 strain. This may explain some of the inconsistencies in blood pressure phenotypes previously reported for mPGES1-deficient mouse lines, which consisted of varying contributions from DBA/1 and 129 backgrounds 20-25.
Enhanced hypertension in the 129 animals was also accompanied by exaggerated kidney injury as reflected by increased albumin excretion during angiotensin II infusion. This was apparent in the 129 wild-type mice compared to the wild-type DBA/1 group, consistent with enhanced susceptibility to kidney injury that have been observed in this strain 26-28. Furthermore, albuminuria induced by Ang II infusion was dramatically enhanced in the mPGES1-deficient 129 mice. Since the extent of blood pressure elevation was also more severe in the 129-mPGES1−/−, it is not clear whether the worsening proteinuria was due to more severe hypertension or reflected a vulnerability to kidney damage due to the absence of mPGES1. By contrast, DBA/1 wild-type mice developed only modest albuminuria during angiotensin II infusion, and this was not augmented in the DBA/1-mPGES1−/− animals. These findings show that actions of mPGES1 to protect against kidney injury are also conditioned by genetic background.
PGE2 synthesis is stimulated during hemodynamic stress, and it has been suggested that increased levels of PGE2 may be a compensatory response to attenuate the development of hypertension45. Chronic infusion of angiotensin II stimulated increased urinary excretion of PGE metabolite in wild-type mice of both DBA/1 and 129 strains. Elimination of mPGES1 significantly attenuated PGE2 metabolite excretion by a similar amount (≈60%) in mPGES1-deficient mice on both DBA and 129 backgrounds (Figure 5). Thus, mPGES1 plays a significant role to increase PGE2 production in response to angiotensin II. However, there is significant residual production of PGE2 in both lines of mPGES1−/− mice suggesting that there are robust pathways for PGE2 synthesis in vivo that do not require mPGES1. Despite a similar diminution of PGE2 excretion and higher absolute levels of urinary PGE2 metabolite with angiotensin II infusion in mPGES1−/− animals on the 129 background, hypertension was significantly more severe in the 129 compared to DBA/1 mice. Accordingly, the different blood pressure responses cannot be explained by differences in PGE2 metabolism.
Altered generation of other prostanoids, such as the potent vasoconstrictor TxA2 34-36, might explain the variable blood pressure responses that we observed. At baseline, urinary excretion of TxB2, the stable metabolite of TxA2, were similar in all of the DBA/1 and 129 lines. Angiotensin II had no effect on urinary TxB2 levels in DBA/1 mice but stimulated urinary TxB2 excretion in the 129 mice that was more marked in the 129-mPGES1-deficient mice to levels that were much more pronounced than any of the other experimental groups. The general patterns for urinary excretion patterns of 6-keto-PGF1α the major metabolite of PGI2, resembled those for thromboxane. The more marked stimulation of thromboxane and prostacyclin with angiotensin II in the 129 strain mice was mirrored by increased expression of both COX isoforms.
The precise cause of enhanced susceptibility to hypertension in the 129-mPGES1−/− mice is not completely clear from our studies. While this cannot be explained by altered renin responses, differences in COX expression and prostanoid production in response to angiotensin II were quite marked between the 129 and DBA/1 lines. In particular, we speculate that augmented generation of thromboxane may contribute to the severity of hypertension in 129 mPGES1−/− mice since previous studies by our group using thromboxane receptor (TP)-deficient mouse lines have shown that enhanced generation of TxA2 contributes to blood pressure elevation and end-organ damage in angiotensin II-dependent hypertension 34. However, the physiological consequences of altered prostanoid generation are complex and are likely determined by the balance of vasoconstrictor and vasodilator prostanoids at key tissue sites. In this regard, the ratio of TxB2/PGE2 is increased more than nine-fold and TxB2/6-keto-PGF1α is increased 2-fold during angiotensin II infusion in the 129-mPges1−/− mice compared to the 129 wild-type controls. This indicates a tendency toward enhanced thromboxane generation in the mPGES1-deficient mice on the 129 strain mice that could contribute to their susceptibility to develop hypertension.
Expression of mPGES1 is enhanced in inflammatory states and this is likely responsible for the increased production of PGE2 that accompanies inflammation. Studies in mice lacking individual E-prostanoid (EP) receptor isoforms suggest that PGE2 is responsible for inflammatory pain 46 and fever 47. It is perhaps not surprising that genetic deletion of mPGES1 recapitulates many of the beneficial anti-inflammatory actions of NSAIDs. Accordingly, it has been suggested that small molecule inhibitors of mPGES1 might be useful anti-inflammatory agents encompassing the beneficial effects of NSAIDs without the associated cardiovascular hazard. With regard to the propensity to cause hypertension, our study suggests that the impact of mPGES1 blockade on blood pressure may be influenced by genetic background and associated stimulation of TxA2 production.
PERSPECTIVES
mPGES1 inhibitors have been proposed as a potential new class of NSAIDs with fewer cardiovascular side effects compared to traditional NSAIDs or selective COX-2 inhibitors. Our data suggest that inhibiting mPGES1 may produce variable cardiovascular effects depending on genetic and environmental factors. Identification of genetic variables that influence the renal and cardiovascular response to mPGES1 inhibition may facilitate safe and effective therapies targeting this enzyme.
SOURCES OF FUNDING
This work was supported by National Institutes of Health grant DK069896, Ruth L. Kirschstein NRSA F32DK076241-02, the Medical Research Service of the Veterans Administration, and the Edna and Fred L. Mandel Center for Hypertension and Atherosclerosis Research at Duke.
Footnotes
CONFLICTS OF INTEREST/DISCLOSURES
None.
Publisher's Disclaimer: This is a PDF file of an unedited manuscript that has been accepted for publication. As a service to our customers we are providing this early version of the manuscript. The manuscript will undergo copyediting, typesetting, and review of the resulting proof before it is published in its final citable form. Please note that during the production process errors may be discovered which could affect the content, and all legal disclaimers that apply to the journal pertain.
REFERENCES
- 1.Stenson WF. Prostaglandins and epithelial response to injury. Curr Opin Gastroenterol. 2007;23:107–110. doi: 10.1097/MOG.0b013e3280143cb6. [DOI] [PubMed] [Google Scholar]
- 2.Blatteis CM, Li S, Li Z, Feleder C, Perlik V. Cytokines, PGE2 and endotoxic fever: a reassessment. Prostaglandins Other Lipid Mediat. 2005;76:1–18. doi: 10.1016/j.prostaglandins.2005.01.001. [DOI] [PubMed] [Google Scholar]
- 3.Harris SG, Padilla J, Koumas L, Ray D, Phipps RP. Prostaglandins as modulators of immunity. Trends Immunol. 2002;23:144–150. doi: 10.1016/s1471-4906(01)02154-8. [DOI] [PubMed] [Google Scholar]
- 4.Hao CM, Breyer MD. Physiological regulation of prostaglandins in the kidney. Annu Rev Physiol. 2008;70:357–377. doi: 10.1146/annurev.physiol.70.113006.100614. [DOI] [PubMed] [Google Scholar]
- 5.Purdy KE, Arendshorst WJ. EP(1) and EP(4) receptors mediate prostaglandin E(2) actions in the microcirculation of rat kidney. Am J Physiol Renal Physiol. 2000;279:F755–764. doi: 10.1152/ajprenal.2000.279.4.F755. [DOI] [PubMed] [Google Scholar]
- 6.Silldorff EP, Yang S, Pallone TL. Prostaglandin E2 abrogates endothelin-induced vasoconstriction in renal outer medullary descending vasa recta of the rat. J Clin Invest. 1995;95:2734–2740. doi: 10.1172/JCI117976. [DOI] [PMC free article] [PubMed] [Google Scholar]
- 7.Guan Y, Zhang Y, Breyer RM, Fowler B, Davis L, Hebert RL, Breyer MD. Prostaglandin E2 inhibits renal collecting duct Na+ absorption by activating the EP1 receptor. J Clin Invest. 1998;102:194–201. doi: 10.1172/JCI2872. [DOI] [PMC free article] [PubMed] [Google Scholar]
- 8.Bonvalet JP, Pradelles P, Farman N. Segmental synthesis and actions of prostaglandins along the nephron. Am J Physiol. 1987;253:F377–387. doi: 10.1152/ajprenal.1987.253.3.F377. [DOI] [PubMed] [Google Scholar]
- 9.Ito S, Carretero OA, Abe K, Beierwaltes WH, Yoshinaga K. Effect of prostanoids on renin release from rabbit afferent arterioles with and without macula densa. Kidney Int. 1989;35:1138–1144. doi: 10.1038/ki.1989.102. [DOI] [PubMed] [Google Scholar]
- 10.Schweda F, Klar J, Narumiya S, Nusing RM, Kurtz A. Stimulation of renin release by prostaglandin E2 is mediated by EP2 and EP4 receptors in mouse kidneys. Am J Physiol Renal Physiol. 2004;287:F427–433. doi: 10.1152/ajprenal.00072.2004. [DOI] [PubMed] [Google Scholar]
- 11.Jensen BL, Schmid C, Kurtz A. Prostaglandins stimulate renin secretion and renin mRNA in mouse renal juxtaglomerular cells. Am J Physiol. 1996;271:F659–669. doi: 10.1152/ajprenal.1996.271.3.F659. [DOI] [PubMed] [Google Scholar]
- 12.Jakobsson PJ, Thoren S, Morgenstern R, Samuelsson B. Identification of human prostaglandin E synthase: a microsomal, glutathione-dependent, inducible enzyme, constituting a potential novel drug target. Proc Natl Acad Sci U S A. 1999;96:7220–7225. doi: 10.1073/pnas.96.13.7220. [DOI] [PMC free article] [PubMed] [Google Scholar]
- 13.Murakami M, Nakashima K, Kamei D, Masuda S, Ishikawa Y, Ishii T, Ohmiya Y, Watanabe K, Kudo I. Cellular prostaglandin E2 production by membrane-bound prostaglandin E synthase-2 via both cyclooxygenases-1 and -2. J Biol Chem. 2003;278:37937–37947. doi: 10.1074/jbc.M305108200. [DOI] [PubMed] [Google Scholar]
- 14.Tanioka T, Nakatani Y, Semmyo N, Murakami M, Kudo I. Molecular identification of cytosolic prostaglandin E2 synthase that is functionally coupled with cyclooxygenase-1 in immediate prostaglandin E2 biosynthesis. J Biol Chem. 2000;275:32775–32782. doi: 10.1074/jbc.M003504200. [DOI] [PubMed] [Google Scholar]
- 15.Jania LA, Chandrasekharan S, Backlund MG, Foley NA, Snouwaert J, Wang IM, Clark P, Audoly LP, Koller BH. Microsomal prostaglandin E synthase-2 is not essential for in vivo prostaglandin E2 biosynthesis. Prostaglandins Other Lipid Mediat. 2009;88:73–81. doi: 10.1016/j.prostaglandins.2008.10.003. [DOI] [PMC free article] [PubMed] [Google Scholar]
- 16.Lovgren AK, Kovarova M, Koller BH. cPGES/p23 is required for glucocorticoid receptor function and embryonic growth but not prostaglandin E2 synthesis. Mol Cell Biol. 2007;27:4416–4430. doi: 10.1128/MCB.02314-06. [DOI] [PMC free article] [PubMed] [Google Scholar]
- 17.Trebino CE, Stock JL, Gibbons CP, Naiman BM, Wachtmann TS, Umland JP, Pandher K, Lapointe JM, Saha S, Roach ML, Carter D, Thomas NA, Durtschi BA, McNeish JD, Hambor JE, Jakobsson PJ, Carty TJ, Perez JR, Audoly LP. Impaired inflammatory and pain responses in mice lacking an inducible prostaglandin E synthase. Proc Natl Acad Sci U S A. 2003;100:9044–9049. doi: 10.1073/pnas.1332766100. [DOI] [PMC free article] [PubMed] [Google Scholar]
- 18.Engblom D, Saha S, Engstrom L, Westman M, Audoly LP, Jakobsson PJ, Blomqvist A. Microsomal prostaglandin E synthase-1 is the central switch during immune-induced pyresis. Nat Neurosci. 2003;6:1137–1138. doi: 10.1038/nn1137. [DOI] [PubMed] [Google Scholar]
- 19.Mancini JA, Blood K, Guay J, Gordon R, Claveau D, Chan CC, Riendeau D. Cloning, expression, and up-regulation of inducible rat prostaglandin e synthase during lipopolysaccharide-induced pyresis and adjuvant-induced arthritis. J Biol Chem. 2001;276:4469–4475. doi: 10.1074/jbc.M006865200. [DOI] [PubMed] [Google Scholar]
- 20.Wang M, Zukas AM, Hui Y, Ricciotti E, Pure E, FitzGerald GA. Deletion of microsomal prostaglandin E synthase-1 augments prostacyclin and retards atherogenesis. Proc Natl Acad Sci U S A. 2006;103:14507–14512. doi: 10.1073/pnas.0606586103. [DOI] [PMC free article] [PubMed] [Google Scholar]
- 21.Francois H, Facemire C, Kumar A, Audoly L, Koller B, Coffman T. Role of microsomal prostaglandin E synthase 1 in the kidney. J Am Soc Nephrol. 2007;18:1466–1475. doi: 10.1681/ASN.2006040343. [DOI] [PubMed] [Google Scholar]
- 22.Cheng Y, Wang M, Yu Y, Lawson J, Funk CD, Fitzgerald GA. Cyclooxygenases, microsomal prostaglandin E synthase-1, and cardiovascular function. J Clin Invest. 2006;116:1391–1399. doi: 10.1172/JCI27540. [DOI] [PMC free article] [PubMed] [Google Scholar]
- 23.Wang M, Lee E, Song W, Ricciotti E, Rader DJ, Lawson JA, Pure E, FitzGerald GA. Microsomal prostaglandin E synthase-1 deletion suppresses oxidative stress and angiotensin II-induced abdominal aortic aneurysm formation. Circulation. 2008;117:1302–1309. doi: 10.1161/CIRCULATIONAHA.107.731398. [DOI] [PubMed] [Google Scholar]
- 24.Jia Z, Zhang A, Zhang H, Dong Z, Yang T. Deletion of microsomal prostaglandin E synthase-1 increases sensitivity to salt loading and angiotensin II infusion. Circ Res. 2006;99:1243–1251. doi: 10.1161/01.RES.0000251306.40546.08. [DOI] [PubMed] [Google Scholar]
- 25.Jia Z, Guo X, Zhang H, Wang MH, Dong Z, Yang T. Microsomal prostaglandin synthase-1-derived prostaglandin E2 protects against angiotensin II-induced hypertension via inhibition of oxidative stress. Hypertension. 2008;52:952–959. doi: 10.1161/HYPERTENSIONAHA.108.111229. [DOI] [PubMed] [Google Scholar]
- 26.Gurley SB, Clare SE, Snow KP, Hu A, Meyer TW, Coffman TM. Impact of genetic background on nephropathy in diabetic mice. Am J Physiol Renal Physiol. 2006;290:F214–222. doi: 10.1152/ajprenal.00204.2005. [DOI] [PubMed] [Google Scholar]
- 27.Hartner A, Cordasic N, Klanke B, Veelken R, Hilgers KF. Strain differences in the development of hypertension and glomerular lesions induced by deoxycorticosterone acetate salt in mice. Nephrol Dial Transplant. 2003;18:1999–2004. doi: 10.1093/ndt/gfg299. [DOI] [PubMed] [Google Scholar]
- 28.Le TH, Fogo AB, Salzler HR, Vinogradova T, Oliverio MI, Marchuk DA, Coffman TM. Modifier locus on mouse chromosome 3 for renal vascular pathology in AT1A receptor-deficiency. Hypertension. 2004;43:445–451. doi: 10.1161/01.HYP.0000112423.28987.00. [DOI] [PubMed] [Google Scholar]
- 29.Crowley SD, Gurley SB, Oliverio MI, Pazmino AK, Griffiths R, Flannery PJ, Spurney RF, Kim HS, Smithies O, Le TH, Coffman TM. Distinct roles for the kidney and systemic tissues in blood pressure regulation by the renin-angiotensin system. J Clin Invest. 2005;115:1092–1099. doi: 10.1172/JCI200523378. [DOI] [PMC free article] [PubMed] [Google Scholar]
- 30.Crowley SD, Gurley SB, Herrera MJ, Ruiz P, Griffiths R, Kumar AP, Kim HS, Smithies O, Le TH, Coffman TM. Angiotensin II causes hypertension and cardiac hypertrophy through its receptors in the kidney. Proc Natl Acad Sci U S A. 2006;103:17985–17990. doi: 10.1073/pnas.0605545103. [DOI] [PMC free article] [PubMed] [Google Scholar]
- 31.Facemire CS, Nixon AB, Griffiths R, Hurwitz H, Coffman TM. Vascular endothelial growth factor receptor 2 controls blood pressure by regulating nitric oxide synthase expression. Hypertension. 2009;54:652–658. doi: 10.1161/HYPERTENSIONAHA.109.129973. [DOI] [PMC free article] [PubMed] [Google Scholar]
- 32.Kim HS, Lee G, John SW, Maeda N, Smithies O. Molecular phenotyping for analyzing subtle genetic effects in mice: application to an angiotensinogen gene titration. Proc Natl Acad Sci U S A. 2002;99:4602–4607. doi: 10.1073/pnas.072083799. [DOI] [PMC free article] [PubMed] [Google Scholar]
- 33.Francois H, Coffman TM. Prostanoids and blood pressure: which way is up? J Clin Invest. 2004;114:757–759. doi: 10.1172/JCI22929. [DOI] [PMC free article] [PubMed] [Google Scholar]
- 34.Francois H, Athirakul K, Mao L, Rockman H, Coffman TM. Role for thromboxane receptors in angiotensin-II-induced hypertension. Hypertension. 2004;43:364–369. doi: 10.1161/01.HYP.0000112225.27560.24. [DOI] [PubMed] [Google Scholar]
- 35.Mistry M, Nasjletti A. Role of pressor prostanoids in rats with angiotensin II-salt-induced hypertension. Hypertension. 1988;11:758–762. doi: 10.1161/01.hyp.11.6.758. [DOI] [PubMed] [Google Scholar]
- 36.Wilcox CS, Welch WJ. Thromboxane mediation of the pressor response to infused angiotensin II. Am J Hypertens. 1990;3:242–249. doi: 10.1093/ajh/3.3.242. [DOI] [PubMed] [Google Scholar]
- 37.Lee JB, Patak RV, Mookerjee BK. Renal prostaglandins and the regulation of blood pressure and sodium and water homeostasis. Am J Med. 1976;60:798–816. doi: 10.1016/0002-9343(76)90893-7. [DOI] [PubMed] [Google Scholar]
- 38.Audoly LP, Tilley SL, Goulet J, Key M, Nguyen M, Stock JL, McNeish JD, Koller BH, Coffman TM. Identification of specific EP receptors responsible for the hemodynamic effects of PGE2. Am J Physiol. 1999;277:H924–930. doi: 10.1152/ajpheart.1999.277.3.H924. [DOI] [PubMed] [Google Scholar]
- 39.Pallone TL. Vasoconstriction of outer medullary vasa recta by angiotensin II is modulated by prostaglandin E2. Am J Physiol. 1994;266:F850–857. doi: 10.1152/ajprenal.1994.266.6.F850. [DOI] [PubMed] [Google Scholar]
- 40.Roman RJ, Lianos E. Influence of prostaglandins on papillary blood flow and pressure-natriuretic response. Hypertension. 1990;15:29–35. doi: 10.1161/01.hyp.15.1.29. [DOI] [PubMed] [Google Scholar]
- 41.Jackson BA. Prostaglandin E2 synthesis in the inner medullary collecting duct of the rat: implications for vasopressin-dependent cyclic AMP formation. J Cell Physiol. 1986;129:60–64. doi: 10.1002/jcp.1041290109. [DOI] [PubMed] [Google Scholar]
- 42.Schlondorff D. Renal prostaglandin synthesis. Sites of production and specific actions of prostaglandins. Am J Med. 1986;81:1–11. doi: 10.1016/0002-9343(86)90903-4. [DOI] [PubMed] [Google Scholar]
- 43.Yang T, Huang YG, Ye W, Hansen P, Schnermann JB, Briggs JP. Influence of genetic background and gender on hypertension and renal failure in COX-2-deficient mice. Am J Physiol Renal Physiol. 2005;288:F1125–1132. doi: 10.1152/ajprenal.00219.2004. [DOI] [PubMed] [Google Scholar]
- 44.Gurley SB, Allred A, Le TH, Griffiths R, Mao L, Philip N, Haystead TA, Donoghue M, Breitbart RE, Acton SL, Rockman HA, Coffman TM. Altered blood pressure responses and normal cardiac phenotype in ACE2-null mice. J Clin Invest. 2006;116:2218–2225. doi: 10.1172/JCI16980. [DOI] [PMC free article] [PubMed] [Google Scholar]
- 45.Chatziantoniou C, Arendshorst WJ. Renal vascular reactivity to vasodilator prostaglandins in genetically hypertensive rats. Am J Physiol. 1992;262:F124–130. doi: 10.1152/ajprenal.1992.262.1.F124. [DOI] [PubMed] [Google Scholar]
- 46.Stock JL, Shinjo K, Burkhardt J, Roach M, Taniguchi K, Ishikawa T, Kim HS, Flannery PJ, Coffman TM, McNeish JD, Audoly LP. The prostaglandin E2 EP1 receptor mediates pain perception and regulates blood pressure. J Clin Invest. 2001;107:325–331. doi: 10.1172/JCI6749. [DOI] [PMC free article] [PubMed] [Google Scholar]
- 47.Ushikubi F, Segi E, Sugimoto Y, Murata T, Matsuoka T, Kobayashi T, Hizaki H, Tuboi K, Katsuyama M, Ichikawa A, Tanaka T, Yoshida N, Narumiya S. Impaired febrile response in mice lacking the prostaglandin E receptor subtype EP3. Nature. 1998;395:281–284. doi: 10.1038/26233. [DOI] [PubMed] [Google Scholar]


