

Abstract
Purpose
To date, no study has examined the synergistic effects of a nutrition and combination of aerobic and strength training (CAST) on both adiposity and metabolic parameters in overweight Latina adolescent females. The goal was to assess if a 16-wk nutrition plus CAST pilot study had stronger effects on reducing adiposity and on improving glucose/insulin indices compared with control (C), nutrition only (N), and a nutrition plus strength training (N + ST) groups.
Methods
In a 16-wk randomized trial, 41 overweight Latina girls (15.2 ± 1.1 yr) were randomly assigned to C (n = 7), N (n = 10), N + ST (n = 9), or N + CAST (n = 15). All intervention groups received modified carbohydrate nutrition classes (once a week), whereas the N + ST also received strength training (twice a week) and the N + CAST received a combination of strength and aerobic training (twice a week). The following were measured before and after intervention: strength by one repetition maximum, physical activity by the 7-d accelerometry and the 3-d physical activity recall, dietary intake by 3-d records, body composition by dual-energy x-ray absorptiometry (DEXA), glucose/insulin indices by oral glucose tolerance test, and intravenous glucose tolerance test with minimal modeling. Across intervention group, effects were tested using ANCOVA with post hoc pairwise comparisons.
Results
There were significant overall intervention effects for all adiposity measures (weight, body mass index [BMI], BMI z-scores, and DEXA total body fat), with a decrease of 3% in the N + CAST group compared with a 3% increase in the N + ST group (P ≤ 0.05). There was also an intervention effect for fasting glucose with the N group increasing by 3% and the N + CAST group decreasing by 4% (P ≤ 0.05).
Conclusion
The CAST was more effective than nutrition alone or nutrition plus strength training for reducing multiple adiposity outcomes and fasting glucose in overweight Latina girls. However, further research investigating and identifying intervention approaches that improve both adiposity and insulin indices, particularly in high-risk populations, are warranted.
Keywords: EXERCISE, NUTRITION, INTERVENTION, OVERWEIGHT, TEENAGERS
Latino youth are more likely to be overweight than Caucasian children, and this effect is even more pronounced in females, with 20% of Mexican American teen girls being overweight (≥95th percentile according to the Centers for Disease Control and Prevention [CDC]) compared with 14.5% of Caucasian children being overweight (30). In the Latino population, the increase in pediatric overweight has been closely paralleled by increasing risk for metabolic diseases such as type 2 diabetes, fatty liver disease, and metabolic syndrome (33). Latino children are more likely to be insulin resistant than their Caucasian counterparts, independent of adiposity (13). Our group has shown that over 30% of overweight Latino children from a convenience sample in the Los Angeles area have prediabetes (14,39) and metabolic syndrome (5). To date, there have been few randomized trials to address the underlying metabolic abnormalities, specifically insulin secretion and resistance, in overweight Latino youth (2,34).
In adults, increased aerobic activity has been linked to improved insulin sensitivity and decreased risk of type 2 diabetes (12,19,22), but the effects of physical activity on risk of type 2 diabetes and insulin action are less clear in children. Ferguson et al. (11) showed that an intensive aerobic training program (5 d·wk−1 for 4 months; 40-min training sessions) in obese children led to only small improvements in fasting insulin, plasma triglyceride, and percent body fat, but insulin resistance was not measured. Similarly, Gutin et al. (15) showed that an intensive 8-month physical activity intervention (5 d·wk−1) resulted in significant improvements in cardiovascular fitness, visceral fat, total body composition, lipid profiles, and blood pressure compared with a lifestyle education intervention group, but no significant improvements in fasting glucose or insulin were found (15,21). These studies suggest that highly intense aerobic training programs result in improvements in body composition, physical activity, and lipids but have minimal impact on direct measures of insulin resistance. Other physical activity approaches targeting the reduction of insulin resistance and type 2 diabetes risk factors in children should be explored.
We previously showed that a 16-wk strength training feasibility study significantly improved insulin sensitivity by 45% in overweight Latino adolescent males, independent of changes in body composition (34). We also recently showed that in a 12-wk, modified carbohydrate nutrition education pilot conducted with overweight Latina girls, there were significant reductions in body mass index (BMI) z-scores, and those girls with the greatest reductions in added sugar intake had the greatest reductions in insulin secretion (7,8). Therefore, strength training combined with a modified carbohydrate nutrition intervention has the potential to reduce type 2 diabetes risks factors in overweight Latino youth.
Although strength training was effective for improving insulin sensitivity in our pilot study, it did not have an effect on improving body composition (34). Previous studies in adults have shown that the combination of aerobic and strength training (CAST), sometimes called circuit training, results in significant improvements in body composition, strength, cardiovascular fitness (20,23,26), and insulin sensitivity (9). However, only a few studies have assessed the effects of CAST on both adiposity and metabolic parameters in an overweight adolescent population (2,38), and none have been tested in an overweight Latino population. Thus, the purpose of this pilot study was to test whether adding an aerobic component to a strength training intervention would have beneficial effects on both adiposity and metabolic parameters in overweight Latina female adolescents. We hypothesized that the N + CAST group would have the greatest reductions in adiposity and improvements in glucose and insulin indices compared with the control, nutrition only, and nutrition plus strength training intervention groups.
REASEARCH DESIGN AND METHODS
Participants
This pilot study was conducted only in girls and was designed to supplement a larger randomized control trial that has recently been reported (6). The main trial was conducted over two waves of females. In the first wave, females were randomized to one of three intervention groups (i.e., C, N, or N + ST), whereas females in the second wave were randomized to one of four intervention groups (i.e., C, N, N + ST, or N + CAST). Participants were oversampled in the N + CAST group to account for the supplemental arm only being run in one of the waves. For the current article, data from the N + CAST group will be compared with the data from the C, N, and N + ST groups from both female waves. Fifty female participants were randomized to one of three (first wave) or four groups (second wave). Out of the 50 participants, only 41 completed the study (i.e., evaluable subjects). Siblings (three pairs) were randomized into the same experimental group (two in N and one in N + CAST), and data from both siblings were used. Study participants met the following inclusion criteria: age- and gender-specific BMI ≥85th percentile (CDC, 2000), Latino ethnicity (i.e., parents and grandparents of Latino descent by parental self-report), and attending grades 9 through 12 (approximately 14–18 yr). Participants were excluded based on the following criteria: 1) diagnosed with any disease or using medication that could influence dietary intake, exercise ability, body composition, or insulin indices; 2) previously diagnosed with any major illness since birth; 3) had any diagnostic criteria for diabetes; or 4) participated in structured exercise, nutrition, or weight loss program in the past 6 months. Before any testing procedure, informed written consent from parents and assent from the children were obtained. The institutional review board of the University of Southern California, Health Sciences Campus, approved this study.
Description of Interventions
Control group (C)
Participants randomized to the C group received no intervention over the 16 wk between pre- and postintervention data collection. After posttesting, participants were offered an abbreviated 1-month delayed intervention, consisting of biweekly nutrition and strength training classes. No testing was done after the abbreviated delayed intervention.
Nutrition education only (N)
Participants in the N group received a 16-wk culturally tailored dietary intervention one time per week for approximately 90 min at our Veronica Atkins Lifestyle Intervention Laboratory (VALIL). This dietary intervention was modified from a pilot study, and specifics are described in detail elsewhere (7,8). In brief, the dietary intervention targeted two goals: 1) ≤10% of total daily calorie intake from added sugar and 2) consuming at least 14 g·1000 kcal−1 of dietary fiber a day. Participants received four individual motivational interviewing (MI) sessions throughout the 16-wk program by trained research staff. MI is a client-centered counseling approach designed to enhance intrinsic motivation for behavior change by creating, exploring, and resolving ambivalence toward changing behaviors and habits (27). Specifically, the individual MI sessions were used to enhance intrinsic motivation to eat healthy.
Nutrition education plus strength training (N + ST)
In addition to the nutrition education class described above, participants in the N + ST group also received strength training two times per week for approximately 60 min per session for 16 wk at VALIL. Training sessions took place on two nonconsecutive days per week, and the nutrition education took place once per week preceding one of the exercise sessions. The exercise program has been explained in detail elsewhere (34). In brief, the program was personalized and progressive such that the resistance increased as the participant’s technique and strength improved. A 3:1 child–trainer ratio was used. In addition, the N + ST received four individual and four group MI sessions by trained research staff to enhance intrinsic motivation for healthy eating and increased physical activity.
Nutrition education plus combination of aerobic and strength training (N + CAST)
Participants in the N + CAST received the same nutrition education class described above and also received combined exercise training two times per week for approximately 60 min per session for 16 wk at VALIL. The CAST sessions were held on two nonconsecutive days per week and included 30 min total of cardiovascular activity (e.g., treadmill, elliptical machines, and aerobic classes) coupled with 30 min total of strength training. Participants would complete two different strength training exercises (upper- and lower-body exercise were paired together), each 1-min without stopping or rest, followed by 2 min of cardiovascular exercises. The CAST program was personalized and progressive such that the intensity and the resistance of the cardiovascular and strength training exercises were increased as the participant’s fitness and strength improved. This group also received four individual and four group MI sessions to enhance intrinsic motivation for healthy eating and increased physical activity.
Outpatient Testing Visit
Participants from all four intervention groups arrived at the General Clinical Research Center (GCRC) at ~7:30 a.m. after an overnight fast. A licensed pediatric health care provider conducted a detailed medical history examination and determined Tanner staging using established guidelines (24,25). After the examination, a 3-h oral glucose tolerance test (OGTT) was conducted. To minimize discomfort, a topical anesthetic to one arm and approximately 30 min later a flexible intravenous catheter was placed in an antecubital vein. Subjects then ingested 1.75 g oral glucose solution·kg−1 body weight (to a maximum 75 g). Blood samples were drawn at baseline and every 10 min for 3 h (a total of 18 samples) and assayed for glucose and insulin. Fasting and 2-h glucose levels were used to determine normal or impaired glucose tolerance as defined by the American Diabetes Association (1). Three-hour insulin area under the curve and insulin incremental area under the curve (IAUC) were calculated from the OGTT data (nmol·L−1·min−1). Although the participants were undergoing clinical testing, the parents of participants were asked their educational level and occupation. The socioeconomic status (SES) was determined from this information using the Hollingshead (17) index.
Anthropometry and Body Composition
Weight and height were measured to the nearest 0.1 kg and 0.1 cm, respectively, using a beam medical scale and wall-mounted stadiometer. BMI and BMI percentiles were deter-mined (CDC, 2000). Whole-body fat and lean tissue mass were measured by dual-energy x-ray absorptiometry (DEXA) using a Hologic QDR 4500W (Hologic, Bedford, MA).
In-Patient Testing Visit
Participants returned to the GCRC approximately 7 to 14 d later for an overnight visit. An insulin-modified frequently sampled intravenous glucose tolerance test (FSIVGTT) was performed the following morning. At time 0, glucose (25% dextrose, 0.3 g·kg−1 body weight) was administered intravenously. Blood samples were collected at time points −15, −5, 2, 4, 8, 19, 22, 30, 40, 50, 70, 100, and 180 min. Insulin (0.02 U·kg−1 body weight, Humulin R [regular insulin for human injection]; Eli Lilly, Indianapolis, IN) was injected intravenously at 20 min. Plasma collected during the FSIVGTT was analyzed for glucose and insulin, and values were entered into the MINMOD Millenium 2003 computer program (version 5.16, Bergman, USC) to determine insulin sensitivity, acute insulin response, and disposition index (an index of β cell function).
Assays
Fasting and 2-h samples taken during the OGTT for clinical diagnosis were separated for plasma and immediately transported on ice to the Los Angeles County-USC Medical Center Core Laboratory, where glucose was analyzed on a Dimension clinical chemistry system using an in vitro hexokinase method (Dade Behring, Deerfield, IL). Blood samples from all time points taken during the OGTT and the FSIVGTT were centrifuged immediately for 10 min at 2500 rpm and 8–10°C to obtain plasma, and aliquots were frozen at −70°C until assayed. Glucose was assayed in duplicate on a Yellow Springs Instrument 2700 Analyzer (Yellow Springs Instrument, Yellow Springs, OH) using the glucose oxidase method. Insulin was assayed in duplicate using a specific human insulin enzyme-linked immunosorbent assay kit from Linco (St. Charles, MO).
Strength Assessment, Accelerometry, and Dietary Intake
Upper- and lower-body strength were assessed by one repetition maximum in the bench press and leg press, respectively, using established procedures (10).
To assess habitual physical activity, subjects were instructed to wear the ActiGraph accelerometer (models 7164 and GT1M; Computer Science and Application, Shalimar FL) for 7 d. The accelerometers were set to monitor activity in 15-s epochs. Accelerometry data downloaded from the ActiGraph devices were reduced using an adapted version of the SAS code used to reduce the accelerometry data in the 2003–2004 National Health and Nutrition Examination Survey (NHANES) (29). Because the adolescents in the current study had an average weight of 86 kg, the intensity thresholds used for adults and older adolescents in NHANES were used to designate moderate plus vigorous intensities (36). Days with less than 6 h of wear data and participants with at least two or more days of measurement at pre- and posttesting were included in the analysis for this study as previously described (3).
The 3-d physical activity recall (3DPAR), which previous studies have shown to be valid and reliable (32,37), was used to augment the accelerometer data and to provide contextual information regarding types of physical activities performed. The 3DPAR form consists of three grids (one for each day) divided into 30-min blocks, where participants chose and record the predominant activity and intensity level (light, moderate, hard, or very hard) that they performed during each block of time.
At the outpatient visit, participants were given 3-d diet records to complete at home and were instructed to bring them to their next GCRC visit. At the inpatient visit, research staff clarified all dietary records. Nutrition data were analyzed using the Nutrition Data System for Research (version 5.0_35).
Statistical Considerations
Sample size considerations
Sample size cal-culations were based on results from our prior strength training pilot study (10). Using a conservative estimate of the SD of the insulin sensitivity change score, a sample size of 60 (15 per group) had 0.80 power to detect a meaningful difference ≥0.57 U in mean change in insulin sensitivity between the C and the N + ST groups. Nevertheless, this is pilot feasibility study and will provide preliminary data needed to power a much larger intervention study.
Statistical analyses
Across-group comparisons of baseline, physical and metabolic characteristics were conducted for evaluable participants using ANOVA to identify possible randomization imbalance.
The overall effects of the interventions were tested for evaluable participants using ANCOVA before and after the change score, after controlling for preplanned covariates. Change scores were evaluated for normality, and the following variables were log transformed: bench and leg press, weight, BMI, BMI percentile, DEXA fat mass, and all glucose/insulin indices except fasting glucose. The following a priori covariates were included: Tanner stage (in all models) and baseline value of the dependent variable. Sibling pairs was also evaluated in all models and included only when significant (i.e., leg press and added sugar). Before as well as before and after change score body composition measures, that is, total fat mass and total lean tissue mass, were evaluated as covariates in each of the glucose/insulin indices model and included only when significant. Changes in strength, dietary, and physical activity levels were also evaluated as covariates in all the adiposity and metabolic models and included only when significant (i.e., change in total sugar was included in the change in the weight model and change in bench press in the BMI and the BMI z-score models). When significant differences across groups were identified, post hoc pairwise comparisons with Bonferroni adjustments were conducted. All analyses were performed using the Statistical Package for the Social Sciences version 11.0 (SPSS Inc., Chicago, IL), with significance level set at P < 0.05.
RESULTS
Fifty qualified subjects were randomized to one the intervention groups. Of these, 41 completed the program (evaluable participants), 7 in the C group, 10 in the N group, 9 in the N + ST group, and 15 in the N + CAST group. There were no statistically significant differences in any of the baseline variables (i.e., strength, accelerometry, diet, anthropometrics, body composition measures, or glucose and insulin indices) between participants who did or did not complete the program.
All participants were female, with a mean age of 15.2 ± 1.1 yr, and had a Tanner stage of either 4 or 5. Seventy-five percent of these participants are classified as having either a lower–middle or lower SES. Eighty-three percent classified themselves as being Mexican American. There were no significant differences across the intervention groups in any of the baseline variables for the evaluable participants (all P values >0.21). Baseline variables for each group are presented in Table 1.
TABLE 1.
| C (n = 7) | N (n = 10) | N + ST (n = 9) | N + CAST (n = 15) | |
|---|---|---|---|---|
| Age (yr) | 15.1 (1.1) | 15.3 (1.1) | 15.7 (1.2) | 14.8 (1.0) |
| Tanner stage 4 or 5 | 2 / 5 | 2 / 8 | 2 / 7 | 7 / 8 |
| SES (n) | ||||
| Lower | 4 | 5 | 4 | 2 |
| Lower–middle | 3 | 3 | 2 | 5 |
| Middle | 0 | 2 | 2 | 2 |
| Upper–middle | 0 | 0 | 1 | 1 |
| Heritage (n) | ||||
| Mexican | 6 | 10 | 6 | 12 |
| Central American | 1 | 0 | 2 | 3 |
| South American | 0 | 0 | 1 | 0 |
| Strength | ||||
| Bench press (lb) | 71.4 (6.3) | 80.5 (20.9) | 73.3 (16.0) | 69.3 (14.0) |
| Leg press (lb) | 387.1 (100.8) | 355.6 (121.8) | 344.4 (123.5) | 273.7 (91.2) |
| Accelerometry | ||||
| Total counts (counts·min−1·d−1) | 322.5 (110.1) | 300.8 (78.8) | 351.6 (113.0) | 304.6 (96.5) |
| Light activity (% time·d−1) | 96.3 (1.1) | 96.5 (1.7) | 95.0 (2.9) | 96.2 (2.0) |
| MVPA (% time·d−1) | 3.7 (1.1) | 3.6 (1.7) | 5.0 (2.9) | 3.8 (2.0) |
| 3DPAR | ||||
| Light PA (% time·d−1) | 91.9 (4.8) | 86.0 (13.7) | 91.6 (5.0) | 91.2 (9.8) |
| MVPA (% time·d−1) | 8.1 (4.8) | 14.0 (13.7) | 8.4 (4.9) | 8.8 (9.8) |
| Dietary | ||||
| Energy (kcal·d−1) | 1429.6 (352.5) | 1549.9 (564.5) | 1823.9 (532.3) | 1755.1 (769.7) |
| Carbohydrate (g·d−1) | 216.8 (75.1) | 207.7 (88.8) | 237.0 (72.7) | 226.2 (92.7) |
| Protein (g·d−1) | 48.1 (18.8) | 65.2 (22.2) | 71.1 (19.2) | 69.2 (27.5) |
| Fat (g·d−1) | 43.9 (8.8) | 52.8 (18.4) | 68.7 (29.4) | 66.0 (37.5) |
| Total sugar (g·d−1) | 99.9 (44.2) | 80.0 (38.1) | 113.0 (43.2) | 96.4 (46.8) |
| Added sugar (g·d−1) | 64.2 (38.1) | 53.6 (38.6) | 64.1 (36.6) | 58.2 (37.7) |
| Fiber (g·d−1) | 12.8 (6.0) | 15.5 (9.0) | 16.2 (3.5) | 13.9 (6.3) |
| Body composition | ||||
| Weight (kg) | 90.0 (22.9) | 85.9 (19.6) | 84.5 (21.4) | 85.7 (19.1) |
| BMI (kg·m−2) | 34.6 (7.4) | 33.8 (5.7) | 32.8 (7.9) | 33.6 (6.9) |
| BMI z-score | 2.0 (0.6) | 2.0 (0.4) | 1.9 (0.6) | 2.1 (0.4) |
| BMI percentile | 96.2 (5.5 | 96.9 (3.6) | 95.0 (4.3) | 97.3 (2.3) |
| Total fat mass (kg) | 36.5 (14.1) | 34.9 (9.0) | 34.5 (13.1) | 35.7 (11.6) |
| Total lean mass (kg) | 49.7 (8.8) | 48.9 (9.7) | 47.9 (7.6) | 47.6 (6.7) |
| OGTT (3 h) | ||||
| Fasting glucose (mg·dL−1) | 91.3 (5.3) | 89.5 (6.0) | 87.9 (7.2) | 91.2 (8.3) |
| 2-h glucose (mg·dL−1) | 124.4 (31.4) | 135.3 (17.5) | 135.8 (37.7) | 125.1 (19.5) |
| Fasting insulin (μU·mL−1) | 27.0 (9.6) | 23.5 (11.5) | 29.1 (10.2) | 29.1 (10.2) |
| 2-h insulin (μU·mL−1) | 154.8 (94.3) | 251.3 (188.0) | 187.0 (112.3) | 187.0 (112.3) |
| Glucose IAUC (mmol·min−1·L−1) | 90.3 (64.6) | 128.3 (34.7) | 125.6 (59.0) | 125.6 (59.0 ) |
| Insulin IAUC (pmol·min−1·L−1) | 341.8 (157.5) | 488.5 (340.3) | 401.8 (220.4) | 401.8 (220.4) |
| FSIVGTT | ||||
| SI (×10−4·min−1·μU−1·mL−1) | 1.7 (0.9) | 1.5 (0.7) | 1.7 (1.0) | 1.4 (0.8) |
| AIR (μU·mL−1 × 10 min) | 1238.5 (526.3) | 1006.7 (910.6) | 1374.1 (666.7) | 1475.6 (494.6) |
| DI (×10−4·min−1) | 1483.3 (891.3) | 1099.0 (574.1) | 1975.0 (777.0) | 1822.5 (768.8) |
Data are presented as mean (SD). Sample sizes for diet and accelerometry are as follows: diet (n = 39) and accelerometry (n = 28).
There were no significant differences across the intervention groups in any of the baseline variables for the evaluable participants (all P values >0.21).
C, control; N, nutrition only; N + ST, nutrition + strength training; N + CAST, nutrition + combination of aerobic and strength training; MVPA, moderate to vigorous physical activity; 3DPAR, 3-d physical activity recall; total PA, total physical activity; light PA, light physical activity; OGTT, oral glucose tolerance test; IAUC, incremental area under the curve; FSIVGTT, frequently sampled intravenous glucose tolerance test; SI, insulin sensitivity; AIR, acute insulin response; and DI, disposition index.
Strength, accelerometry, and dietary variables
Table 2 presents the adjusted changes in strength, accelerometry, and dietary outcomes for the evaluable participants stratified by intervention group. There was a significant across-group effect for bench press (P ≤ 0.001). Post hoc comparisons showed that the N + ST increased more than the N and N + CAST groups (36.7% ± 28.1% vs 0.4% ± 14.7% and 2.5% ± 23.9%; P ≤ 0.001). There was also a significant across-group effect for leg press (P = 0.03), where the N + ST group increased more compared with the C group (28.9% ± 25.2% vs −2.2% ± 1.6%; P = 0.04), and there was a trend for the N + CAST group to increase (24.0% ± 23.8%) compared with the C group (P = 0.09).
TABLE 2.
Changes in strength and dietary outcomes: across-group effects for evaluable participants (n = 41).
| Outcomesa | C (n = 7) | N (n = 10) | N + ST (n = 9) | N + CAST (n = 15) | P Valueb |
|---|---|---|---|---|---|
| Strength | |||||
| Bench press (lb) | 8.6 (6.3) | −1.70 (12.0)c | 27.5 (18.3)d | 1.0 (11.7)c | <0.001 |
| Leg press (lb) | −10.0 (65.7)eh | 43.8 (63.2) | 126.9 (129.3)f | 49.7 (58.3)g | 0.030 |
| Accelerometry | |||||
| Total counts (min·d−1) | 32.9 (96.5) | 65.9 (143.1) | 37.8 (215.9) | −23.9 (89.5) | 0.574 |
| Light activity (% time·d−1) | 0.2 (3.3) | −0.1 (4.3) | −2.0 (12.8) | 2.1 (5.7) | 0.076 |
| MVPA (% time·d−1) | 1.1 (1.5) | 2.0 (3.0) | 0.9 (5.9) | −0.2 (2.4) | 0.559 |
| 3DPAR | |||||
| Light PA (% time·d−1) | −8.4 (1.1) | −4.3 (7.7) | −9.9 (16.5) | −3.1 (9.8) | 0.483 |
| MVPA (% time·d−1) | 8.4 (1.1) | 4.3 (7.7) | 9.9 (16.5) | 3.1 (9.8) | 0.483 |
| Dietary | |||||
| Energy (kcal·d−1) | 285.2 (585.7)g | −210.4 (460.4) | −341.6 (354.5)h | −86.4 (626.6) | 0.078 |
| Carbohydrate (g·d−1) | 38.3 (104.2)g | −31.8 (76.8)h | −42.7 (84.4) | 6.8 (69.4) | 0.077 |
| Protein (g·d−1) | 10.0 (12.3) | −5.7 (15.4) | −6.8 (12.4) | −5.2 (24.0) | 0.607 |
| Fat (g·d−1) | 10.7 (18.6) | −6.0 (20.6) | −15.4 (13.8) | −8.8 (39.0) | 0.379 |
| Total sugar (g·d−1) | 1.4 (37.9)e | −18.8 (27.1) | −14.8 (45.5) | −45.5 (27.9)f | 0.019 |
| Added sugar (g·d−1) | 5.3 (28.3)c | −29.7 (37.2)d | −14.5 (38.6) | 1.4 (43.5)c | 0.005 |
| Fiber (g·d−1) | 4.2 (9.0) | 1.7 (11.3) | −1.0 (11.2) | 4.6 (9.2) | 0.794 |
Sample sizes for dietary variables are as follows: C (n = 6); N (n = 10); N + ST (n = 7); and N + CSAT (n = 15).
Sample sizes for accelerometer variables are as follows: C (n = 4); N (n = 10); N + ST (n = 5); and N + CSAT (n = 9).
Data are adjusted change scores; mean (SD).
P values were calculated using ANCOVA. Covariates included Tanner, baseline value of the dependent variable, and sibling pairs (for leg press and added sugar because significant in the model). Dietary variables included calories not attributed to nutrient-dependent variable as a covariate. Analyses were based on log scores for the following variables: bench and leg press.
Means with different letters (c and d) across intervention groups are significantly different from one another using Bonferroni multiple comparisons (P ≤ 0.01).
Means with different letters (c and d) across intervention groups are significantly different from one another using Bonferroni multiple comparisons (P ≤ 0.01).
Means with different letters (e and f) across intervention groups are significantly different from one another using Bonferroni multiple comparisons (P ≤ 0.05).
Means with different letters (e and f) across intervention groups are significantly different from one another using Bonferroni multiple comparisons (P ≤ 0.05).
Means with different letters (g and h) show a trend across intervention groups using Bonferroni multiple comparisons (P ≤ 0.10).
Means with different letters (g and h) show a trend across intervention groups using Bonferroni multiple comparisons (P ≤ 0.10).
C, control; N, nutrition only; N + ST, nutrition + strength training; and N + CAST, nutrition + combination of aerobic and strength training; MVPA, moderate to vigorous physical activity; 3DPAR, 3-d physical activity recall; and light PA, light physical activity.
Only 28 participants [C (n = 4), N (n = 10), N + ST(n = 5), N + CAST (n = 9)] had valid accelerometry data, that is, at least six or more hours a day for at least 2 d (3). There were no significant differences in baseline anthropometrics or body composition between those that did and did not have valid accelerometry data. These 28 participants wore the accelerometers for 12.7 ± 1.5 h for 6.4 ± 2.2 d at baseline and 12.1 ± 1.8 h for 5.2 ± 3.8 d after the intervention. At baseline, participants spent 729.7 ± 88.3 min·d−1 (or approximately 12 h) in light physical activity, including sedentary time, and only 29.5 ± 15.3 min·d−1 (or 0.5 h·d−1) in moderate plus physical activity. There were no significant across-group effects for any changes in accelerometer variables, including minutes, counts, or percent time spent in different intensity levels per day.
There were also no significant across-group effects for any baseline or changes in physical activity levels as measured by the 3DPAR (P ≥ 0.20), including types of activities performed, daily total physical activity energy expenditure, daily METs, daily energy expenditure (kcal·d−1), METs spent in different intensity levels (i.e., light, moderate, and vigorous physical activity), energy expenditure in different intensity levels, or percent of time (min·d−1) spent in different intensity levels. Only the percent of time per day spent in light and MVPA is reported in Tables 1 and 2, to be comparable to the accelerometer data.
Only 38 participants had valid before and after dietary data; C (n = 6), N (n = 10), N + ST (n = 7), and N + CSAT (n = 15). Two participants who did not have pretesting diet records that were accurately clarified and one participant who reported very low intake (<200 kcal·d−1) on two pretesting diet records were thus excluded from the analyses. There were significant across-group effects for changes in total and added sugar intake (P = 0.02 and P = 0.005). Post hoc comparisons showed that the N + CAST group decreased total sugar (g·d−1) by 45.7% ± 23.8% compared with a 4.9% ± 47.9% increase in the C group (P = 0.02). Post hoc comparisons found that the N group decreased added sugar (g·d−1) by 38.7% ± 50.3% compared with a 14.9% ± 49.2% increase in the C group (P = 0.005) and a 44.7% ± 24.3% increase in the N + CAST group (P = 0.04). There was a trend for a significant group effect for energy (P = 0.08), with the N + ST group decreasing by 22.7% ± 21.2% compared with a 20.1% ± 38.0% increase in the C group. There was also a trend for a significant group effect for carbohydrate intake (g·d−1), with the N group decreasing by 13.3% ± 30.2% compared with an 18.6% ± 44.3% increase seen in the C group. There were no significant across-group effects for changes in dietary fat, protein, or dietary fiber intake per day.
Anthropometric and body composition
For the anthropometric and body composition (DEXA) data, across-group effects are presented in Table 3. There were significant across-group effect for changes in body weight (kg), BMI, BMI z-score, and total fat mass (kg). Post hoc comparisons showed that the N + CAST decreased in weight compared with an increase in weight in the N + ST group (−1.1% ± 2.8% vs 2.6% ± 2.7%; P ≤ 0.01). The N + CAST and the C groups both decreased in BMI compared with an increase in the N + ST group (−1.6% ± 3.0% and −1.6% ± 1.6% vs 3.0% ± 2.3%; P ≤ 0.01). The N + CAST group decreased in BMI z-scores compared with an increase in the N + ST group (−2.8% ± 5.7% vs 4.9% ± 6.2%; P = 0.002). The N + CAST group decreased in total fat mass compared with an increase in the N + ST group (−4.3% ± 4.2% vs 1.8% ± 9.9%; P = 0.045; Fig. 1). There was a trend for a significant across-group effect for changes in BMI percentile, with a decrease in the N + CAST group compared with an increase in the N + ST group (−0.5% ± 1.4% vs 0.8% ± 1.3%; P = 0.09). There were no significant across-group effects for change in lean mass.
TABLE 3.
Changes in anthropometric and body composition (DEXA): across-group effects for evaluable participants (n = 41).
| Outcomesa | C (n = 7) | N (n = 10) | N + ST (n = 9) | N + CAST (n = 15) | P valueb |
|---|---|---|---|---|---|
| Weight (kg) | −0.3 (1.5) | 0.3 (1.6) | 2.4 (1.8)c | −0.8 (2.1)d | 0.004 |
| BMI (kg·m−2) | −0.5 (0.5)c | 0.3 (1.2) | 1.1 (0.6)d | −0.5 (0.9)c | 0.001 |
| BMI z-score | 0.00 (0.08) | 0.02 (0.09) | 0.08 (0.08)c | −0.05 (0.09)d | 0.003 |
| BMI percentile | −0.2 (0.2) | −0.1 (1.1) | 0.8 (1.2)g | −0.5 (1.3)h | 0.094 |
| DEXA total fat mass (kg) | 0.4 (1.3) | −0.1 (2.1) | 0.6 (2.5)e | −1.4 (1.3)f | 0.045 |
| DEXA total lean mass (kg) | 0.2 (1.3) | 0.1 (1.5) | 1.4 (1.9) | 0.8 (1.7) | 0.353 |
Data are adjusted change scores; mean (SD).
P values were calculated using ANCOVA. Covariates included Tanner, baseline-dependent variable (DEXA fat was adjusted for lean, and lean for fat), change in total sugar intake (only included in the weight model), and change in bench press (only included in the BMI and the BMI z-score model).
Means with different letters (c and d) across intervention groups are significantly different from one another using Bonferroni multiple comparisons (P ≤ 0.01).
Means with different letters (c and d) across intervention groups are significantly different from one another using Bonferroni multiple comparisons (P ≤ 0.01).
Means with different letters (e and f) across intervention groups are significantly different from one another using Bonferroni multiple comparisons (P ≤ 0.05).
Means with different letters (e and f) across intervention groups are significantly different from one another using Bonferroni multiple comparisons (P ≤ 0.05).
Means with different letters (g and h) show a trend across intervention groups using Bonferroni multiple comparisons (P ≤ 0.10).
Means with different letters (g and h) show a trend across intervention groups using Bonferroni multiple comparisons (P ≤ 0.10).
DEXA, dual energy x-ray absorptiometry; C, control; N, nutrition only; N + ST, nutrition + strength training; and N + CAST, nutrition + combination of aerobic and strength training.
FIGURE 1.
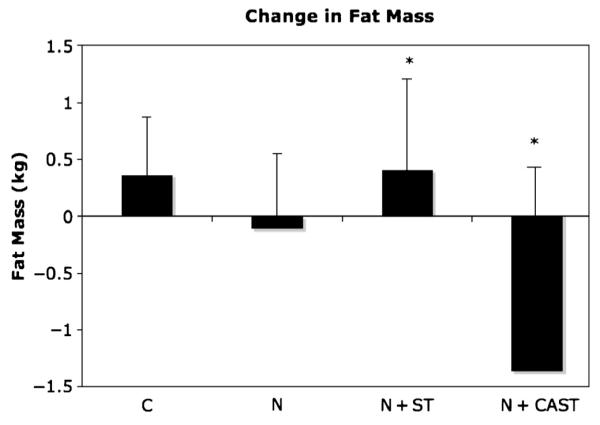
Changes in fat mass across groups (mean ± SE). P values were calculated using ANCOVA; *P ≤ 0.05. Covariates included Tanner and change in baseline fat and lean mass.
Glucose and insulin indices
The group effects for changes in glucose and insulin indices from the OGTT and the FSIVGTT are presented in Table 4. There was a significant across-group effect for fasting glucose, with the N + CAST group decreasing and the N group increasing (−4.4% ± 6.6% vs 2.9% ± 5.9%; P ≤ 0.05). There were no significant across-group effects for changes in 2-h glucose and insulin, glucose and insulin IAUC as measured by OGTT, or insulin sensitivity, acute insulin response, or disposition index measured by the FSIVGTT.
TABLE 4.
Changes in glucose and insulin indices from OGTT and FSIVGTT: across-group effects for evaluable participants (n = 41).
| Outcomesa | C (n = 7) | N (n = 10) | N + ST (n = 9) | N + CAST (n = 15) | P Valueb |
|---|---|---|---|---|---|
| OGTT (3 h) | |||||
| Fasting glucose (mg·dL−1) | −3.9 (6.3) | 2.5 (5.3)c | −3.6 (4.3) | −4.3 (6.1)d | 0.047 |
| 2-h glucose (mg·dL−1) | 10.7 (15.3) | −7.8 (28.2) | −0.9 (29.0) | −2.5 (21.2) | 0.494 |
| Fasting insulin (μU·mL−1) | 4.7 (16.3) | 4.5 (15.4) | −0.8 (9.3) | −0.5 (7.7) | 0.555 |
| 2-h insulin (μU·mL−1) | 85.4 (166.3) | 1.9 (252.8) | −18.5 (124.7) | −41.1 (96.4) | 0.440 |
| Glucose IAUC (nmol·min−1·L−1) | −241.8 (51.6) | −290.5 (41.1) | −269.1 (45.0) | −277.1 (60.1) | 0.089 |
| Insulin IAUC (nmol·min−1·L−1) | 105.2 (281.3) | −48.9 (279.4) | −81.9 (229.0) | −101.8 (176.8) | 0.277 |
| FSIVGTT | |||||
| SI (×10−4 min−1·μU−1·mL−1) | −0.03 (1.7) | 0.3 (0.4) | −0.4 (0.9) | 0.1 (0.6) | 0.392 |
| AIR (μU·mL−1 × 10 min) | −88.0 (435.5) | 7.1 (329.5) | 24.4 (406.4) | −128.5 (453.1) | 0.539 |
| DI (×10−4 min−1) | −130.1 (904.2) | 405.8 (624.1) | −484.9 (1001.0) | 39.4 (839.7) | 0.199 |
Data are adjusted change scores; mean (SD).
P values were calculated using ANCOVA. Covariates included Tanner, baseline-dependent variable, and baseline DEXA fat and lean mass (only included if significant in the model). Analyses were based on log scores for all except fasting glucose.
Means with different letters (c and d) across intervention groups are significantly different from one another using Bonferroni multiple comparisons (P ≤ 0.05).
Means with different letters (c and d) across intervention groups are significantly different from one another using Bonferroni multiple comparisons (P ≤ 0.05).
C, control; N, nutrition only; N + ST, nutrition + strength training; and N + CAST, nutrition + combination of aerobic and strength training; OGTT, oral glucose tolerance test; IAUC, incremental area under the curve; FSIVGTT, frequently sampled intravenous glucose tolerance test; SI, insulin sensitivity; AIR, acute insulin response; and DI, disposition index.
DISCUSSION
We hypothesized that the CAST approach would have synergistic improvements on both adiposity parameters and insulin resistance, specifically when compared with the N + ST group. Although the CAST approach did not result in significant improvements in insulin resistance, it did reduce all adiposity parameters when compared with the N + ST group and fasting glucose when compared with the N group. These results suggest that the CAST approach may be a good exercise modality for reducing adiposity and for improving some metabolic parameters in an overweight Latina adolescent population. To our knowledge, this is the first study that has used the combination of aerobic and strength training (CAST) in an overweight Latino adolescent population.
Numerous adult studies have shown aerobic exercise to improve insulin sensitivity or action (12,19,22). Goodpaster et al. (12) showed that a 16-wk aerobic intervention (4–6 d·wk−1) in combination with energy restriction resulted in a 49% increase in insulin sensitivity in 25 obese adults. To date, there have only been a few studies that have assessed the impact of an aerobic only intervention on insulin sensitivity or action in children. In a 10-wk intervention conducted by Gutin et al. (16), neither an aerobic training (n = 12) nor a lifestyle education (n = 10) improved fasting insulin levels in obese African American girls. In contrast, Ferguson et al. (11) showed that an intensive aerobic training program (5 d·wk−1 for 4 months; 40-min training sessions) resulted in small, yet significant, improvements fasting insulin in obese boys and girls (n = 79). Although these results suggest that aerobic-only interventions may be useful in improving insulin action in adults, the results are not quite as clear for children, and other forms of exercises should be explored to decrease type 2 diabetes risk for children.
Few intervention studies have used the CAST approach to reduce adiposity and metabolic-related parameters in adolescent populations. Byrne et al. (4) randomly assigned 48 overweight adolescents to one of three 16-wk intervention groups: 1) aerobic training only, 2) strength training, and 3) combination of aerobic and strength training (CAST). Subjects who received the CAST achieved better cardiovascular gains () and lost more fat mass as measured by DEXA than the strength training group while maintaining similar strength gains (one repetition maximum), but no assessment of glucose/insulin indices was conducted. Another study by Watts et al. (38) found that an 8-wk crossover CAST intervention (three times per week) resulted in significant decreases in abdominal and trunk fat as measured by DEXA in 19 obese adolescents but did not have an impact on total adiposity or fasting lipids or glucose. A recent study by Bell et al. (2) showed that an 8-wk CAST program in 14 obese children resulted in a 22% increase in insulin sensitivity, as measured by euglycemic–hyperinsulinemic clamp, but no differences in body composition were found, and this study did not use a control group. In contrast, we found that our 16-wk CAST pilot intervention resulted in significant reductions in adiposity when compared with the N + ST group and significant reductions in fasting glucose when compared with the N group, but no changes in insulin sensitivity were found.
With our previous nutrition pilot study, we saw that significant reductions in added sugar intake were related to significant improvements in insulin secretion (8). The significant reduction in total sugar, seen in the N + CAST group, may in part explain the significant improvements seen in fasting glucose. However, added sugar in this group did not decrease, which may explain the null findings for insulin secretion. In addition, the reductions in added sugar and carbohydrate intake seen in the N group also did not lead to significant improvements in insulin secretion. In subsequent analyses and articles, we intend to examine whether dietary compliers (i.e., those who decreased both total and added sugar and increased dietary fiber vs those who did not) and changes in food and beverage components affect changes in glucose/insulin indices. Assessing differences in dietary compliance, independent of intervention group, is needed to fully understand how changes in dietary intake may impact metabolic parameters.
We also expected that the strength gains seen in the N + ST and the N + CAST groups would have resulted in improvements in insulin sensitivity as seen in our strength training pilot study. However, there were no significant improvements in insulin sensitivity across intervention groups. It is important to note that the previous pilot study did not include a nutrition component and was conducted only with Latino boys. The current findings suggest that the improvements in strength, with or without changes in body composition, did not lead to similar improvements in insulin sensitivity in girls. However, in future analyses, we intend to explore whether participants who increased their strength and physical activity levels, regardless of intervention group, had greater improvements in adiposity and metabolic parameters compared with those who decreased their strength and physical activity levels.
Other investigators have shown that intense cardiovascular programs have resulted in similar adiposity improvements in obese children and adolescents (15,18,31). Most notably, Gutin et al. (15) found that a 16-wk (5 d·wk−1 for 40 min) cardiovascular exercise intervention resulted in a significant reduction of 0.7 kg of fat mass (or a 3.6% body fat reduction) in 80 obese adolescents. This reduction in fat mass is similar to what we saw with this CAST intervention; however, the frequency of this exercise program was only 2 d·wk−1 for 60 min. The less frequent CAST program may be more realistic and feasible for most individuals and more sustainable for long-term weight maintenance.
In addition, the CAST modality may be better suited for an overweight population because it includes only short bouts of cardiovascular components (2 min in length) coupled with strength training. Given that some of the participants in our study were extremely overweight, with six participants exceeding 250 lb (one in C, one in N, two in N + ST, and two in N + CAST), a 60-min aerobic intervention may not have been feasible, or as easily attainable, for these participants. The CAST approach allowed these obese teens to complete an accumulation of 30 min of cardiovascular exercise in an achievable fashion.
In addition, the motivation of the participants must also be considered. Numerous studies highlight the importance of assessing the potential mediating role of the motivational factors on health outcomes (28,35). In subsequent articles and analyses, we intend to assess whether motivational factors, identified during MI sessions and in the various motivational questionnaires that were administered before and after intervention, affected dietary, strength and physical activity compliance, and subsequent health outcomes regardless of intervention group.
There are limitations of this study that should be considered. The first limitation is the relatively small sample size. The power calculation was based on change in insulin sensitivity between the strength training and the control groups from the strength training pilot study, and this calculation was conducted only in boys, which did not take into account the change in adiposity or the addition of the CAST design nor include a nutrition component. Nevertheless, this was a pilot, supplemental study, and we intend to test this combination exercise approach in larger intervention studies using both genders. The second limitation is the unequal sample sizes of each intervention group. As mentioned earlier, we oversampled in the CAST group to be comparable to the larger trial using both genders. Another limitation is that there was no comparison to an aerobic-only intervention group; however, we intend to do this type of comparison in future studies. There was also no functional assessment of physical activity (i.e., 6-min walk test) or cardiovascular fitness (i.e., ) measured in this study, both of which would have potentially been useful in interpreting the improvements in adiposity seen in the CAST group.
In conclusion, a combined aerobic and strength training exercise intervention successfully reduced multiple adiposity measures by approximately 3% in a sample of overweight Latina adolescent girls compared with the N + ST group. However, neither the N + CAST group nor any other intervention group significantly improved metabolic parameters, with the exception of fasting glucose levels. These results suggest that even intense interventions that successfully reduce adiposity may not have synergistic improvements on metabolic parameters, particularly insulin indices. Although with time, the improvements in adiposity seen with the combined approach could reduce other type 2 diabetes risk factors. Further research investigating and identifying intervention approaches that improve both adiposity and metabolic parameters, particularly in high-risk population, is warranted.
Acknowledgments
The authors thank the Strength and Nutrition Outcomes for Latino Adolescents (SANO LA) team as well as the nursing staff at the GCRC. In addition, the authors are grateful to our study participants and their families for their involvement.
This study was supported by the NCI Centers for Transdisciplinary Research on Energetics and Cancer (TREC) (U54 CA 116848), the National Institute of Child Health and Human Development (RO1 HD/HL 33064), the Dr. Robert C. and Veronica Atkins Foundation, the National Cancer Institute (Cancer Control and Epidemiology Research Training Grant, T32 CA 09492), and the M01 RR 00043 from NCRR/NIH.
The results of the present study do not constitute endorsement by the American College of Sports Medicine.
REFERENCES
- 1.ADA Type 2 diabetes in children and adolescents. Pediatrics. 2000;105:671–80. doi: 10.1542/peds.105.3.671. [DOI] [PubMed] [Google Scholar]
- 2.Bell LM, Watts K, Siafarikas A, et al. Exercise alone reduces insulin resistance in obese children independently of changes in body composition. J Clin Endocrinol Metab. 2007;92:4230–5. doi: 10.1210/jc.2007-0779. [DOI] [PubMed] [Google Scholar]
- 3.Byrd-Williams C, Kelly LA, Davis JN, Spruijt-Metz D, Goran MI. Influence of gender, BMI and Hispanic ethnicity on physical activity in children. Int J Pediatr Obes. 2007;2:159–66. doi: 10.1080/17477160701369167. [DOI] [PubMed] [Google Scholar]
- 4.Byrne N, Hunter G, Meerkin J, Hill AP. Combining resistance and aerobic training results in greater body composition and fitness benefits than either mode separately. Obes Res. 2005;13:A138. [Google Scholar]
- 5.Cruz ML, Weigensberg MJ, Huang T, Ball GDC, Shaibi GQ, Goran MI. The metabolic syndrome in overweight Hispanic youth and the role of insulin sensitivity. J Clin Endocrinol Metab. 2004;89:108–13. doi: 10.1210/jc.2003-031188. [DOI] [PubMed] [Google Scholar]
- 6.Davis JN, Kelly LA, Lane CJ, et al. Randomized control trial to reduce obesity related diseases in overweight Latino adolescents. (in press) [DOI] [PMC free article] [PubMed]
- 7.Davis JN, Ventura EE, Alexander KA, et al. Development and testing of a culturally tailored nutrition education program for reducing sugar and increasing fiber intake in overweight Latina adolescents. Int J Pediatr Obes. 2007;2:22–30. [Google Scholar]
- 8.Davis JN, Ventura EE, Shaibi GQ, et al. Reduction in added sugar intake and improvement in insulin secretion in overweight Latina Adolescents. Metab Syndr Relat Disord. 2007;5:183–93. doi: 10.1089/met.2006.0038. [DOI] [PMC free article] [PubMed] [Google Scholar]
- 9.Eriksson J, Tuominen J, Valle T, et al. Aerobic endurance exercise or circuit-type resistance training for individuals with impaired glucose tolerance? Horm Metab Res. 1998;30:37–41. doi: 10.1055/s-2007-978828. [DOI] [PubMed] [Google Scholar]
- 10.Faigenbaum AD, Milliken LA, Westcott WL. Maximal strength testing in healthy children. J Strength Cond Res. 2003;17:162–6. doi: 10.1519/1533-4287(2003)017<0162:mstihc>2.0.co;2. [DOI] [PubMed] [Google Scholar]
- 11.Ferguson MA, Gutin B, Le NA, et al. Effects of exercise training and its cessation on components of the insulin resistance syndrome in obese children. Int J Obes Rel Met Dis. 1999;23:889–95. doi: 10.1038/sj.ijo.0800968. [DOI] [PubMed] [Google Scholar]
- 12.Goodpaster BH, Katsiaras A, Kelley DE. Enhanced fat oxidation through physical activity is associated with improvements in insulin sensitivity in obesity. Diabetes. 2003;52:2191–7. doi: 10.2337/diabetes.52.9.2191. [DOI] [PubMed] [Google Scholar]
- 13.Goran M, Bergman R, Cruz M, Watanabe R. Insulin resistance and associated compensatory responses in African-American and Hispanic children. Diabetes Care. 2001;25:2184–90. doi: 10.2337/diacare.25.12.2184. [DOI] [PubMed] [Google Scholar]
- 14.Goran MI, Bergman RN, Avilla Q, et al. Impaired glucose tolerance and reduced beta-cell function in overweight Latino children with a positive family history of type 2 diabetes. J Clin Endocrinol Metab. 2004;89:207–12. doi: 10.1210/jc.2003-031402. [DOI] [PubMed] [Google Scholar]
- 15.Gutin B, Barbeau P, Owens S, et al. Effects of exercise intensity on cardiovascular fitness, total body composition, and visceral adiposity of obese adolescents. Am J Clin Nutr. 2002;75:818–26. doi: 10.1093/ajcn/75.5.818. [DOI] [PubMed] [Google Scholar]
- 16.Gutin B, Cucuzzo N, Islam S, Smith C, Stachua ME. Physical training, lifestyle education and coronary risk factors in obese girls. Med Sci Sports Exerc. 1995;28(1):19–23. doi: 10.1097/00005768-199601000-00009. [DOI] [PubMed] [Google Scholar]
- 17.Hollingshead AB. Four Factor Index of Social Status. Department of Sociology, Yale University; New Haven (CT): 1975. Four factor index of social status. [Google Scholar]
- 18.Humphries MC, Gutin B, Barbeau P, Vemulapalli S, Allison J, Owens S. Relations of adiposity and effects of training on the left ventricle in obese youths. Med Sci Sports Exerc. 2002;34(9):1428–35. doi: 10.1097/00005768-200209000-00005. [DOI] [PubMed] [Google Scholar]
- 19.Irwin ML, Mayer-Davis EJ, Addy CL, et al. Moderate-intensity physical activity and fasting insulin levels in women: the Cross-Cultural Activity Participation Study. Diabetes Care. 2000;23:449–54. doi: 10.2337/diacare.23.4.449. [DOI] [PubMed] [Google Scholar]
- 20.Kaikkonen H, Yrjama M, Siljander E, Byman P, Laukkanen R. The effect of heart rate controlled low resistance circuit weight training and endurance training on maximal aerobic power in sedentary adults. Scand J Med Sci Sports. 2000;10:211–5. doi: 10.1034/j.1600-0838.2000.010004211.x. [DOI] [PubMed] [Google Scholar]
- 21.Kang HS, Gutin B, Barbeau P, et al. Physical training improves insulin resistance syndrome markers in obese adolescents. Med Sci Sports Exerc. 2002;34(12):1920–7. doi: 10.1097/00005768-200212000-00010. [DOI] [PubMed] [Google Scholar]
- 22.Kelly DE, Goodpaster BH. Effects of physical activity on insulin action and glucose tolerance in obesity. Med Sci Sports Exerc. 1999;31(11 suppl):S619–23. doi: 10.1097/00005768-199911001-00021. [DOI] [PubMed] [Google Scholar]
- 23.Maiorana A, O’Driscoll G, Goodman C, Taylor R, Green D. Combined aerobic and resistance exercise improves glycemic control and fitness in type 2 diabetes. Diabetes Res Clin Pract. 2002;56:115–23. doi: 10.1016/s0168-8227(01)00368-0. [DOI] [PubMed] [Google Scholar]
- 24.Marshall WA, Tanner JM. Variations in pattern of pubertal changes in girls. Arch Dis Child. 1969;44:291–303. doi: 10.1136/adc.44.235.291. [DOI] [PMC free article] [PubMed] [Google Scholar]
- 25.Marshall WA, Tanner JM. Variations in the pattern of pubertal changes in boys. Arch Dis Child. 1970;45:13–23. doi: 10.1136/adc.45.239.13. [DOI] [PMC free article] [PubMed] [Google Scholar]
- 26.McCarthy J, Agre J, Graf B, Pozniak M, Vailas A. Compatibility of adaptive responses with combining strength and endurance training. Med Sci Sports Exerc. 1995;27(3):429–36. [PubMed] [Google Scholar]
- 27.Miller WR, Rollnick S. Motivational Interviewing, Preparing People for Change. 2nd ed The Guilford Press; New York: 2001. [Google Scholar]
- 28.Mullineaux DR, Barnes CA, Barnes EF. Factors affecting the likelihood to engage in adequate physical activity to promote health. J Sports Sci. 2001;19(4):279–88. doi: 10.1080/026404101750158376. [DOI] [PubMed] [Google Scholar]
- 29.National Cancer Institute (NCI) [cited 2008 June 1];Risk factor monitoring and methods: SAS programs for analyzing NHANES 2003–2004 accelerometer data. 2008 Available from: http://riskfactor.cancer.gov/tools/nhanes_pam.
- 30.Ogden CL, Carroll MD, Flegal KM. High body mass index for age among US children and adolescents. JAMA. 2008;299:2401–5. doi: 10.1001/jama.299.20.2401. [DOI] [PubMed] [Google Scholar]
- 31.Owens S, Gutin B, Allison J, et al. Effect of physical training on total and visceral fat in obese children. Med Sci Sports Exerc. 1999;31(1):143–8. doi: 10.1097/00005768-199901000-00022. [DOI] [PubMed] [Google Scholar]
- 32.Pate RR, Ross R, Dowda M, Trost S, Sirard JR. Validation of a three-day physical activity recall instrument in female youth. Pediatr Exerc Sci. 2003;15:257–65. [Google Scholar]
- 33.Rosenbloom AL, Joe JR, Young RS, Winter WE. Emerging epidemic of type 2 diabetes in youth. Diabetes Care. 1999;22:345–54. doi: 10.2337/diacare.22.2.345. [DOI] [PubMed] [Google Scholar]
- 34.Shaibi GQ, Cruz ML, Ball GD, et al. Effects of resistance training on insulin sensitivity in overweight Latino adolescent males. Med Sci Sports Exerc. 2006;38(7):1208–15. doi: 10.1249/01.mss.0000227304.88406.0f. [DOI] [PubMed] [Google Scholar]
- 35.Thogersen-Ntoumani C, Ntoumanis N. The role of self-determined motivation in the understanding of exercise-related behaviours, cognitions and physical self-evaluations. J Sports Sci. 2006;24:393–404. doi: 10.1080/02640410500131670. [DOI] [PubMed] [Google Scholar]
- 36.Troiano RP, Berrigan D, Dodd KW, Masse LC, Tilert T, McDowell M. Physical activity in the United States measured by accelerometer. Med Sci Sports Exerc. 2008;40(1):181–8. doi: 10.1249/mss.0b013e31815a51b3. [DOI] [PubMed] [Google Scholar]
- 37.Trost S, Ward D, McGraw B, Pate RR. Validity of the previous day physical activity recall (PDPAR) in fifth-grade children. Pediatr Exerc Sci. 1999;11:341–8. [Google Scholar]
- 38.Watts K, Beye P, Siafarikas A, et al. Exercise training normalizes vascular dysfunction and improves central adiposity in obese adolescents. J Am Coll Card. 2004;43:1823–7. doi: 10.1016/j.jacc.2004.01.032. [DOI] [PubMed] [Google Scholar]
- 39.Weigensberg MJ, Ball GD, Shaibi GQ, Cruz ML, Goran MI. Decreased beta-cell function in overweight Latino children with impaired fasting glucose. Diabetes Care. 2005;28:2519–24. doi: 10.2337/diacare.28.10.2519. [DOI] [PubMed] [Google Scholar]