

Abstract
A one-of-a-kind high speed optical multichannel spectrometer was designed and built at NIH and described in this journal in 1997 [Cole et al. Vol 35, pages 161–174]. The most unique aspect of this instrument was the ability to follow an entire time course from a single activation using a single sample. The instrument has been used to study rapid kinetic processes in the photon-driven bacteriorhodopsin photocycle and electron transport from cytochrome c to cytochrome aa3 and from cytochrome aa3 to oxygen. The present paper describes a second generation instrument with a number of important enhancements which significantly improve its capabilities for multichannel kinetic studies. An example application is presented in which the kinetics of photon-induced proton flow across the biological membrane is measured simultaneously with the individual steps of the photocycle determined optically. Matching the time constants for the two processes indicates which molecular transformations are associated with major proton movements.
1. Introduction
Prior to the introduction of analytical procedures capable of deconvoluting whole spectra that developed in a third dimension such as pH or solution potential [1], analyses were based on experimental data collected at either a single characteristic wavelength or the characteristic wavelength and a reference wavelength such as an isosbestic point. For such thermodynamic studies, ordinary spectrometers can be used. To apply the same analytical procedures to kinetic studies, required a high speed optical multichannel spectrometer. For fast kinetic processes that could be quickly initiated by a laser pulse, existing spectrometers capable of rapid acquisition of whole spectra were based on using a separate actinic and monitoring light pulse for each time point. To use the new multichannel analyses [1], a new kind of spectrometer that could follow the entire time course after a single actinic pulse would be highly desirable. Such a spectrometer was designed and built at the National Institutes of Health [2]. Hendler and collaborators used this spectrometer in an extensive series of kinetic studies on various aspects of the bacteriorhodopsin photocycle [3–10] and on electron transfer to and from mammalian cytochrome oxidase [11, 12]. During these studies with the original instrument over a 14 year period, it became obvious that a newer version of the instrument with added capabilities would enable a more thorough examination of kinetic processes. Specifically, the resolution was increased from 12-bits to 16-bits, the maximum sampling rate was increased from 100 kHz to 200 kHz, independent programable gain and offset for each channel were added, logarithmic time scheduling was added as an option, and system stability and reliability were enhanced. In addition, an extra channel was enabled so that the kinetics of proton electric current flow could be measured simultaneously with the optical kinetics of the system. Bacteriorhodopsin, like cytochrome oxidase, is an energy-driven proton pump which converts an input energy into an electrochemical gradient across the membrane, from which ATP is synthesized. In the case of cytochrome oxidase, the energy source is from respiratory electron transport, whereas with bacteriorhodopsin the driving force is from absorbed photons. The photon energy is used to electrogenically pump protons across the membrane to build the electrochemical gradient. The ability to match electrogenicity to specific transitions in the photocycle, followed optically, helps identify which steps on the photocycle are most involved in the energy transduction process. Experiments to accomplish this goal using the instrument described here have been performed (paper in preparation). The programmable offset feature is important because certain photodiodes produce negative dark currents which register as zeros in the A/D converter, thus requiring intricate calibration procedures to obtain the true dark spectrum. While the original instrument was built completely in-house with common prototyping methods, the upgraded version uses commercially available components for the data acquisition system ans custom printed circuit boards for the front-end amplifiers and timing system.
2. Materials and methods
2.1 Instrumentation
Spectrometer
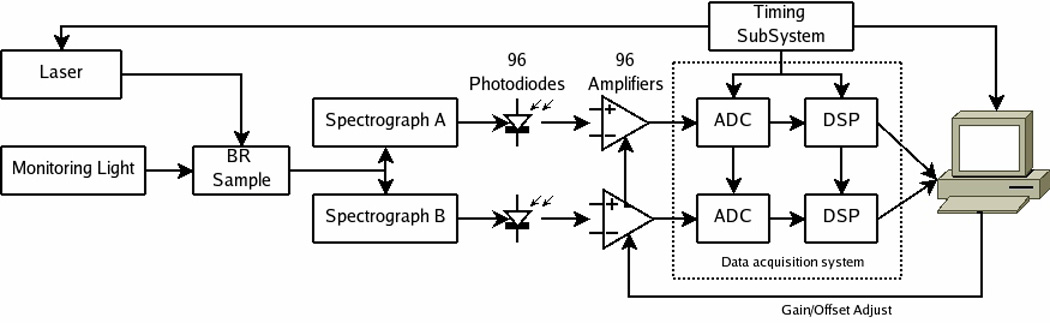
The electronics (Fig 1) consist of the analog front-end, the data acquisition system (DAQ), the timing subsystem, and the PC. The analog front-end amplifies the photodiode output (providing adjustable gain and offset) that is then fed into the DAQ system which performs the analog-to-digital conversion and sample processing (only subset of all samples are retained). The digitized data are transferred to a PC where they are displayed and saved to disk. The PC is also used to configure the system. The timing subsystem (consisting of a counter-timer board and some custom electronics) provides sampling clocks, triggers, and laser control signals. A graphical user interface to control the system was written using the Microsoft Visual Basic programming language.
Figure 1. Overall spectrometer system diagram.
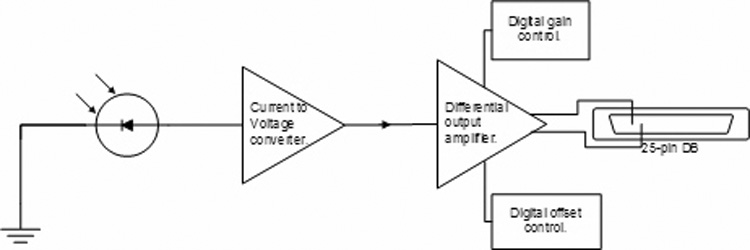
The custom-built analog front-end (Fig 2) consists of the photodiode arrays and amplifiers. Two photodiode arrays (Model #S4112-46, Hamamatsu Photonics, Hamamatsu City, Japan) are used, each mounted on separate printed circuit board (PCB). Each board is mounted inside a small aluminum box with a hole cut such that the face of the photodiode array extends slightly beyond the box outer surface. The boxes are mounted to the optics table with the photodiode array flush with the spectrographs. Both photodiode arrays are powered from a common 9 V battery through external cables. Ribbon cables connect the photodiode array outputs to the amplifier boards. There are four amplifier boards (2 for each photodiode array), each of which consists of 48 independent channels. The channels provide current-to-voltage conversion, through the use of a transimpedance amplifier (2.2V/µA gain), followed by a differential-output voltage amplifier with variable gain and offset. Both gain and offset control is achieved with digital potentiometers which are programmed using the PC. The gain of each channel can be independently adjusted from 1 V/V to 100 V/V in increments of approximately 0.4 V/V. The offset of each channel can also be independently adjusted from −5 V to 5 V in increments of approximately 40 mV. Both gains and offsets are controlled through the use of digital IO lines from the counter-timer board used in the timing subsystem. The differential outputs of the analog front-end are connected to the DAQ through several custom-built 2.4 m (8ft) long cables comprised of twisted-pair shielded wires. There are a total of 96 single analog channels located on 4 PCB boards (two per photodiode array). Each analog board has three 25-pin DB connectors. Each photodiode element has a dedicated amplifier channel (a transimpedance amp followed by a differential amp). Each amplifier channel can be independently adjusted for gain and offset.
Figure 2. Diagram of a single analog channel.
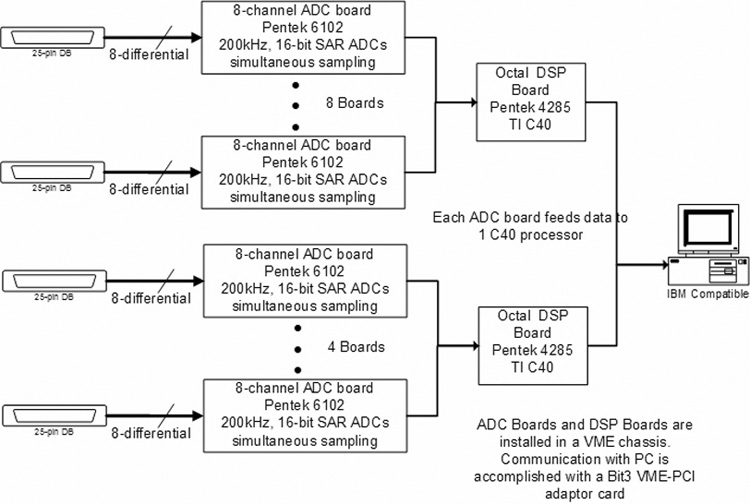
The data acquisition system (Fig 3) was designed and built by DSPCon (Bridgewater, NJ). The VME-based system uses components from Pentek, Inc (Upper Saddle River, NJ), including: 12 Pentek 6102 boards (8-channel 200kHz, 16-bit ADCs), two Pentek 4285 boards (Octal C40 DSP boards), and a Bit3 VME-to-PCI adaptor board. The ADC (analog-to-digital conversion) boards use external clocks and triggers provided by the timing subsystem described below. The output of each 8-channel ADC board is fed into a single DSP (digital signal processor) on the 4285 DSP boards (the second octal DSP board is populated with only four DSPs). The DSPs are programmed to store only those samples that meet a user-configurable sample schedule. Since the signals being digitized are exponentially decaying, it is desirable to store fewer samples as the signals decay to conserve memory. These schedules can be configured to provide sampling intervals on a linear or logarithmic scale. The DSP code is written primarily in the C programming language, but does contain some handwritten assembly language for time critical functions. After the data have been collected, the retained samples (usually 512 samples per channel) are downloaded to the PC to be saved and displayed. Although the DAQ system has the ability to average waveforms, the averaging is performed on the PC to allow an on-the-fly display of each waveform as it is collected.
Figure 3. Data acquisition system (DAQ).
The timing subsystem (Fig 4) consists of a PC plug-in counter-timer board (CIO-CTR10, Measurement Computing, Norton, MA) and a configurable logic device (CLD) (MAX EPM7128SLC84-6, Altera Corp., San Jose, CA). The CLD uses the on-board 1MHz oscillator of the CIO-CTR10 to generate both a 100 kHz clock and a 200 kHz clock. Either of these clocks can be used as the sampling rate for the DAQ system. The 100 kHz clock is used to derive all other timing signals; this guarantees that all signals are synchronous to the sampling clock (for both 100 kHz and 200 kHz rates). The laser requires two signals (Fig 5): a continuous 8.3 Hz flashlamp control that charges the laser, and a Q-switch signal that fires the laser. This Q-switch signal is fired 220 µs after the flashlamp has been triggered (as per the laser manufacturer's requirements), but only if the DAQ trigger has been activated. The DAQ trigger is generated by the CIO-CTR10 board using the flashlamp signal as a trigger and the 100k Hz clock (Fig 6). This allows the user to control the time from when the DAQ system starts collecting data to when the laser flashes. This effectively implements a “pre-trigger” feature which guarantees that no data from the start of the cycle are missed.
Figure 4. Block diagram of timing subsystem.
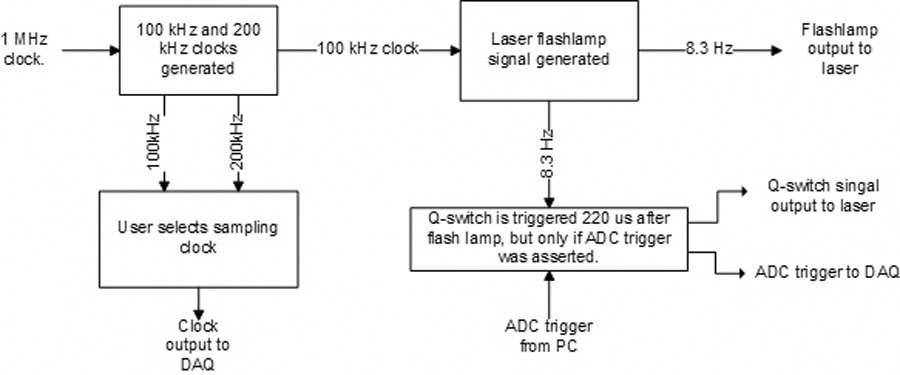
Figure 5. Timing clocks.
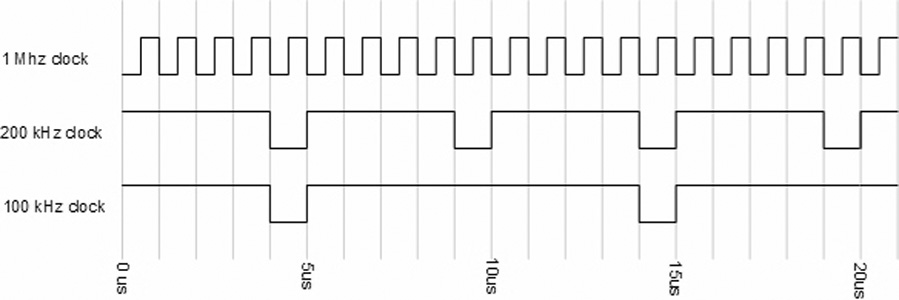
The duty cycles for the 100 kHz and 200 kHz sampling clocks were designed to meet the ADC manufacturer's specifications.
Figure 6. Trigger signals.
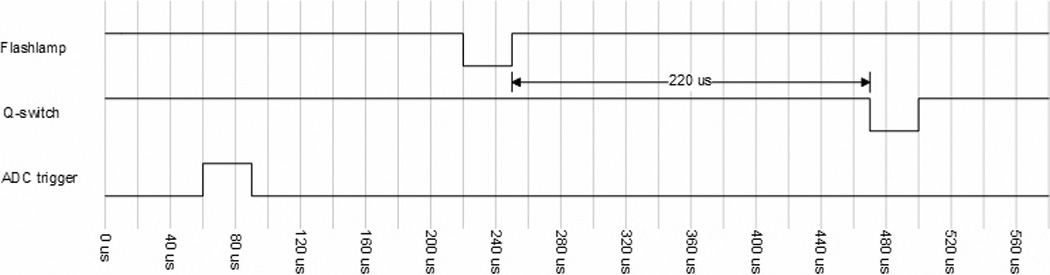
The duty cycles of the Flashlamp and Q-switch signals were designed to meet the laser manufacturer's specifications. The time delay between the ADC Trigger and Q-switch is user selectable. All trigger signals are synchronous with the sampling clocks of Fig 5.
The duty cycles of the Flashlamp and Q-switch signals were designed to meet the laser manufacturer's specifications. The time delay between the ADC Trigger and Q-switch is user selectable. All trigger signals are synchronous with the sampling clocks of Fig 5.
Optics
The monitoring beam illumination source (Proton Technology International (PTI) 75W Xenon arc lamp Model A1010, powered by PTI LPS 220 ) employs a parabolic reflector to capture the light at the expense of producing a donut illumination spot when focused. To overcome this limitation and create a uniform field at the sample chamber, a condenser lens focuses the illumination source at the center of a projector lens, which relays a broad, uniform illumination field to overfill the sample chamber. Heat from the light source is filtered out using a 15 cm water bath, containing dilute copper sulfate inserted between the light source and the condenser lens. Neutral density filters can be inserted into the light path to adjust the monitoring light intensity for optimal signal levels. Monitoring light passing through the sample chamber first passes through a 532 nm notch filter (Kaiser Analytical Systems #30249) to block scattered, laser light at 532 nm and is then collected by a plano-convex lens that focuses the light, by means of a beam-splitter, at the entrance slits of two 1/8 m, f4 Oriel spectrometers (Model 77200) with visible blaze 1200 line/mm gratings (Oriel model 77233). Each spectrometer records 46 wavelengths with a resolution of 2.9 nm. The gratings in the two spectrometers are centered to capture two independent regions of the visible spectrum with a gap in the center to reject the actinic laser light at 532 nm that was not blocked by the interference filter. For the experiments reported here, the two ranges covered were from 390.9 nm to 521.3 nm and 553.5 nm to 681 nm. Actinic photostimulation of the sample was achieved by directing the 532 nm second harmonic output of a single selected pulse from a Continuum SureLite I, 10 Hz, Nd:YAG laser (44 mJ per 5 ns pulse at 10 pps) perpendicular to the monitoring light path,. The laser pulse is broadened by lenses to overfill the sample chamber aperture and produce uniform photostimulation of ≈18 mJ/2cm2 of the sample.
2.2 Experimental Procedures
Preparation of purple membrane (PM)
BR (bacteriorhodopsin) is the sole protein present in PM. PM was isolated from the ET1001 strain of Halobacterium salinarum by the procedure of Oesterhelt and Stoeckenius [13] as modified by Mukhopadhyay et al. [5]. For kinetic studies, 0.5 mg of BR in PM were suspended in 3 ml of 50 mM potassium phosphate buffer at pH 7.2 and 21° C in a clear plastic 1 × 1 × 4 cm cuvette. Although the preparation is usually analyzed as a suspension, for the coincident measurement of optical changes with proton movements described here, the suspension is oriented in an electric field and then cast in an acrylamide gel as described below.
Optical data collection
Time-resolved multichannel data were collected as previously described [14, 15]. A brief summary is as follows. The optical range of spectrograph A was set from 390.9 nm to 521.3 nm and that of spectrograph B from 538.6 to 669 nm, both with a resolution of 2.9 nm. This resulted in a spectrum with 92 wavelengths. The gap from 521 nm to 539 nm was set to minimize an optical shock from the laser flash at 532 nm. Additional protection from the laser was further managed by using the 532 nm notch filter described above. The instrument was calibrated using a cuvette filled with distilled water by obtaining a 100% T spectrum. The light was then blocked and the 0% T spectrum obtained after the offsets of all the A/D converters were adjusted by software to raise all zero readings to small positive values .The laser flash was timed to occur 0.95 ms after starting the A/D converters. This allowed the collection of 25 spectra, prior to initiation of the photocycle, which were averaged to produce the ground state spectrum. The total time course starting from the actinic flash was contained in 488 time points covering the range from 0 to 189 ms. The collection schedule for these points was staggered as follows: from 0 to 1.85 ms with resolution of 0.01 ms; from 1.85 ms to 9.35 ms with resolution of 0.05 ms; from 9.35 to 59.35 ms with resolution of 0.5 ms; and from 59.35 ms to the end with resolution of 2.5 ms. The overall raw data matrix was 92 × 488 with rows as wavelengths and columns as time points. One hundred separate time courses spaced 5 s apart were time-averaged for the data shown here. The final data matrix was examined for any aberrant or spike-like artifacts, which if present were eliminated before proceeding with the analysis. In this data set the first wavelength row from spectrograph B was eliminated leaving a raw data matrix of 91 × 488.
Optical data analysis
Analysis of the data was performed using singular value decomposition-based least squares (SVD-lsq) [1, 16]. The SVD procedure factors the initial data matrix into three matrixes. One (the U matrix) contains orthonormal eigenvectors from the column space spectral information, of the raw data matrix, another (the V matrix) contains corresponding orthonormal eigenvectors of the row space time-dependent spectral change information, and the third (the S matrix) is a diagonal matrix whose elements provide the singular values which are related to eigenvalues. Usually, only 4–6 eigenvectors are found to contain all of the meaningful spectral and kinetic information of the entire collected data set. Multi-exponential fittings were then performed on the time-course vectors in the SVD-derived V-matrix [16, 17].
Using the three derived matrixes and the fitted parameters obtained in the fitting stage, one can reconstruct the difference spectra which occur at each exponential time change. The OD (optical density) amounts of change for each individual component an then be obtained from the amplitudes of these SVD-reconstructed spectra at their characteristic maximum wavelengths
Proton current measurements and analysis
As shown by Keszthelyi and Ormos [18], PM in a water suspension can be oriented in a small DC electric field so that the coordinated proton flow induced by a single laser flash can be measured by two Pt electrodes. Furthermore, the time-resolved electric signals can be fit by a sum of exponentials and their time constants compared to those obtained based on optical changes in the same suspension. This work was extended by Dér et al. [19], who showed that once orientation has been achieved, the preparation can be stabilized in an acrylamide gel so that the electric field can be removed and the gel could be impregnated with a buffer of choice. Our procedure for preparation of PM in an acrylamide gel is the following:
1. Place two platinized Pt electrodes on two inner opposite sides of 1 cm × 1 cm × 4 cm plastic cuvette having four clear sides.
2. Add in sequence with proper mixing, 1.6 ml of highly purified H2O (>18.2 Mohm resistance), 0.1 ml PM containing 0.5 to 0.6 mg BR, 0.6 ml 30% acrylamide and 0.8 % bisacrylamide, 0.02 TEMED.
3. Apply a constant DC voltage field of 10 V across the electrodes and then mix in, 0.18 ml of a solution of 40 mg/ml ammonium persulfate.
The suspension gels within two minutes during which time, the current flowing between the two electrodes falls from ≈45 mA to ≈25 mA. After puncturing a small hole in the bottom of the cuvette with a wide gauge hypodermic needle, the gel is removed from the cuvette and soaked overnight in 50 mM potassium phosphate buffer of pH 7.2.
For measurements, the washed gel is reinserted into the cuvette used for casting, with the orientation preserved. Two platinized Pt electrodes in the form of loops to fit the optical sides of the cuvette are inserted. The electric signals are amplified using a circuit comparable to those described by Keszthelyi and Ormos [18], and Dér et al.[19]. Controls to monitor the electrode responses to the laser flashes, used the above procedure without the DC-orienting electric field. The electric responses were extremely small, but nonetheless were subtracted from those obtained with the corresponding oriented gel. During an experiment, both the multichannel optical data and electrical data were simultaneously gathered and stored. For the latter, an unused A/D channel in the DAQ was used. The electrical data were fit to a sum-of-exponentials model.
3. Results
1. Fitting of data
Both, the V-vectors obtained from SVD analysis of the optical data, and the electric data for proton current from the oriented and unoriented gels were fit to five exponentials (Table 1).
Table 1.
Fitting of kinetic data
| Sample | Kinetic constant (ms−1) | Error (ms−1) | Dependency* | Tau (ms) |
|---|---|---|---|---|
| oriented gel optical data | 2.2113e1 | 5.2208e0 | 2.1634e0 | 4.5222e-2 |
| 7.7822e0 | 1.8207e0 | 2.2417e0 | 1.2850e-1 | |
| 3.1831e0 | 8.9657e-1 | 1.5467e0 | 3.1416e-1 | |
| 5.6352e-1 | 1.9549e-2 | 1.4110e0 | 1.7746e0 | |
| 2.0078e-1 | 2.3240-3 | 1.1372e0 | 4.9805e0 | |
| unoriented gel optical data | 2.3394e1 | 3.9712e0 | 2.0900e0 | 4.2746e-2 |
| 7.7780e0 | 9.8956e-1 | 2.2375e0 | 1.2857e-1 | |
| 2.5560e0 | 4.6610e-1 | 1.7096e0 | 3.8972e-1 | |
| 5.5907e-1 | 1.6843e-2 | 1.4759e0 | 1.7887e0 | |
| 2.1546e-1 | 1.9502e-3 | 1.1512e0 | 4.6413e0 | |
| oriented gel electrical data | 1.2279e2 | 1.2997e0 | 1.5000e0 | 8.1442e-3 |
| 1.5316e1 | 3.4857e-1 | 3.2653e0 | 6.5292e-2 | |
| 4.6892e0 | 9.4357e-1 | 4.8715e0 | 2.1326e-1 | |
| 1.5462e0 | 4.7636e-1 | 3.9253e0 | 6.4673e-1 | |
| 2.07897e-2 | 1.6960e-2 | 2.6148e0 | 4.8092e0 | |
Dependency values below 10 indicate that the listed exponential is essential for an accurate fit [17].
2. Comparison of optical and electrical kinetic components
The fitted kinetic components found in the gels are compared to each other and to those found in a suspension of PM fragments in Table 2. There are important similarities and differences to note. There is a component with a tau near 8 µs seen in the electrical data and the optical data using PM in suspension, but not from the optical data with PM in gels. The most likely explanation is related to the fact that there are only a few data points in the beginning of the time course which contain information on this component. In the gels, because of enhanced light-scattering the signal to noise ratio is sufficiently impaired to interfere with the fitting of this component. There is a component with a tau near 1.8 ms that is present in all of the optical fittings, but absent from the electrical data. Taus 2 to 4 are somewhat higher in the electrical than the optical data. Possible reasons for this are discussed separately (paper in preparation).
Table 2.
Comparison of Fitted Taus
| Tau | Electrical (oriented gel) | Optical (oriented gel) | Optical (unoriented gel) | Optical (suspension) | |
|---|---|---|---|---|---|
| ms | V* | ms | ms | ms | |
| 1 | 8.1442e-3 | 15 | ------ | ------ | 7.7684e-3 |
| 2 | 6.5292e-2 | 39 | 4.5222e-2 | 4.2746e-2 | 5.8129e-2 |
| 3 | 2.1326e-1 | 18 | 1.2850e-1 | 1.2857e-1 | 1.6849e-1 |
| 4 | 6.4673e-1 | 17 | 3.1416e-1 | 3.8972e-1 | 4.7218e-1 |
| 5 (optical) | ------ | ------ | 1.7746e0 | 1.7887e0 | 2.1037e0 |
| 5 (elec.) 6(optic.) | 4.8092e0 | 148 | 4.9805e0 | 4.6413e0 | 4.7841e0 |
Maximum value for current (amplitude) × (tau) using digitized data after amplification, which is proportional to local voltage formed [18].
4. Discussion
The main goal of the present paper is to describe a new high speed multichannel analyzer with a number of important enhancements over an earlier version of such an instrument described earlier. The sample application presented here studies the photon-driven, energy-transducing proton pump bacteriorhodopsin from Halobacterium salinarum. This protein forms an electrochemical gradient for protons across a membrane which is a precursor to the formation of ATP, and as such is a model for studying respiratory proton pump, cytochrome oxidase, which synthesizes ATP using energy liberated by electron transport. Bacteriorhodopsin is a much smaller and simpler proton pump than cytochrome oxidase and the goal of studies based on this system is to be able to pinpoint the actual steps where most of the proton movement and energy transduction occurs. The object of studying optical changes simultaneously with proton movement is to align and correlate the two processes.
Table 2 shows the presence of 6 kinetically distinct species with taus near 0.008, 0.05, 0.15, 0.5, 1.9, and 4.9 ms. These are essentially the same components as obtained previously by Hendler et al. [14, 20] and Chizhov et al. [21] using optical data, and by Rodig et al. [22] and Morgan et al. [23 ] using FTIR data, and by Müller et al. using both optical and FTIR data [24]. It is also shown in Table 2 that the component seen optically with a tau near 1.9 ms is absent in the electrical data. It is also shown in Table 2 that the most electrogenic step is associated with the transition characterized with the slowest tau. At the moment, there are two different views of the kinetic model for the BR photocycle [25]. In one there is a single photocycle with reversible steps emanating from a homogeneous ground state, while the other has two or more independent photocycles originating from different forms of BR. It is outside the scope of this paper to present the evidence for both views, but a general review of the situation can be found in reference [20].
Based on the parallel cycles model favored by Hendler et al. [14, 20] at pH near 7 and temperature near 20 °C there are two separate cycles, one containing Mf and the other Ms.
1.) BR → K → Lf → Mf → N → O → BR (M-fast)
2.) BR → K → Ls → Ms → BR (M-slow)
where K, L, M, N, and O are the recognized intermediates of the BR photocycle and the subscripts “f” and “s” indicate the faster and slower time constants for intermediates displaying the same characteristic spectra. According to this model, the 0.008 ms tau is for the BR → K step in both cycles, the 0.05 ms tau for Lf → Mf step, the 0.15 ms tau for the Ls → Ms step, the 1.9 ms tau for the Mf → N step, the 0.5 ms tau for the N → O step, and the 4.9 ms tau for decays of both O and Ms to the ground state. It is known that the saturation behaviors for turnover of both Mf and Ms as functions of increasing intensity of the actinic laser flash are quite different [26]. In a recent study, Hendler et al. [manuscript in preparation] studied the saturation behaviors for turnover of several intermediates of the BR photocycle to see if there were differences, which could indicate parallel cycles. The multichannel analyzer described here was used for these studies. The two main findings of this work were (1) the saturation behaviors for both the Mf and O intermediates were the same and quite different from that of the Ms intermediate, and (2) the saturation behavior for apparent voltage formation with tau of 4.8 ms resembled that of the Ms intermediate rather than that of the Mf intermediate.
5. Simplified description of the method and its applications
The described electronics system uses photodiode arrays to measure transmittance light. The current output of the photodiodes is converted into a voltage and amplified before being digitized. The system allows for variable gain and offset control on a channel-to-channel basis, and each channel is sampled simultaneously by the data acquisition system at a maximum rate of 200kHz. The system uses DSPs (digital signal processors) to keep only the samples needed, allowing the effective sampling rate to change over time. The multichannel optical spectra collected either logarithmically or in staggered time sequences are analyzed by singular value decomposition to obtain kinetic constants in the range of microseconds and higher, as well as discrete difference spectra for each fitted time constant. For processes where transitions are accompanied by events that create electrical changes, such as the flow of protons in the bacteriorhodopsin photocycle, the kinetics of this process can be followed simultaneously as illustrated in this work.
Figure 7. Fitting of proton current data.
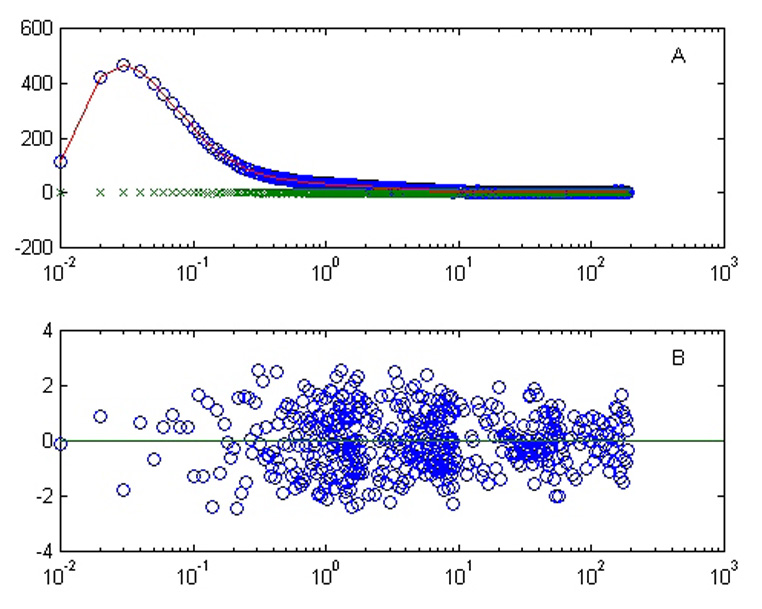
A. Raw data points using oriented gel (o); fit using five exponentials (line); raw data points using unoriented gel (x). B. Residuals of fit shown in panel A.
Footnotes
Publisher's Disclaimer: This is a PDF file of an unedited manuscript that has been accepted for publication. As a service to our customers we are providing this early version of the manuscript. The manuscript will undergo copyediting, typesetting, and review of the resulting proof before it is published in its final citable form. Please note that during the production process errors may be discovered which could affect the content, and all legal disclaimers that apply to the journal pertain.
References
- 1.Shrager RI, Hendler RW. Titration of individual components in a mixture with resolution of difference spectra, pK’s, and redox titrations. Anal. Chem. 1982;54:1147–1152. [Google Scholar]
- 2.Cole JW, Hendler RW, Smith PD, Fredrickson HA, Pohida TJ, Friauf WS. A high speed optical multichannel analyzer. J. Biochem. Biophys. Methods. 1997;35:161–174. doi: 10.1016/s0165-022x(97)00037-7. [DOI] [PubMed] [Google Scholar]
- 3.Hendler RW, Dancshazy Zs, Bose S, Shrager RI, Tokaji Zs. Influence of excitation energy on the bacteriorhodopsin photocycle. Biochemistry. 1994;33:4604–4610. doi: 10.1021/bi00181a022. [DOI] [PubMed] [Google Scholar]
- 4.Mukhopadyay AK, Bose S, Hendler RW. Membrane-mediated control of the bacteriorhodopsin photocycle. Biochemistry. 1994;33:10889–10895. doi: 10.1021/bi00202a007. [DOI] [PubMed] [Google Scholar]
- 5.Mukhopadyay AK, Dracheva S, Bose S, Hendler RW. Control of the integral membrane proton pump, bacteriorhodopsin, by purple membrane lipids of Halobacterium halobium. Biochemistry. 1996;35:9245–9252. doi: 10.1021/bi960738m. [DOI] [PubMed] [Google Scholar]
- 6.Dracheva S, Bose S, Hendler RW. Chemical and functional studies on the importance of purple membrane lipids in bacteriorhodopsin photocycle behavior. FEBS LETT. 1996;382:209–212. doi: 10.1016/0014-5793(96)00181-0. [DOI] [PubMed] [Google Scholar]
- 7.Joshi MK, Dracheva S, Hendler RW. Regulation of the bacteriorhodopsin photocycle and proton-pumping in whole cells of Halobacterium salinarium. Biochemistry. 1999;38:8786–8793. doi: 10.1021/bi990104q. [DOI] [PubMed] [Google Scholar]
- 8.Hendler RW, Drachev L, Bose S, Joshi MK. On the kinetics of voltage formation in purple membranes of Halobacterium salinarium. Eur. J. Biochem. 2000;267:5879–5890. doi: 10.1046/j.1432-1327.2000.01620.x. [DOI] [PubMed] [Google Scholar]
- 9.Hendler RW, Barnett SM, Dracheva S, Bose S, Levin IW. Purple membrane control of bacteriorhodopsin conformational flexibility and photocycle activity: An infrared study. Eur. J. Biochem. 2003;270:1920–2003. doi: 10.1046/j.1432-1033.2003.03547.x. [DOI] [PubMed] [Google Scholar]
- 10.Hendler RW, Bose S. Interconversions among four M-intermediates in the bacteriorhodopsin photocycle. 2003;270:3518–3524. doi: 10.1046/j.1432-1033.2003.03731.x. [DOI] [PubMed] [Google Scholar]
- 11.Hendler RW, Bose SK, Shrager RI. Multiwavelength analysis of the kinetics of reduction of cytochrome aa3 by cytochrome c. Biophysical J. 1993;65:1586–1604. doi: 10.1016/S0006-3495(93)81170-6. [DOI] [PMC free article] [PubMed] [Google Scholar]
- 12.Bose S, Hendler RW, Shrager RI, Chan SI, Smith PD. Multichannel analysis of single turnover kinetics of cytochrome aa3 reduction of O2. Biochemistry. 1997;36:2439–2449. doi: 10.1021/bi9617419. [DOI] [PubMed] [Google Scholar]
- 13.Oesterhelt D, Stoeckenius W. Isolation of the Cell Membrane of Halobacterium holobium and its Fractionation into Red and Purple Membrane. Methods Enzymol. 1974;31:667–679. doi: 10.1016/0076-6879(74)31072-5. [DOI] [PubMed] [Google Scholar]
- 14.Hendler RW, Shrager RI, Bose S. Theory and Procedures for Finding a Correct Kinetic Model for the Bacteriorhodopsin Photocycle. J. Phys. Chem. B. 2001;105:3319–3328. doi: 10.1021/jp002362z. [DOI] [PubMed] [Google Scholar]
- 15.Hendler RW, Bose S. Interconversions among four M-intermediates in the bacteriorhodopsin photocycle. Eur. J. Biochem. 2003;270:3518–3524. doi: 10.1046/j.1432-1033.2003.03731.x. [DOI] [PubMed] [Google Scholar]
- 16.Hendler RW, Shrager RI. Deconvolutions based on singular value decomposition and the pseudoinverse: a guide for beginners. J. Biochem. Biophys. Meth. 1994;28:1–33. doi: 10.1016/0165-022x(94)90061-2. [DOI] [PubMed] [Google Scholar]
- 17.Shrager RI, Hendler RW. Some pitfalls in curve-fitting and how to avoid them: A case in point. J. Biochem. Biophys. Meth. 1998;36:57–173. doi: 10.1016/s0165-022x(98)00007-4. [DOI] [PubMed] [Google Scholar]
- 18.Keszthelyi L, Ormos P. Electric Signals Associated with the Photocycle of Bacteriorhodopsin. FEBS Letts. 1980;109:189–193. [Google Scholar]
- 19.Dér A, Hargittai P, Simon J. Time-resolved photoelectric and absorption signals from oriented purple membranes immobilized in gel. J. Biochem. Biophys. Meth. 1985;10:295–300. doi: 10.1016/0165-022x(85)90063-6. [DOI] [PubMed] [Google Scholar]
- 20.Hendler RW. An Apparent General Solution for the Kinetic Models of the Bacteriorhodopsin Photocycles. J. Phys. Chem. B. 2005;109:16515–16528. doi: 10.1021/jp052733h. [DOI] [PubMed] [Google Scholar]
- 21.Chizhov I, Chernavskii DS, Engelhard M, Mueller KH, Zubov BV, Hess B. Spectrally silent transitions in the bacteriorhodopsin photocycle. Biophys. J. 1996;71:2329–2345. doi: 10.1016/S0006-3495(96)79475-4. [DOI] [PMC free article] [PubMed] [Google Scholar]
- 22.Rodig C, Chizhov I, Weidlich O, Siebert F. Time-resolved Step-Scan Fourier Transform Infrared Spectroscopy Reveals Differences between Early and Late M Intermediates of Bacteriorhodopsin. Biophys. J. 1999;76:2687–2701. doi: 10.1016/S0006-3495(99)77421-7. [DOI] [PMC free article] [PubMed] [Google Scholar]
- 23.Morgan JE, Vakkasoglu AS, Gennis RB, Maeda A. Water Structural Changes in the L and M Photocycle Intermediates of Bacteriorhodopsin as Revealed by Time-Resolved Step-Scan Fourier Transform Infrared (FTIR) Spectroscopy. Biochemistry. 2007;46:2787–2796. doi: 10.1021/bi0616596. [DOI] [PMC free article] [PubMed] [Google Scholar]
- 24.Müller KH, Butt HJ, Fendler K, Hess B, Siebert F, Engelhard M. The Reaction Cycle of Bacteriorhodopsin - An Analysis using visible absorption, Photocurrent and Infrared Techniques. Eur. Biophys. J. 1991;19:241–251. [Google Scholar]
- 25.Zimanyi L, Saltiel J, Brown LS, Lanyi JK. A Priori Resolution of the Intermediate Spectra in the Bacteriorhodopsin Photocycle: The Time Evolution of the L Spectrum Revealed. J. Phys. Chem. A. 2006;110:2318–2321. doi: 10.1021/jp056874v. [DOI] [PMC free article] [PubMed] [Google Scholar]
- 26.Shrager RI, Hendler RW, Bose S. The ability of actinic light to modify the bacteriorhodopsin photocycle: Heterogeneity and/or photocooperativity? Eur. J. Biochem. 1995;229:589–595. doi: 10.1111/j.1432-1033.1995.tb20502.x. [DOI] [PubMed] [Google Scholar]