Abstract
Endovascular stents reside in a dynamic flow environment and yet the impact of flow on arterial drug deposition after stent-based delivery is only now emerging. We employed computational fluid dynamic modeling tools to investigate the influence of luminal flow patterns on arterial drug deposition and distribution. Flow imposes recirculation zones distal and proximal to the stent strut that extend the coverage of tissue absorption of eluted drug and induce asymmetry in tissue drug distribution. Our analysis now explains how the disparity in sizes of the two recirculation zones and the asymmetry in drug distribution are determined by a complex interplay of local flow and strut geometry. When temporal periodicity was introduced as a model of pulsatile flow, the net luminal flow served as an index of flow-mediated spatio-temporal tissue drug uptake. Dynamically changing luminal flow patterns are intrinsic to the coronary arterial tree. Coronary drug eluting stents should be appropriately considered where luminal flow, strut design and pulsatility have direct effects on tissue drug uptake after local delivery.
Keywords: Drug-eluting stents, Computational fluid dynamics, Pulsatile blood flow, Strut design
1. INTRODUCTION
Millions of drug-eluting stents (DES) are implanted worldwide and yet, our understanding of the mechanisms governing arterial drug deposition and subsequent distribution into the tissue is limited. Initial studies explained how the physicochemical properties of the drugs employed and the binding sites of target tissues contributed to drug transport and retention in the arterial wall [1]. As clinical concern for DES thrombosis continues to emerge in association with issues of stent design [2], dimensions and overlap [3], drug combinations [4] and interactions, and defects in re-endothelialization [2, 5–7], more recent studies have focused on luminal factors affecting drug distribution. In particular, numerical simulations of steady state drug deposition under idealized luminal blood flow conditions [8] suggested that drug released from non-contacting strut surfaces also contribute to total drug deposition, accounting for increased tissue uptake. Elevated uptake was predicted to arise from strut-induced flow recirculation, separation and re-attachment zones that subsequently serve as drug pools with minimal dilution. These pools create substantial levels of drug concentration at the lumen-tissue (or mural) surface that serve as secondary sources of tissue uptake. Stent design and strut dimensions determine the size of the pools and in this way design may impact the primary neointimal hyperplastic response [9, 10].
As the impact of flow and interaction of rheology with stent design evolves, the pattern of blood flow must be considered. The pulsatile nature of cardiac ejection and coronary arterial filling imposes dynamically changing luminal flow. Therefore, dynamically changing flow patterns within the milieu of the stent could potentially influence drug deposition and arterial wall distribution patterns. The question that arises is to what extent luminal flow conditions govern tissue drug uptake via local mediation in stent-based drug delivery? Indeed, differences in DES efficacy in different arterial beds might well arise from differences in local blood flow.
We now study the importance of luminal flow variability on arterial drug deposition and distribution within the framework of a coupled computational fluid dynamics and mass transfer model. Numerical simulations were performed on a computational geometry simulating flow in the human left anterior descending coronary artery (LAD). At the outset, steady state simulations were performed using the 2D model for validating previous studies and to obtain further insights on the luminal flow-mediated drug uptake. Subsequently, we quantified the potential influence of transient luminal flow alterations on tissue drug deposition by performing time dependent simulations. The prediction that dynamically changing luminal flow patterns influence drug delivery from endovascular stents and do so in a design specific fashion adds to our understanding of the complexity of DES function and suggests novel design, utilization and evaluation paradigms.
2. METHODS
2.1. Mathematical model and numerical solution
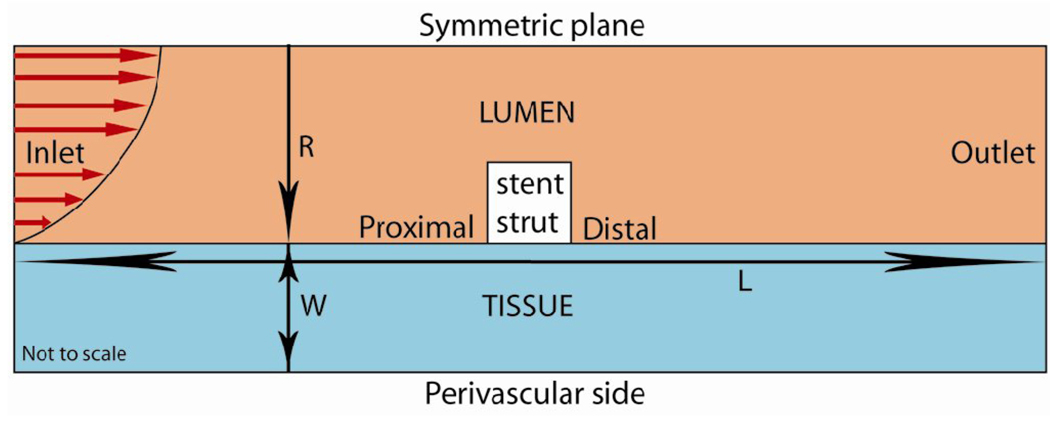
Numerical simulations were performed in a computational domain [8, 11, 12] of length L = 10 mm consisting of a single strut placed at the center of the vessel (Fig. 1). The artery was assumed to be symmetric with respect to a center line. The luminal radius was set at R = 1.5 mm and the arterial wall thickness at W = 1 mm. Unless stated otherwise, the strut was modeled with unit aspect ratio and area 0.01 mm2. The model incorporated two phases including the lumen (blood flow) and the arterial tissue. In the lumen, the continuity and momentum equations
| (1) |
| (2) |
were solved, where vf , ρ = 1.060 g/cm3 , P and μ are respectively the velocity, density, pressure and the viscosity of blood. Based on the previous reports of the non-Newtonian nature of blood viscosity, we invoked the Carreau model to account for the shear thinning behavior of blood [13–19]. More details on the viscosity model assumptions are presented in Section 2.4. Drug transport in the lumen was modeled as a linear advection-diffusion process
| (3) |
Fig. 1.
Schematic of the computational domain consisting of a single drug-eluting stent strut (in white) residing at the lumen-tissue interface. The direction of blood flow and the parabolic profile are shown at the inlet. L is the length of the vessel, R denotes the radius of the arterial lumen and W denotes the tissue thickness.
Here Cf denotes drug concentration and Df = 3.89×10⁻⁷ cm2/s [20] is model drug (Paclitaxel) diffusivity in blood. The arterial wall was assumed to be a porous medium in which the continuity equation
| (4) |
was solved, where vt is the interstitial fluid velocity. The momentum equation
| (5) |
was assumed to follow the Darcy’s law where K = 1.43×10⁻¹⁴ cm2 / s [21] is Darcy’s permeability of the arterial tissue. Drug transport in the artery wall follows an advection-diffusion model in the tissue as follows.
| (6) |
where Dt = 3.65×10⁻⁸ cm2/s [22] is the model drug diffusivity within the arterial wall and Ct is the concentration of drug in the tissue. Drug concentration was assumed to be continuous across blood-tissue, strut-blood and strut-tissue interfaces.
A steady or pulsatile Poiseuille parabolic velocity profile was imposed at the luminal inlet. At the outlet, a zero-pressure boundary condition was set. No-slip boundary conditions were imposed on the strut-blood and blood-tissue interfaces. Such an assumption is valid for blood and drugs examined. Future studies may need to consider a slip boundary condition if highly viscous fluid states are anticipated [23]. Flux continuity was maintained at all interfaces. In the lumen, a zero concentration boundary condition was applied at the inlet, an open boundary condition was applied at the outlet and symmetry boundary conditions were applied at the flow centerline (r=0, see Fig. 1). An impermeable boundary condition was established at the perivascular aspects of the model vessel. Strut drug release was simulated using a Dirichlet boundary condition of unit concentration. A finite volume solver, Fluent 6.3.26 (ANSYS Inc.) was utilized to perform the numerical simulations. The semi-implicit method for pressure-linked equations-consistent (SIMPLEC) algorithm [24] was used with second order spatial accuracy. Other solver settings included a second order discretization scheme for the pressure equation and a second order upwind scheme for the momentum [25] and concentration variables.
2.2. Pulsatile behavior of blood flow
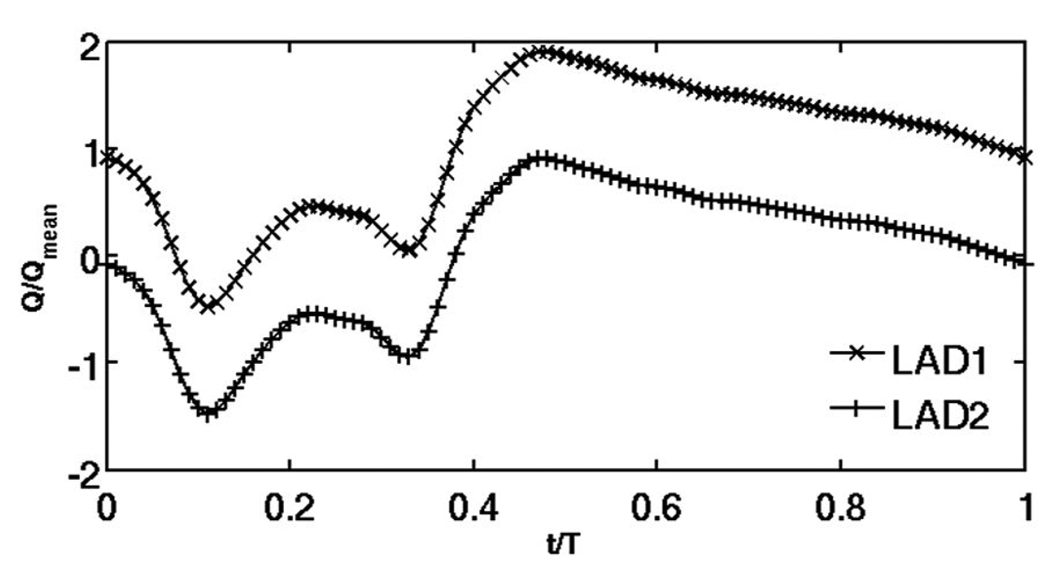
As blood flow is pulsatile rather than steady, the dimensions of strut-induced recirculation zones and the locations of flow re-attachment points vary with time. Since tissue drug distribution is driven by these local flow changes, we analyzed transient drug uptake profiles by considering flow profiles in a human coronary artery. Two forms of coronary flow were evaluated. Flow waveform LAD1 [26] is based on the average blood velocity measurements of the human left anterior descending coronary (LAD) artery. LAD2 (Fig. 2) flow waveform was contrived in a way that it maintains the flow pattern of LAD1 but is defined such that the net amount of flow leaving the lumen was zero. A Poiseuille parabolic profile was defined as a fully developed inlet luminal flow boundary conditions
| (7) |
Fig. 2.
Two test flow profiles were examined. The first used literature values for normalized flow in the human left anterior descending coronary artery (LAD1) and has a net positive mean flow during a single cardiac cycle. The second (LAD2) was a contrived construct adjusted to create zero net mean flow.
Here, vin is the pulsatile inlet velocity, 〈v〉 is the cycle-averaged inlet velocity, r is the radial distance from the arterial wall, R is the radius of the arterial lumen, ω is the cardiac frequency, t is the flow time and F (ωt) is the pulsatility function of the LAD. The two waveforms differ only in magnitude where 〈LAD1〉 = Qmean and 〈LAD2〉 = 0. Qmean is the physiologically realistic average flow rate per time period for the LAD [26]. Based on these values, the Womersley number for both the waveforms is .
2.3. Mesh and time dependence studies
Mesh and time step convergence studies supported the fidelity of our numerical predictions. Cell density was greatest in regions closer to the stent strut and the tissue-blood interface, and the density within these regions doubled with successive simulations until convergence. Mesh convergence of the steady state simulations was defined as a less than 2% difference in volume-weighted average concentrations (VWAC) in the entire tissue for two successive mesh refinement iterations. The total cell count for this mesh independent case was 66120 and this value was used for all subsequent simulations. An under-relaxation factor of 0.7 guaranteed smooth convergence of mass transport residuals for these highly refined grids. Iterations for each steady state case were performed until there was at least 10−8-fold reduction in the mass transport residuals.
Time step independence was examined by considering the LAD1 flow waveform (Fig. 2) with time step increments 0.01, 0.02 and 0.04 seconds. A second order implicit unsteady formulation was used and all the simulations were allowed to converge for a minimum of 10000 iterations or 10−8-fold reduction in the mass transport residuals per time step. VWAC within the entire tissue was measured for these cases at the end of 60 seconds. A time step of 0.02 seconds was found to be sufficient to resolve temporal dependence where VWAC changed by less than 2% when the time step was halved.
2.4. Viscosity of blood at low shear rates
Stent implantation causes flow separation and recirculation regions characterized by low shear rates. In certain regimes within the milieu of the stent strut, the shear rate varies below 100 s−1 giving rise to non-Newtonian blood flow [13–16, 18, 19, 27]. With the aim of capturing such non-Newtonian flows, all the simulations performed accounted for dynamic blood viscosity using the Carreau model wherein effective viscosity falls with shear rate and is maximized in low shear domains,
| (8) |
Here μ is the effective blood viscosity, μ∞ = 0.035 g/cm.s and μ0 = 2.5 g/cm.s are the blood viscosities at infinite and zero shear rates, respectively, γ̇ is the shear rate, λ = 25 s is a time constant, and n = 0.25 is a power law index that parameterizes the steepness of shear dependent response [14, 15].
3. RESULTS AND DISCUSSION
Simulated flow profiles were characterized by their associated Reynolds number . For a mean velocity based on the pulsatile flow definition LAD1 (Fig. 2) and dimensions of an average left anterior descending coronary artery, laminar flow was maintained where the Reynolds number for this case was Re ~ 282 (Reo) at the inlet and Re ~ 484 at centerline peak flow velocity (vmax ~ 53.3 cm.s−1).
3.1. Steady state flow revisited
3.1.1. Luminal flow rate dictates flow disruption and drug deposition patterns
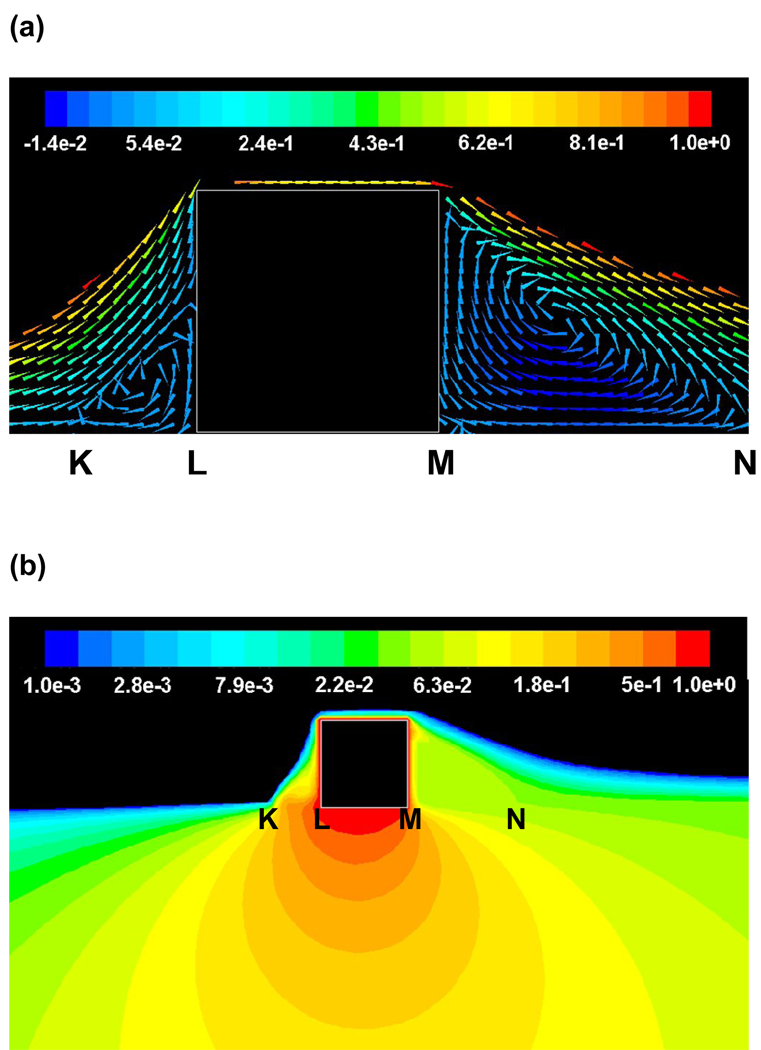
Steady state simulations confirmed that flow establishes two distinct recirculation zones proximal and distal to a strut that protrudes into the blood stream (Fig. 3a) [27]. Drug pooling in these zones effectively extends the contact between luminal drug and the underlying absorbing vascular tissue (Fig. 3b). Accordingly, modulation of flow affects the pattern of drug not simply the amount of drug that is absorbed and retained within the vessel wall. Physiologic flow is by its nature oriented, and even when pulsatile not identically cyclical. The directionality of the flow differentially affects the size of two recirculation zones and their drug delivery efficiencies. When the net flow in the arterial segment remains positive, the size of the proximal recirculation zone is smaller than the distal recirculation zone, but maintains a higher peak concentration at the mural interface. For the example depicted in Figs. 3a & 3b, the proximal zone was almost ~ 3-fold shorter than the distal zone but maintained ~ 7-fold higher mean luminal drug concentration than the distal zone. These predictions were significantly altered when the flow rate was increased or decreased by an order of magnitude (Fig. 4) and revealed significant differences between the proximal and distal zones.
Fig. 3.
(a) Steady state flow (Re ~ 282, also denoted as Reo) establishes recirculation zones proximal and distal to the stent strut (Units – cm.s−1). Footprints of these zones (KL and MN, respectively) are shown on the mural interface. (b) Steady state drug concentrations (log scale) within the lumen and the tissue reveal an asymmetry between regions distal and proximal to the strut.
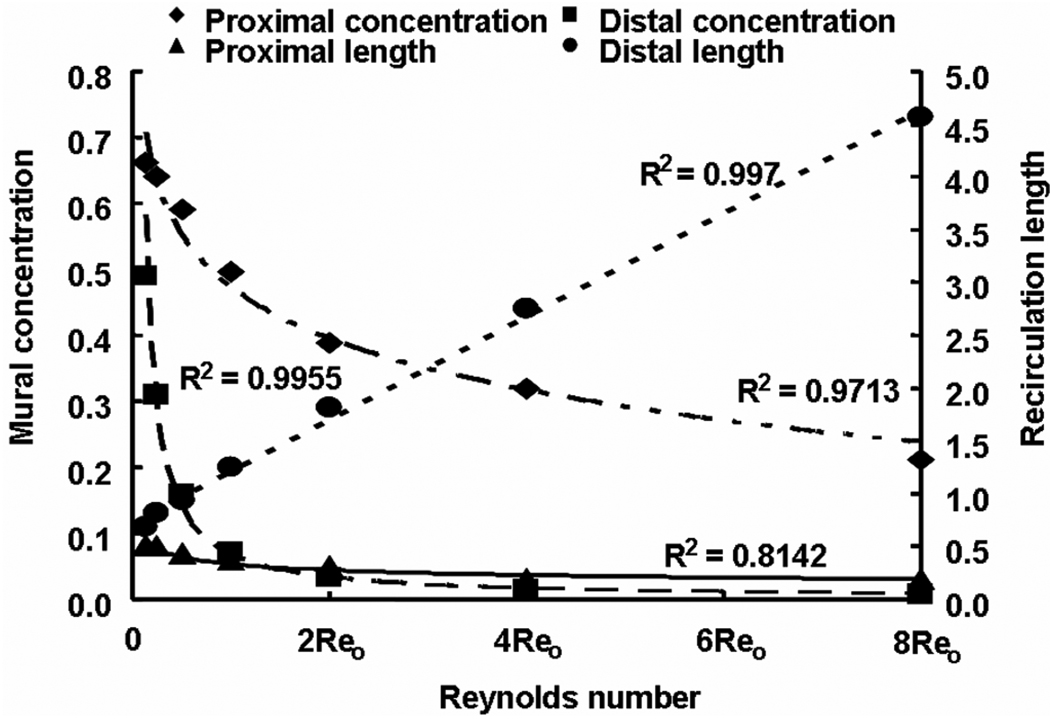
Fig. 4.
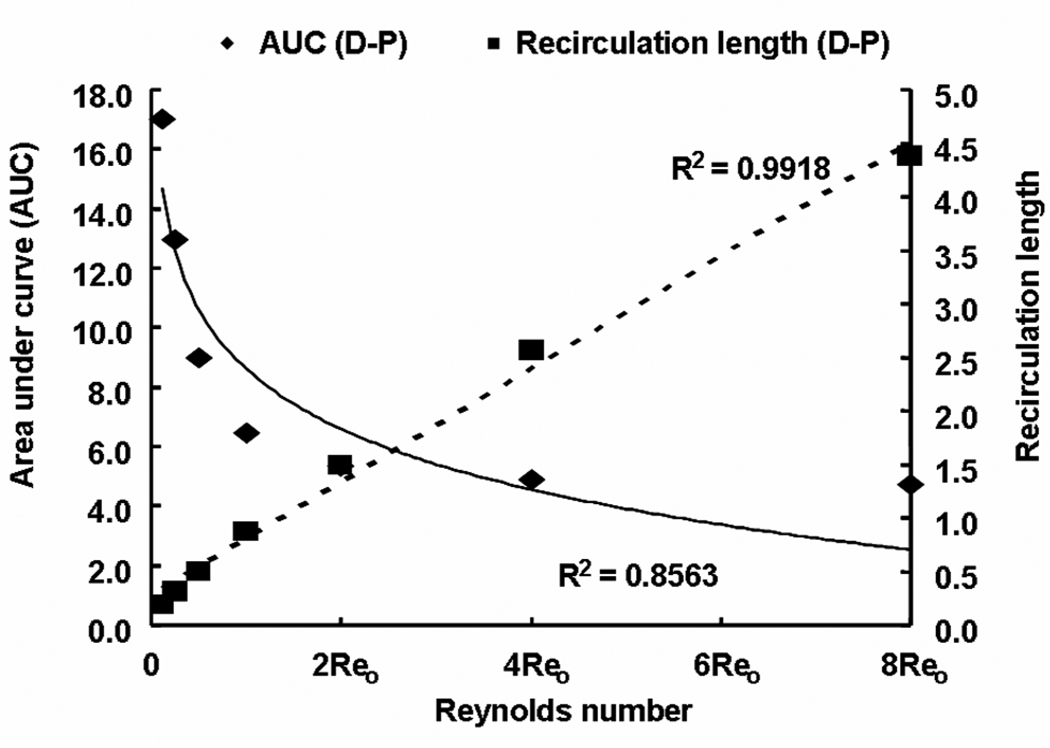
Drug concentration at the mural interface is higher at the proximal side but extends further at the distal side because distal recirculation length increased linearly with Reynolds number. Reo is the Reynolds number with respect to the steady state flow case evaluated in Sections 2.5 and 3.1.1.
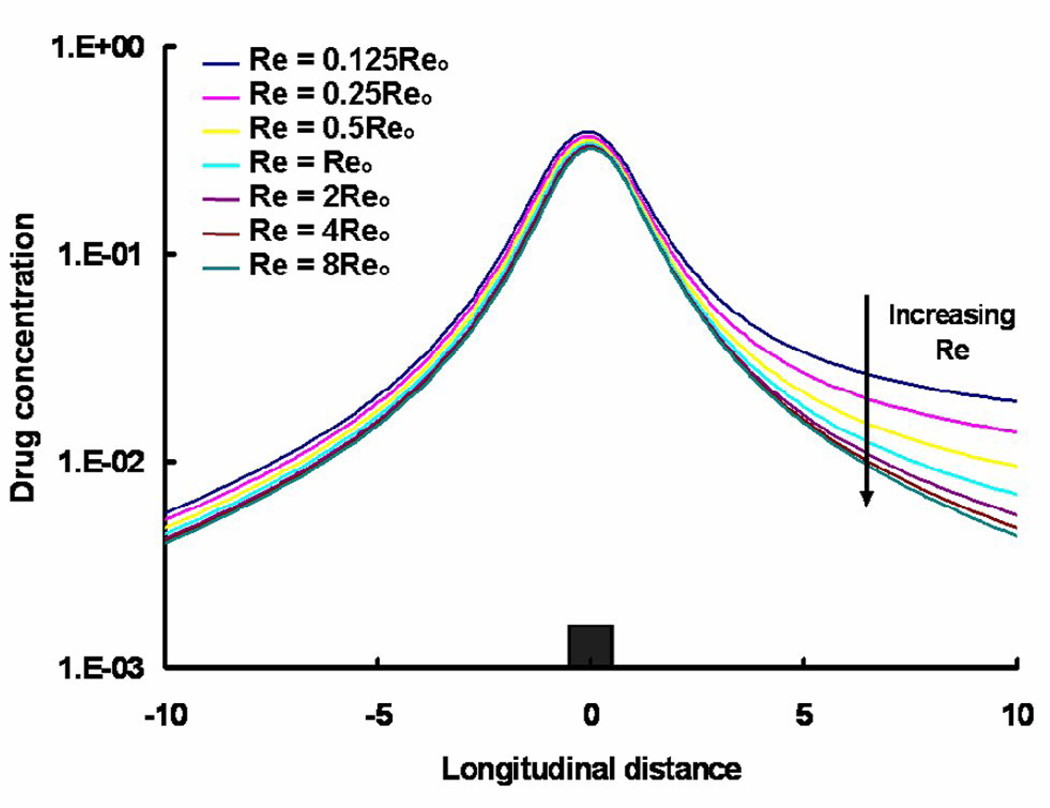
The mean mural concentration of the distal zone tracks flow in an inverse manner, and the length of the recirculation zone increases in a linear fashion (Fig. 4). The proximal zone is affected entirely differently. While the proximal zone is created by a fixed obstruction in the flow stream, the distal zone is established by flow reconstitution after separation of flow by the strut. The mean mural concentration in the proximal zone also scaled inversely with the flow rate (Fig. 4), yet the mural footprint of the proximal zone shortened rather with increasing Re such that the difference between the mural footprints of the distal and proximal zones varied linearly with flow (Fig. 5). Interestingly, drug distribution within the tissue beneath the recirculation zones decreased more substantially distally than proximally (Fig. 5 & Fig. 6). In other words, asymmetry in the tissue drug distribution profiles with respect to the stent strut decreased with increase in Re (Fig. 6). These observations indicate that drug dilution and its corresponding flow-mediated deposition are more evident within the distal recirculation zone due to increase in its dimensions with flow. However, the total drug uptake, accounted as VWAC, within the entire tissue decreased (~ 5.4-fold) because of increased wash-out of drug in the lumen.
Fig. 5.
Flow rate affects recirculation mediated drug delivery. Asymmetry in flow denoted as the absolute difference in sizes of proximal and distal recirculation zones increased linearly with flow. Note that all the recirculation lengths were normalized with respect to the strut width. However, asymmetry in drug uptake denoted as the difference in areas under curve (AUC) between proximal and distal zones decreased with increase in Reynolds number.
Fig. 6.
Variation in the free drug concentrations (log scale) with Reynolds number at one strut depth below the mural surface is shown. Reo denotes the Reynolds number with respect to the steady state case evaluated in Sections 2.5 and 3.1.1. , where Δx is the cell size and C is the normalized drug concentration. The integral is performed over a length (20 struts) along the longitudinal direction of the vessel.
3.1.2. Intrinsic strut design dictates extent of flow mediation
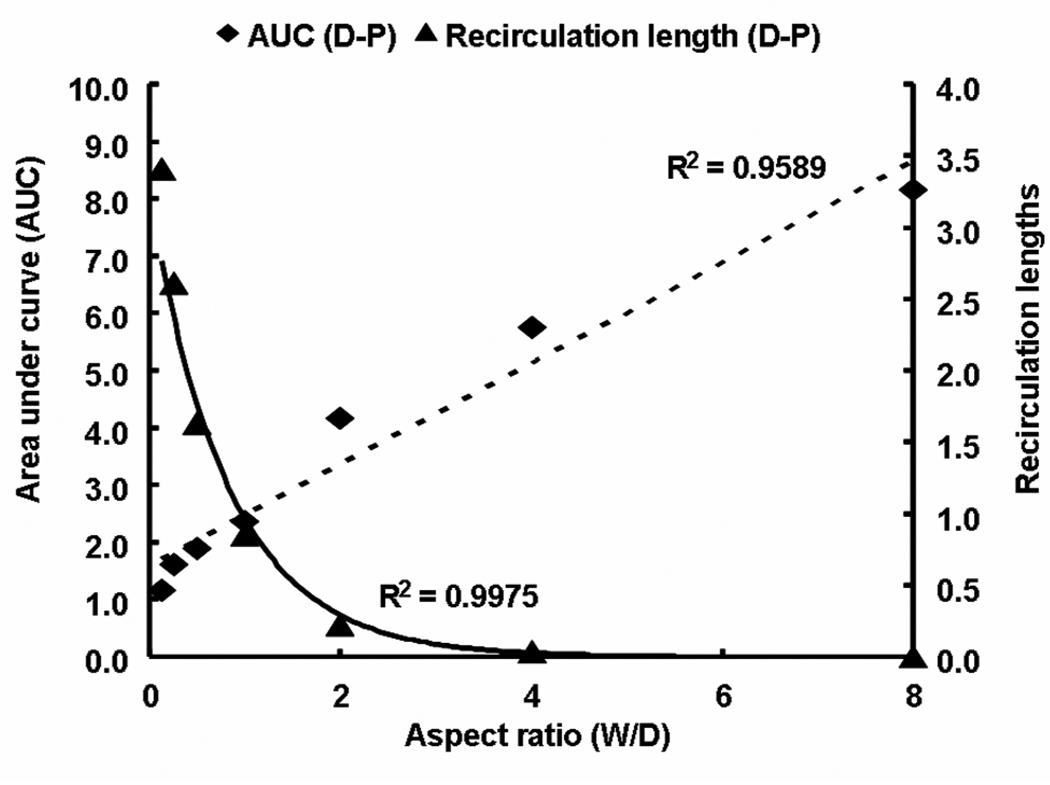
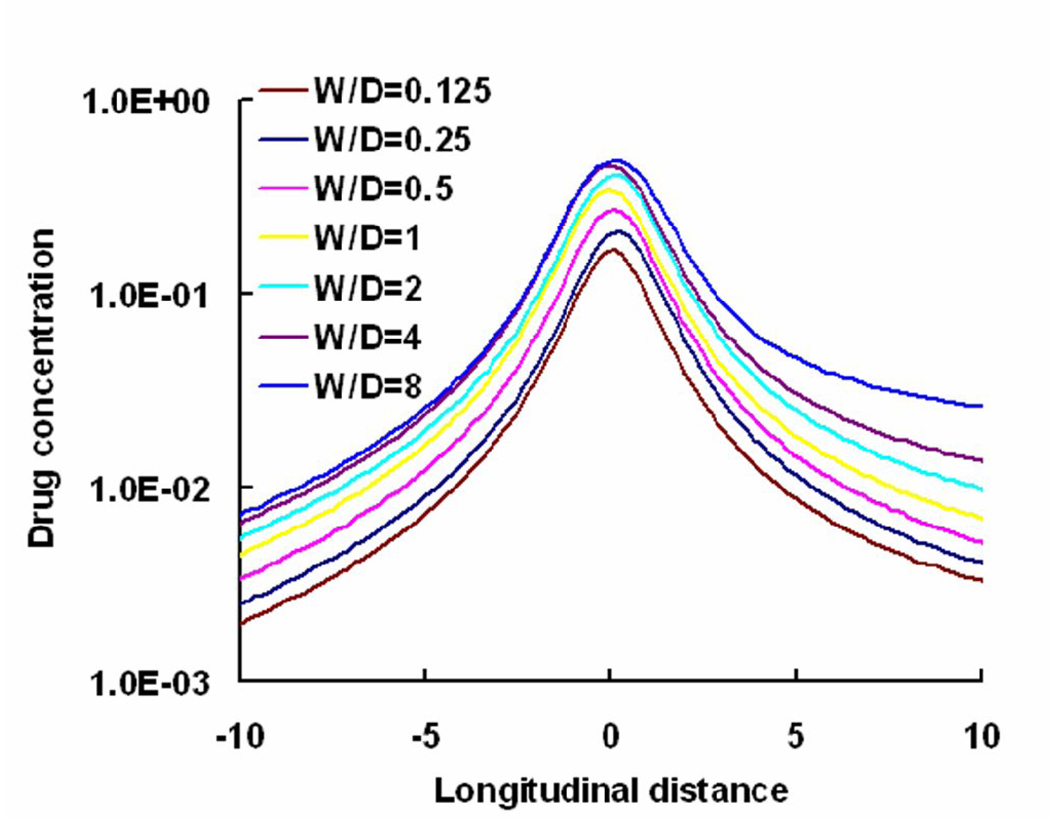
Local flow disruptions are determined by the strut geometry. Thus, the aspect ratio of the stent strut that normalizes strut width to its height (W/D) can be used to contrast contact-mediated drug transport from the strut base to flow-mediated effects from non-apposed strut surfaces. In addition, changes in aspect ratio of the strut also modulate the ratio of non-apposed to apposed drug sources (ζ = 1+2D/W). Wider stent struts will have greater direct contact with the wall and at the extreme, where they lay flat against the wall, there will be minimal flow disruption and minimal asymmetry in drug tissue uptake proximal and distal to the stent. Such struts presumably drive more drug into the wall through diffusion alone as the aspect ratio decreases the amount of drug available to the free stream (ζ decreases). As stent struts increase in thickness, they protrude to a greater extent into the lumen with greater net variations in flow. Flow lengthens the distal circulation zone and increases the difference in size relative to the proximal zone generating a greater disparity between drug within tissue downstream and upstream of a stent strut. The same effects can be observed with changes in strut geometry. The higher the stent strut, the lower the aspect ratio, the greater the luminal protrusion and difference in the sizes of distal and proximal recirculation zones (Fig. 7). Decrease in the difference in sizes of the recirculation zones with aspect ratio also scale with ζ. As the aspect ratio falls, the concentration in the distal zone is diluted with increasing flow, the net deposition below the zone decreases and asymmetry in drug deposited about the stent strut is lost (Fig. 7 & Fig. 8). That variations in luminal flow patterns dictate the extent and asymmetry of drug deposition also implies that stent design is important in determining drug-elution effect. It is specifically the geometry and pattern of the stent struts that induce the local flow variations that determine the finer aspects of arterial wall drug deposition.
Fig. 7.
Intrinsic stent design affects drug delivery. Asymmetry in flow estimated as the absolute difference in sizes of proximal and distal recirculation zones decreased exponentially with increase in aspect ratio. However, asymmetry in drug uptake denoted as the difference in areas under curve (AUC) between proximal and distal zones increased linearly with aspect ratio. All the lengths were normalized with respect to the strut width and AUC was calculated at a depth of one strut into the tissue.
Fig. 8.
Free drug concentration (log scale) at one strut below the blood-tissue interface increased with aspect ratio (W/D). Note that the perimeter of the strut was held constant for all the depicted cases. Drug concentration was plotted in log scale and, the longitudinal distance from the lumen was normalized with respect to the strut width for the case W/D=1. Note that the W/D=1 case corresponds to Re=Reo case in Fig 4(b).
3.1.3. Sensitivity to transmural convection
To identify the contribution of transmural convective drug transport, numerical simulations were performed for two cases with and without convection in the tissue. VWAC of drug in the tissue increased by less than 1% when tissue convection was considered and was less than variations induced by mesh related error (not shown). This observation clearly indicates that convective drug transport within the tissue is negligible.
3.1.4. Influence of non-Newtonian properties on arterial drug distribution
Steady state simulations were performed to examine the impact of dynamic viscosity as modeled by the Carreau model on flow-mediated drug distribution. The Carreau model systematically captures potential pharmacologic effects on blood rheology, particularly within the recirculation zones. Shear rates below 100 s−1 were observed within the flow recirculation zones. Interestingly, VWAC in the tissue increased by only 3.5% when the Carreau model was used, and even less under transient flow conditions for shear rates even lower than 100 s−1.
3.2. Transient flow simulations
3.2.1. Axial asymmetry in drug deposition scales with net flow
Cyclical flow establishes periods in the cardiac cycle of relative flow deceleration and changes in recirculation zone dimensions and drug content. The distal recirculation zone elongates by more than 50% and the proximal zone shortens by 45% during the positive portions of the cycle (e.g. when net flow is positive) and reverses with flow reversal. Within the same time frame, mural concentrations in the proximal and the distal recirculation zones varied by 51% and 38%, respectively. As in steady flow, the length of the distal recirculation zone and the mural concentration of drug within the proximal zone track the direction and extent of flow. These relationships imply that net mass of drug within the zones, the product of length and concentration, remains essentially constant during each cycle; for each cycle of LAD1, the net mass of drug within the proximal and distal recirculation zones varies minimally (~ 6%). Moreover, these findings may also explain how flow variations can change the amount of drug deposited beneath the strut without changing the net amount of drug surrounding the strut.
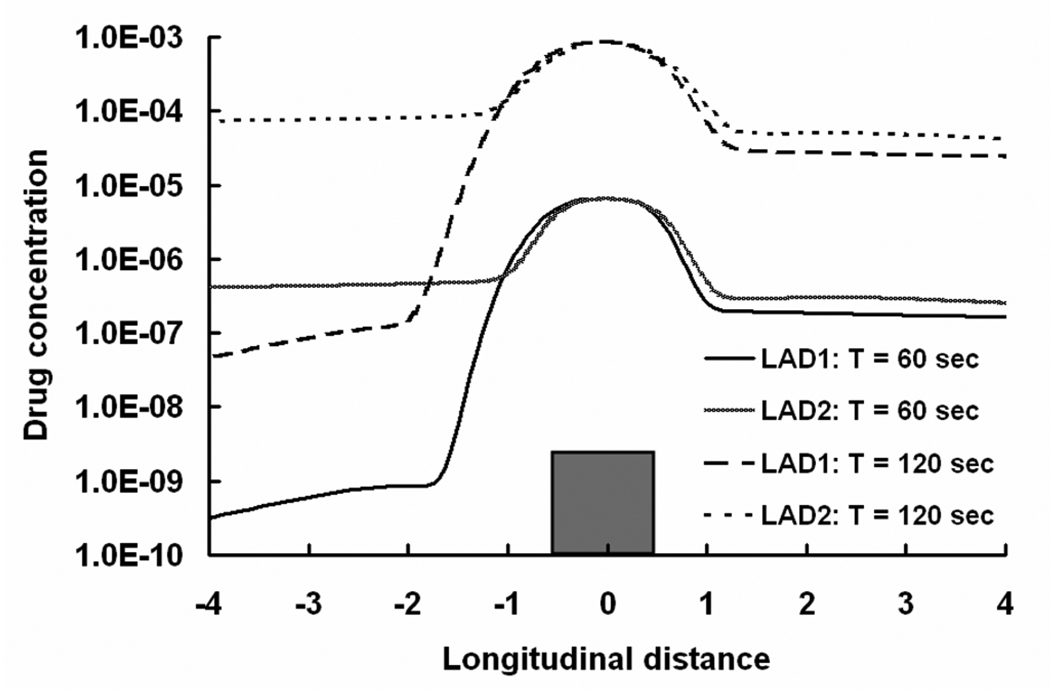
When the arterial flow is defined in a contrived and non-physiologic manner such that net positive and negative flows are equal (LAD2 in Fig. 2), there is no difference in the effect of flow on the length of the distal recirculation zone. Under symmetrical flow, the length of the proximal zone becomes sensitive to flow and the asymmetry in tissue deposition relative to the strut is lost (Fig. 9). In other words, only physiologic flow with net positive flow establishes the observed asymmetry in the recirculation zones adjacent to the stent struts. What does change however is the efficiency of drug delivery from the recirculation zones. The proximal zone can approach the function of the distal zone but will always be inferior as long as there is net positive flow. The proximal zone serves as a flow reconstitution zone and elongates with flow during the negative part of the cycle but will never be subject to the same extent of flow dilution because when flow transitions to positive again, the proximal zone once again imposes a flow barrier. This barrier is only present in the distal zone with change in flow direction. Thus, bidirectional flow can induce both types of flow separations on either side of the stent strut. There is systemic dilution during reconstitution of flow only in the distal recirculation zone and not in the proximal zone. As a consequence, drug delivery from the zones is more efficient proximally than distally under bidirectional flow. Indeed, the volume weighted average concentration of drug in the lumen is 3.67-fold higher and the tissue uptake is 1.7-fold greater with the equi-directional flow than with primarily positive flow. The latter flow profile tends to draw more drug into the flow stream where it is carried away from the struts and as the lumen level falls the amount that is driven into the tissue is reduced as well. These simulations further imply that the cyclical nature of coronary flow enhances drug uptake after stent elution and may account for lesser efficacy in vessels with more steady flow.
Fig. 9.
Arterial free drug concentration profiles (log scale) for two different LAD flow profiles at one strut below the luminal interface is shown. The longitudinal distance is normalized with respect to the width of the stent strut.
3.2.2. Convergence to the steady state flow limit
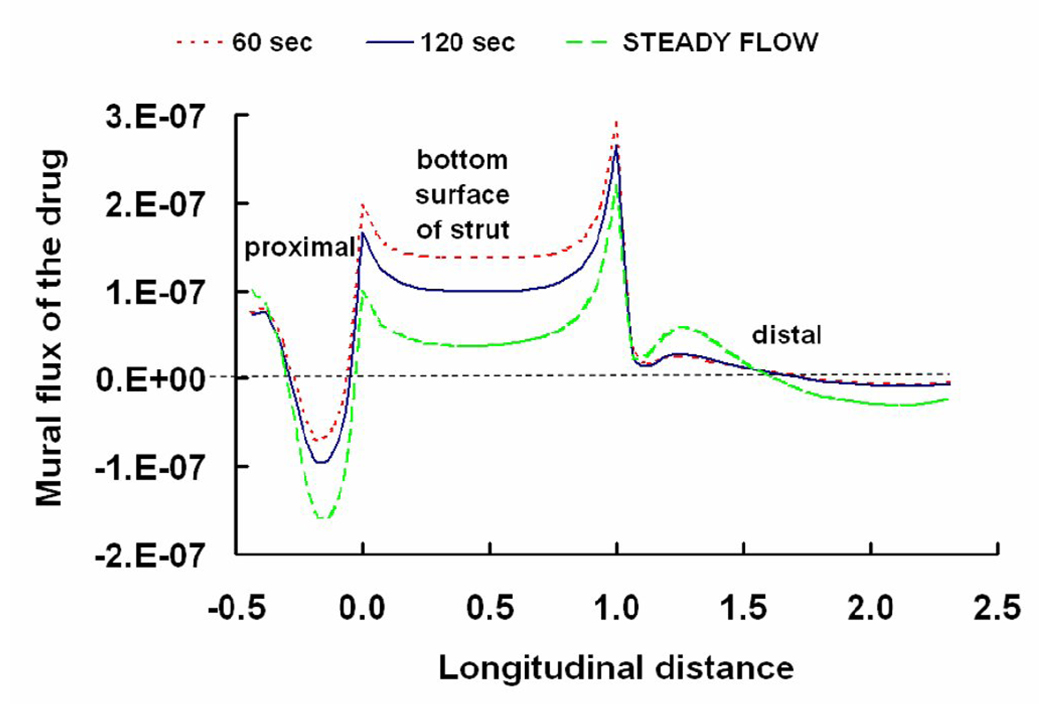
Steady state drug concentrations in the arterial wall may take days to months to realize. Yet the need to resolve the coupled effects of flow and diffusion on local drug concentrations during each cardiac cycle poses a daunting computational burden and forced us to limit our simulations to short times. It is therefore natural to ask what if anything our transient simulations can teach us about drug deposition at longer times. Remarkably, we predicted that the instantaneous flux of drug that enters the arterial tissue at the mural interface is well approximated by the corresponding steady state simulations (Fig. 10). Thus, at any point in time, local flow patterns are in a state of dynamic equilibrium with the inlet flow and affect drug delivery according to the principles we elucidated for steady state flow conditions. Our findings therefore emphasize that the quality and quantity of drug delivery from stents is intimately dependent on local flow dynamics, yet they also suggest that steady state flow models can provide useful insights into these processes.
Fig. 10.
Dynamic variations in fluxes (kg/s) of drug that enter the artery at the mural interface are shown. Instantaneous fluxes changing with time are shown to be scaled with the corresponding steady state simulations. Thus, the transient flux quickly converges to its steady state limit. The longitudinal distance is normalized with respect to the width of the stent strut and the flux is directed from the lumen to the tissue. The “steady flow” plot corresponds to the simulations performed at a constant Reynolds number (Reo = 282) as shown in Sections 2.5 and 3.1.1.
4. STUDY LIMITATIONS AND FUTURE WORK
Computational modeling enabled predictions of flow-dependent variations in drug distribution patterns adjacent to DES. As in all models, the value of the findings is when clinical and/or animal data do not exist or cannot be determined. It is hoped that our predictions will stimulate further research to establish such in vivo validation. Similarly, modeling requires simplifications and assumptions. Drug concentration was assumed to be continuous across the blood-solid interfaces, a reasonable assumption only if the drug solubilites are similar in the lumen and the tissue. In reality, hydrophobic drugs preferentially partition into arterial tissue. Such discontinuities of the concentration across interfaces are easily incorporated into our model by introducing partition coefficients [1, 28]. For the healthy arterial wall morphology considered here, partition coefficients would change the scale but not the pattern of predicted tissue concentrations. Where such preferential partitioning might affect the patterns of drug deposition is in anisotropic tissues such as diseased vessels with potentially deformed tunical layers. We have already shown the impact of clot over stent struts on drug release [29] and current research seeks to define how components of the arterial wall differentially bind delivered drug. Our current model discounted the complexities of arterial wall morphology and lesion geometry. As data become available they can be integrated into a model that accounts for arterial state and disruption, drug concentration discontinuities and slip-boundary conditions [23]. Also, computer models can facilitate in understanding the role of luminal flow on drug release [30] and subsequent arterial uptake when latest drug coating technologies [31] on novel biodegradable polymers [32–35] are employed in stent-based delivery.
5. CONCLUSIONS
Computational modeling is increasingly used to consider the development, clinical potential and regulatory approval of endovascular stents. Idealized computer models can facilitate mechanistic understanding of stent-based drug delivery at a resolution that is impossible to achieve in vivo. Stent struts obstruct baseline luminal blood flow and thereby create local flow disruptions in a manner that follows principles of fluid dynamics. These disturbances can be established by changes in flow, arterial dimensions, and stent geometry, and importantly are amenable to computational modeling. The impact of flow on drug distribution might explain the differential effects in diverse vascular beds and the impact of stent design on drug-elution performance. Computational studies can also predict the sensitivity of drug distribution patterns to clinical variables such as degree of strut embedding, strut positioning and pharmacologic effects on blood viscosity. Near wall flow perturbations caused due to the presence of a stent should not be viewed simply as an unwanted side-effect but rather as a design parameter that could be modulated to optimize flow-mediated drug delivery.
ACKNOWLEDGMENTS
The study was supported by a grant from the NIH (R01 HL-49039). The authors thank ANSYS Inc. for generously providing Fluent & Gambit licenses. VBK thanks T. Shazly and Drs. K. A. Smith, K. Kolandaivelu, L. M. Porto and B. Balakrishnan for many useful discussions and suggestions.
Footnotes
Publisher's Disclaimer: This is a PDF file of an unedited manuscript that has been accepted for publication. As a service to our customers we are providing this early version of the manuscript. The manuscript will undergo copyediting, typesetting, and review of the resulting proof before it is published in its final citable form. Please note that during the production process errors may be discovered which could affect the content, and all legal disclaimers that apply to the journal pertain.
REFERENCES
- 1.Hwang CW, Wu D, Edelman ER. Physiological transport forces govern drug distribution for stent-based delivery. Circulation. 2001;104(5):600–605. doi: 10.1161/hc3101.092214. [DOI] [PubMed] [Google Scholar]
- 2.Luscher TF, Steffel J, Eberli FR, Joner M, Nakazawa G, Tanner FC, Virmani R. Drug-eluting stent and coronary thrombosis: biological mechanisms and clinical implications. Circulation. 2007;115(8):1051–1058. doi: 10.1161/CIRCULATIONAHA.106.675934. [DOI] [PubMed] [Google Scholar]
- 3.Finn AV, Kolodgie FD, Harnek J, Guerrero LJ, Acampado E, Tefera K, Skorija K, Weber DK, Gold HK, Virmani R. Differential response of delayed healing and persistent inflammation at sites of overlapping sirolimus- or paclitaxel-eluting stents. Circulation. 2005;112(2):270–278. doi: 10.1161/CIRCULATIONAHA.104.508937. [DOI] [PubMed] [Google Scholar]
- 4.Finkelstein A, McClean D, Kar S, Takizawa K, Varghese K, Baek N, Park K, Fishbein MC, Makkar R, Litvack F, Eigler NL. Local drug delivery via a coronary stent with programmable release pharmacokinetics. Circulation. 2003;107(5):777–784. doi: 10.1161/01.cir.0000050367.65079.71. [DOI] [PubMed] [Google Scholar]
- 5.Joner M, Finn AV, Farb A, Mont EK, Kolodgie FD, Ladich E, Kutys R, Skorija K, Gold HK, Virmani R. Pathology of drug-eluting stents in humans: delayed healing and late thrombotic risk. J Am Coll Cardiol. 2006;48(1):193–202. doi: 10.1016/j.jacc.2006.03.042. [DOI] [PubMed] [Google Scholar]
- 6.Finn AV, Nakazawa G, Joner M, Kolodgie FD, Mont EK, Gold HK, Virmani R. Vascular responses to drug eluting stents: importance of delayed healing. Arterioscler Thromb Vasc Biol. 2007;27(7):1500–1510. doi: 10.1161/ATVBAHA.107.144220. [DOI] [PubMed] [Google Scholar]
- 7.Kuchulakanti PK, Chu WW, Torguson R, Ohlmann P, Rha SW, Clavijo LC, Kim SW, Bui A, Gevorkian N, Xue Z, Smith K, Fournadjieva J, Suddath WO, Satler LF, Pichard AD, Kent KM, Waksman R. Correlates and long-term outcomes of angiographically proven stent thrombosis with sirolimus- and paclitaxel-eluting stents. Circulation. 2006;113(8):1108–1113. doi: 10.1161/CIRCULATIONAHA.105.600155. [DOI] [PubMed] [Google Scholar]
- 8.Balakrishnan B, Tzafriri AR, Seifert P, Groothuis A, Rogers C, Edelman ER. Strut position, blood flow, and drug deposition: implications for single and overlapping drug-eluting stents. Circulation. 2005;111(22):2958–2965. doi: 10.1161/CIRCULATIONAHA.104.512475. [DOI] [PubMed] [Google Scholar]
- 9.Rogers C, Edelman ER. Endovascular stent design dictates experimental restenosis and thrombosis. Circulation. 1995;91(12):2995–3001. doi: 10.1161/01.cir.91.12.2995. [DOI] [PubMed] [Google Scholar]
- 10.Akagawa E, Ookawa K, Ohshima N. Endovascular stent configuration affects intraluminal flow dynamics and in vitro endothelialization. Biorheology. 2004;41(6):665–680. [PubMed] [Google Scholar]
- 11.Balakrishnan B, Dooley JF, Kopia G, Edelman ER. Intravascular drug release kinetics dictate arterial drug deposition, retention, and distribution. J Control Release. 2007;123(2):100–108. doi: 10.1016/j.jconrel.2007.06.025. [DOI] [PMC free article] [PubMed] [Google Scholar]
- 12.Balakrishnan B, Dooley J, Kopia G, Edelman ER. Thrombus causes fluctuations in arterial drug delivery from intravascular stents. J Control Release. 2008 doi: 10.1016/j.jconrel.2008.07.027. [DOI] [PMC free article] [PubMed] [Google Scholar]
- 13.Benard N, Perrault R, Coisne D. Computational approach to estimating the effects of blood properties on changes in intra-stent flow. Ann Biomed Eng. 2006;34(8):1259–1271. doi: 10.1007/s10439-006-9123-7. [DOI] [PubMed] [Google Scholar]
- 14.Seo T, Schachter LG, Barakat AI. Computational study of fluid mechanical disturbance induced by endovascular stents. Ann Biomed Eng. 2005;33(4):444–456. doi: 10.1007/s10439-005-2499-y. [DOI] [PubMed] [Google Scholar]
- 15.Chien S, Usami S, Taylor HM, Lundberg JL, Gregersen MI. Effects of hematocrit and plasma proteins on human blood rheology at low shear rates. J Appl Physiol. 1966;21(1):81–87. doi: 10.1152/jappl.1966.21.1.81. [DOI] [PubMed] [Google Scholar]
- 16.Benard N, Coisne D, Donal E, Perrault R. Experimental study of laminar blood flow through an artery treated by a stent implantation: characterisation of intra-stent wall shear stress. Journal of biomechanics. 2003;36(7):991–998. doi: 10.1016/s0021-9290(03)00068-x. [DOI] [PubMed] [Google Scholar]
- 17.Moore J, Jr, Berry JL. Fluid and solid mechanical implications of vascular stenting. Ann Biomed Eng. 2002;30(4):498–508. doi: 10.1114/1.1458594. [DOI] [PubMed] [Google Scholar]
- 18.Johnston BM, Johnston PR, Corney S, Kilpatrick D. Non-Newtonian blood flow in human right coronary arteries: steady state simulations. Journal of biomechanics. 2004;37(5):709–720. doi: 10.1016/j.jbiomech.2003.09.016. [DOI] [PubMed] [Google Scholar]
- 19.Johnston BM, Johnston PR, Corney S, Kilpatrick D. Non-Newtonian blood flow in human right coronary arteries: transient simulations. Journal of biomechanics. 2006;39(6):1116–1128. doi: 10.1016/j.jbiomech.2005.01.034. [DOI] [PubMed] [Google Scholar]
- 20.Lovich MA, Creel C, Hong K, Hwang CW, Edelman ER. Carrier proteins determine local pharmacokinetics and arterial distribution of paclitaxel. J Pharm Sci. 2001;90(9):1324–1335. doi: 10.1002/jps.1085. [DOI] [PubMed] [Google Scholar]
- 21.Tada S, Tarbell JM. Fenestral pore size in the internal elastic lamina affects transmural flow distribution in the artery wall. Ann Biomed Eng. 2001;29(6):456–466. doi: 10.1114/1.1376410. [DOI] [PubMed] [Google Scholar]
- 22.Creel CJ, Lovich MA, Edelman ER. Arterial paclitaxel distribution and deposition. Circ Res. 2000;86(8):879–884. doi: 10.1161/01.res.86.8.879. [DOI] [PubMed] [Google Scholar]
- 23.Das B, Batra RL. Non-Newtonian flow of blood in an arteriosclerotic blood vessel with rigid permeable walls. J Theor Biol. 1995;175(1):1–11. doi: 10.1006/jtbi.1995.0115. [DOI] [PubMed] [Google Scholar]
- 24.Vandoormaal JP, Raithby GD. Enhancements of the Simple Method for Predicting Incompressible Fluid-Flows. Numerical Heat Transfer. 1984;7(2):147–163. [Google Scholar]
- 25.Kolachalama VB, Bressloff NW, Nair PB. Mining data from hemodynamic simulations via Bayesian emulation. Biomedical engineering online. 2007;6:47. doi: 10.1186/1475-925X-6-47. [DOI] [PMC free article] [PubMed] [Google Scholar]
- 26.Ku DN, Zhu C. In: Hemodynamic Forces and Vascular Cell Biology. Sumpio BE, editor. Austin: R. G. Landes Company; 1993. pp. 1–23. [Google Scholar]
- 27.Berry JL, Santamarina A, Moore JE, Jr, Roychowdhury S, Routh WD. Experimental and computational flow evaluation of coronary stents. Ann Biomed Eng. 2000;28(4):386–398. doi: 10.1114/1.276. [DOI] [PubMed] [Google Scholar]
- 28.Hwang CW, Wu D, Edelman ER. Impact of transport and drug properties on the local pharmacology of drug-eluting stents. Int J Cardiovasc Intervent. 2003;5(1):7–12. doi: 10.1080/14628840304614. [DOI] [PubMed] [Google Scholar]
- 29.Hwang CW, Levin AD, Jonas M, Li PH, Edelman ER. Thrombosis modulates arterial drug distribution for drug-eluting stents. Circulation. 2005;111(13):1619–1626. doi: 10.1161/01.CIR.0000160363.30639.37. [DOI] [PubMed] [Google Scholar]
- 30.Acharya G, Park K. Mechanisms of controlled drug release from drug-eluting stents. Adv Drug Deliv Rev. 2006;58(3):387–401. doi: 10.1016/j.addr.2006.01.016. [DOI] [PubMed] [Google Scholar]
- 31.Chen MC, Liang HF, Chiu YL, Chang Y, Wei HJ, Sung HW. A novel drug-eluting stent spray-coated with multi-layers of collagen and sirolimus. J Control Release. 2005;108(1):178–189. doi: 10.1016/j.jconrel.2005.07.022. [DOI] [PubMed] [Google Scholar]
- 32.Unger F, Westedt U, Hanefeld P, Wombacher R, Zimmermann S, Greiner A, Ausborn M, Kissel T. Poly(ethylene carbonate): a thermoelastic and biodegradable biomaterial for drug eluting stent coatings? J Control Release. 2007;117(3):312–321. doi: 10.1016/j.jconrel.2006.11.003. [DOI] [PubMed] [Google Scholar]
- 33.Steendam R, van der Laan A, Hissink D. Bioresorbable drug-eluting stent coating formulations based on SynBiosys biodegradable multi-block copolymers. J Control Release. 2006;116(2):e94–e95. doi: 10.1016/j.jconrel.2006.09.068. [DOI] [PubMed] [Google Scholar]
- 34.Westedt U, Wittmar M, Hellwig M, Hanefeld P, Greiner A, Schaper AK, Kissel T. Paclitaxel releasing films consisting of poly(vinyl alcohol)-graft-poly(lactide-co-glycolide) and their potential as biodegradable stent coatings. J Control Release. 2006;111(1–2):235–246. doi: 10.1016/j.jconrel.2005.12.012. [DOI] [PubMed] [Google Scholar]
- 35.Pan Ch J, Tang JJ, Weng YJ, Wang J, Huang N. Preparation, characterization and anticoagulation of curcumin-eluting controlled biodegradable coating stents. J Control Release. 2006;116(1):42–49. doi: 10.1016/j.jconrel.2006.08.023. [DOI] [PubMed] [Google Scholar]


