

Abstract
Background
Behavioral undercontrol may contribute to risk for alcoholism in vulnerable persons. We predicted that healthy young adults with a family history of alcoholism (FH+) who also displayed externalizing behavior characteristics (low scores on the California Psychological Inventory Sociability Scale; CPI-So) would exhibit more impulsive responding (false alarms) on a Go-NoGo reaction time task.
Methods
Subjects were 230 healthy volunteers, 18 to 30 years of age with no history of alcohol or drug dependence. The task included 100 trials: 60 of “Go,” calling for a button press, and 40 of “NoGo,” or “XX,” calling for inhibiting a response. Data analysis involved a signal detection analysis of performance with subsequent group comparisons for rates of impulsive responding indicated by False Alarms (responses to NoGo signals).
Results
CPI-So scores were lower in FH+ than in FH– (p < .000001) indicating a greater clustering of disinhibitory tendencies in these persons. FH, CPI-So scores, and Gender together predicted false alarm rates, accounting for 4.9% of the variance, F = 3.89, p = 0.009. False alarms were associated with low CPI-So scores, F = 5.15, p = 0.024, and being male, F = 6.27, p = 0.013, but not with FH once these variables were accounted for.
Conclusions
A disinhibited temperament may underlie a behavioral impulsivity that contributes to elevated risk for future alcoholism, especially among FH+ males.
Keywords: Impulsivity, Behavioral Undercontrol, Family History of Alcoholism, Males, Signal Detection Theory, Oklahoma Family Health Patterns Project
The 12-Month Prevalence of DSM-IV alcohol abuse and dependence in the United States was 8.46% in 2001 to 2002, affecting approximately 17.6 million people (Grant et al., 2004). White males, 18 to 44 years of age, was the largest affected group, with prevalence rates approximately twice those of same-age white females (Grant et al., 2004). Alcohol contributes to 25% of accidental deaths (Sutocky et al., 1993) making it desirable to identify characteristics that predispose individuals toward alcohol problems. Twin-adoption studies provide evidence of a genetic risk for alcoholism (Cloninger et al., 1981), and a positive family history (FH+) predicts problem drinking patterns and 2 to 4 times the risk for future alcoholism (Lieb et al., 2002; Merikangas et al., 1998). In order to examine premorbid factors unconfounded by consequences of heavy drinking, we established the Oklahoma Family Health Patterns project (OFHP), a long-term study designed to provide a broad base of information on psychological, behavioral, and physiological response characteristics in healthy, young-adult, offspring of alcoholic parents. In this paper, we examine behavioral impulsivity as manifested by rates of false alarms in a Go-NoGo psychomotor task.
Impulsivity and disinhibitory tendencies may be closely associated with risk for alcoholism. Cloninger and colleagues have shown that FH+ children who later developed drinking problems had premorbid signs of behavioral disinhibition, seen as low harm avoidance along with novelty seeking and impulsivity (Cloninger, 1987). Likewise, Sher and colleagues reported that healthy, FH+ college students exhibited impulsiveness, aggressiveness, and sensation seeking, a pattern that they termed “behavioral under-control” (Sher, 1991). Tarter and colleagues described adolescent male offspring of substance abusing fathers, as exhibiting a pattern of “neurobehavioral disinhibition” and psychological dysregulation (Tarter, 2002; Tarter et al., 1985). These terms characterize externalizing tendencies that appear with greater frequency in FH+ than in FH–and which could represent a core, inherited behavioral disposition associated with vulnerability to future alcoholism (Krueger et al., 2002).
Among externalizing traits, impulsivity underlies poor planning and unreflective, reckless, abrupt, and inappropriate behaviors that may lead to negative outcomes (Finn et al., 1999). Temperament characteristics of subjects in the OFHP cohort suggest a differential clustering of externalizing tendencies in FH+ persons; the FH+ have scored consistently lower than the FH– on the Sociability Scale of the California Psychological Inventory (CPI-So) (Gough, 1994). Low scores on this scale (<30) suggest a tendency toward norm violation, impulsive decision-making, and lack of guilt for social offenses. In the present sample, 46% of FH+ subjects score <30 versus only 19% of the FH− do so, a differential proportion of nearly 2.5 (Table 1). The present study was done to determine the extent to which low CPI-So scores are associated with a behavioral manifestation of impulsivity.
Table 1.
Sample Characteristics
| Family history | Negative | Positive | ||||||
|---|---|---|---|---|---|---|---|---|
| CPI-So group | High | Low | High | Low | p values for group comparisons | |||
| n (F) | 94 (53) | 22 (8) | 61 (45) | 53 (28) | All | Hi− vs. Lo+ | FH | CPI-So |
| Age (year) | 23.6 (.5) | 22.8 (1.0) | 23.2 (.6) | 24.3 (.7) | NS | NS | NS | NS |
| SES | 48.7 (1.4) | 51.5 (2.8) | 41.0 (1.8) | 41.7 (1.8) | 0.0002 | 0.01 | 0.0001 | NS |
| Education (year) | 15.6 (.2) | 15.2 (.4) | 15.4 (.2) | 14.4 (.3) | 0.007 | 0.004 | 0.032 | 0.002 |
| Shipley vocabulary | 31 (.4) | 29 (.8) | 30 (.5) | 29 (.5) | 0.079 | NS | NS | 0.01 |
| BDI | 3.4 (.5) | 6.1 (.9) | 4.6 (.6) | 7.1 (.6) | 0.0001 | 0.0001 | 0.002 | 0.0001 |
| EPI – Neuroticism | 4.9 (.4) | 5.7 (.9) | 5.9 (.5) | 7.4 (.6) | 0.005 | 0.002 | 0.005 | 0.006 |
| Caffeine (mg/d) | 110 (14) | 110 (30) | 104 (18) | 153 (19) | NS | NS | NS | NS |
| AUDIT | 2.5 (.3) | 3.3 (.6) | 3.2 (.4) | 3.9 (.4) | 0.052 | 0.035 | 0.026 | NS |
| Cahalan (oz/mo) | 35 (4) | 38 (8) | 46 (5) | 52 (5) | 0.048 | 0.044 | 0.007 | NS |
| Tobacco (% using weekly) | 5 | 23 | 10 | 26 | 0.0013 | 0.0003 | 0.04 | 0.0001 |
| Drug use (n) | 0 | 1 | 1 | 8 | ||||
| Failed drug screen (n) | 0 (0%) | 2 (8%) | 1 (1%) | 7 (12%) | ||||
Entries are M (SE) unless given otherwise.
All, p-values comparing all 4 risk groups using full multivariate model. Post-hoc Tukey comparisons as follows: Hi− vs. Lo+, Hi Risk vs. Lo Risk subgroups; FH, FH+ vs. FH− groups; CPI-So, California Personality Inventory Sociability scale scores <30 vs. ≥30; Tobacco use comparisons based on chi-square test. SES, Hollingshead and Redlich Socioeconomic Status score. All scores shown are considered “Middle Class.” Shipley, Shipley Institute of Living vocabulary score; BDI, Beck Depression Inventory; EPI, Eysenck Personality Inventory; Caffeine, caffeine consumption from all sources by structured interview; AUDIT, Alcohol Use Disorders Identification Test; Cahalan, estimated alcohol intake from volume and frequency reports by structured interview; Drug use, number of subjects in each group who reported “ever using” 1 or more of 11 categories of illicit or prescription psychoactive drugs other than alcohol; Failed Drug Screen, number of subjects and percentage of each group who failed a urine drug screen given on a scheduled day of testing.
We used a Go-NoGo reaction time task to test behavioral impulsivity. Finn found that alcohol exposure increased Go-NoGo false alarm rates in young adults with low working memory capacity, a presumed risk for alcoholism, although FH groups did not differ (Finn et al., 1999). False alarm rates were similarly higher in early-onset alcoholics with conduct disorder and low working memory capacity (Finn et al., 2002), indicating that impulsivity is associated with a common risk factor for alcoholism (conduct disorder) and with reduced ability for self-monitoring and behavioral self-regulation (low working memory capacity). Versions of the Go-NoGo task have also been found sensitive to impulsive traits in cigarette smokers (Mitchell, 2004), alcoholics with Axis II, Cluster B disorders (Dom et al., 2006), and in cocaine abusers (Verdejo-Garcia et al., 2007). The Go-NoGo task is a forced-choice reaction time task that demands rapid responses on Go signals and nonresponses on NoGo signals administered in a state of uncertainty, making it ideal to assess behavioral impulsivity (Mitchell, 2004). Signal Detection theory provides a framework within which to measure, analyze, and interpret the decision-making processes in the Go-NoGo task (Kornbrot, 2006). Neuroimaging studies supplement this behavioral evidence, providing insights into neuroanatomical regions associated with the decision-making process (Amodio and Frith, 2006).
Our finding that FH+ have much lower CPI-So scores than FH− suggests a greater tendency toward behavioral impulsivity and norm violation in this group. The greater prevalence of externalizing disorders in males compared to females suggests that these tendencies should be more pronounced in the male FH+ subgroup. Accordingly, we predicted that false alarm rate, a measure sensitive to impulsive responding in the Go-NoGo task, would be higher in FH+ relative to FH−, in those with lower CPI-So scores, and in males.
Methods
Participants
The sample included 112 FH+ and 118 FH− healthy young adults (133 females and 97 males), averaging 23 years of age (Table 1). Participants were recruited by advertisement and personal referral from the Oklahoma City community, local collages and technical schools. To achieve a diverse sample, ads were placed in a variety of community newspapers appealing to a range of demographic groups, as well as on the exteriors of city buses. We also used a television news spot and posters in public places. Participants, and parents who were contacted for family history information, all signed consent forms approved by the Institutional Review Board of the University of Oklahoma Health Sciences Center and the VA Medical Center. Participants were paid for taking part.
Recruitment and Screening
Persons calling to inquire about the project were asked if they were aware of their parents' and grandparents' drinking patterns and potential drinking problems. If they answered in the affirmative and were 18 to 30 years of age and indicated no personal history of severe alcohol or drug abuse or dependence, they were informed about the study and invited to the lab for a full screening. Among subjects undergoing screening in the lab, 62% were excluded for 3 primary reasons: (a) insufficient parent or family information or the family did not meet specific FH criteria; (b) the participant met criteria for a current alcohol or substance use disorder; or (c) the participant had a current depression or anxiety disorder or required psychotropic medication.
Family History of Alcoholism and Other Drug Problems
Family history of alcoholism status was established using the Family History Research Diagnostic Criteria (FH-RDC) (Andreasen et al., 1977), a structured interview with an interrater reliability of .95 for reports of substance use disorders (Andreasen et al., 1977; Mann et al., 1985; Zimmerman et al., 1988). Persons were considered FH+ if either biological parent met at least 2 of the possible 6 criteria for alcohol or substance abuse. Participants were excluded if they or the parent reported possible fetal exposure to alcohol or other drugs. Persons without a family history of alcoholism were those reporting an absence of alcohol or substance use disorders in their biological parents and grandparents. Parent interviews were successfully conducted for 78% of the participants reported here, and the parents confirmed the participants' FH reports in 89% of these interviews. Of the 11% of interviews yielding conflicting parent reports, one-third of the participants could be retained in the sample by reassigning their FH status, while the remaining two-thirds had to be dropped because of the interviewer's judgment of an unreliable parent report, lack of information about the grandparents, or other sources of unreliability. Therefore, 93% of the interviewed subsample could be considered accurately classified, the remainder having been discarded. Among the 22% of the sample without parent interviews, we infer that 89% are accurately classified. Together with the retained group with parent interviews, this yields an estimated correct classification rate of 91% of all participants included in this report, a figure consistent with other reliability estimates (Schuckit et al., 1995).
Physical and Mental Health, Alcohol and Drug Use, and Personality Assessments
Physical health was assessed by a structured medical history and self-report of current good health. Socioeconomic status (SES) was measured using updated occupational categories on the Hollingshead and Redlich scale (Hollingshead, 1975) and was based on the primary occupation of the main breadwinner in the household in which the participant grew up. Intelligence and absence of cerebral impairment were estimated from the vocabulary score on the Revised Shipley Institute of Living Scale (Zachary, 1986).
Behavioral undercontrol was assessed using the Sociability scale of the California Psychological Inventory (CPI-So) (Gough, 1994). The CPI-So scale is a 46-item measure of norm abiding and prosocial behavior intended to assess a person's ability to evaluate his or her own behavior from the perspective of another person. In addition to a lack of empathy, low-scoring persons are described by their peers as “impulsive, reckless, careless, defensive, headstrong, and disorderly” (Gough, 1994). Consequently, we interpret low scores as reflecting not only poor social connectedness but also an undercontrolled behavioral style. In comparison with other instruments, the CPI-So has especially high reliability in assessing antisocial behaviors in alcoholic patients (Cooney et al., 1990). In a previous analysis of 175 persons in the OFHP sample, FH+ as a group scored markedly lower than FH− on the CPI-So scale (28.5 ± 0.59 vs. 32.8 ± 0.49, t = 5.67, p < 0.0001) (Lovallo et al., 2006).
Based on our initial formulation that behaviorally undercon-trolled FH+ would be at highest risk of alcoholism and accordingly would display the greatest clustering of risk-associated behaviors, we used an a priori cutoff point of 30 to divide the FH groups into high and low CPI-So groups for descriptive purposes. A cutoff score of 30 has strong empirical validation, with scores ≥30 characterizing norm-abiding groups, such as research scientists (32.0) and nursing students (31.5). Scores <30 indicate increasingly deviant, norm-violating groups, such as infrequent and frequent marijuana smokers (28.7 and 26.3), shoplifters (27.9), and children of less- and more-severe alcoholics (27.4 and 25.1). Still lower scores are seen in alcoholics (22.8) and pathological gamblers (21.3) (Gough, 1994). Accordingly, we have assigned putative risk for future alcoholism to 4 groupings based on FH status and CPI-So cutoff score; FH+ with low CPI-So scores (<30) were deemed to be a High Risk subgroup, FH− with high CPI-So scores (≥30) were deemed to be a Low Risk subgroup, and FH− with low CPI-So and FH+ with high CPI-So were deemed moderate risk groups. As shown in Table 1, 96 subjects would be considered Low Risk and 52 as High Risk.
Absence of a significant psychiatric history was obtained by a certified research assistant using the Computerized Diagnostic Interview Schedule-IV (C-DIS-IV) (Bucholz et al., 1994) and the Beck Depression Inventory II (BDI) (Beck et al., 1996). Mood regulation was assessed using the Neuroticism scale from the Eysenck Personality Inventory (EPI) (Eysenck and Eysenck, 1964), and the BDI.
Alcohol and drug use were assessed through the Cahalan Drinking Habits Questionnaire (Cahalan et al., 1969), the Alcohol Use Disorders Identification Test (AUDIT) (Babor et al., 1992), and a Drug Use Questionnaire modeled on the Cahalan instrument (Cognitive Studies Laboratory, 1994). Caffeine intake and smoking were also assessed by in-house questionnaires.
Testing Protocol
Participants took part in 3 laboratory visits. The first was a screening assessment of health status, psychological functioning, temperament characteristics, drinking behavior, and personality. This was followed by 2 days of laboratory testing, controlling for time of day. The first test day included psychophysiological stress testing. The second day included behavioral tasks including the Go-NoGo task. Absence of alcohol and drug use was confirmed on test days by negative expired-air alcohol tests (AlcoMate Prestige, AL-6000, AK Solutions, Palisades Park, NJ) and urine drug screens (icup, Alcopro, Knoxville, TN).
Go-NoGo Reaction Time Task
Participants sat upright in a comfortable chair and observed a video monitor. They were informed that there would be an oval fixation area on a blue background, which would display 1 of 3 stimuli, “Go,” “NoGo,” or “XX.” They were instructed to press a button as quickly as possible when presented with the word “Go,” and to inhibit any response when presented with the word “NoGo” or an alternate NoGo stimulus of “XX.” There were 5 sets of 20 timed trials, with a 10-second rest period between sets.
Participants were told that they would receive reward points (tabulated in the upper right corner of the video monitor) when correct responses were given within a time limit, slow or incorrect responses resulted in point penalties. Participants were advised not to pay attention to scores, as this might slow response time. Participants were unaware of 2 additional challenges: (a) correct response time periods decreased as a function of the rapidity of correct responses, and (b) to decrease participants' ability to anticipate an inhibitory stimulus, the ratio of Go signals to NoGo signals was approximately 3:1.
Data Analysis
Signal detection theory assumes that decision-making takes place in a state of uncertainty. That uncertainty can be examined through the variability of correct and incorrect responses to the forced choices on the Go-NoGo reaction time task. In any given trial, participants have 4 possible responses that can be displayed using a 2 × 2 matrix (Fig. 1). A “Hit” occurred if the Go stimulus was presented and the subject responded with a button press. A “Miss” was a failure to respond to a Go stimulus. Nonresponses to either type of NoGo stimulus were considered “Correct Rejections” while a “False Alarm” was recorded when a subject incorrectly responded to either of the NoGo stimuli (Coren et al., 1994). The relationship between hits and false alarms allows calculation of the parameter d′ (d′ = proportion of Hits – proportion False Alarms), which is useful for estimating the individual's decision-making effectiveness (Macmillan and Creelman, 2005).
Fig. 1.
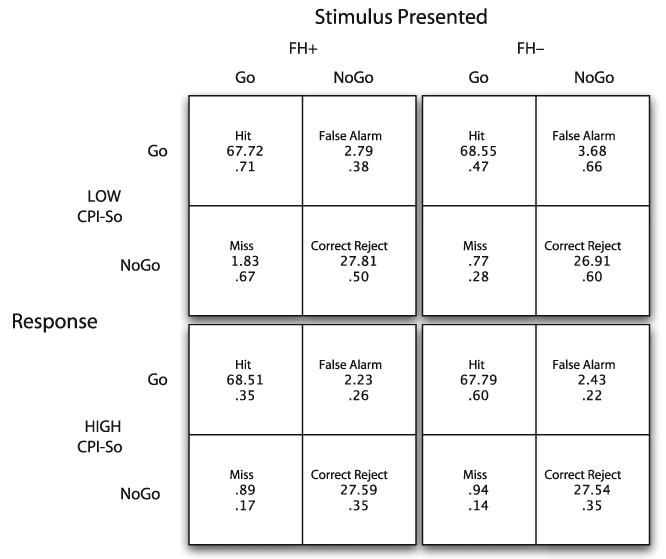
Performance on a Go-NoGo reaction time task in subjects classified by family history of alcoholism and score range on the California Psychological Inventory Sociability scale. Each group's performance is shown as Hits (responding correctly to a Go stimulus), Correct Rejects (withholding a response to a No-Go stimulus), Misses (failure to respond to a Go stimulus) and False Alarms (responding to a No-Go stimulus). A model containing Family History, Gender, and Cpi-So group accounted for a significant amount of variance in False Alarms. FH+, Positive family history for alcoholism, defined as having 1 or 2 alcoholic parents; FH−, No alcoholism in first-degree relatives for 2 generations; Low CPI-So, score of <30; High CPI-So, score ≥30.
The FH groups were compared for demographic variables, psychological status, and drug and alcohol use by 2-tailed Student's t-tests. Signal detection analyses were multivariate and correlational. All analyses were performed using SAS (SAS System for Windows, version 8.2, SAS Institute, Cary, NC).
Results
Sample Characteristics
Consistent with earlier findings, the FH+ had significantly lower CPI-So scores than FH− (29.1 ± 0.48 vs. 33.2 ± 0.40, t = 6.63, p < .000001). Table 1 describes characteristics of the FH by CPI-So groups with statistical comparisons. The FH+ had lower SES scores than the FH− subjects, although scores all groups fell into the “middle class” descriptive category. SES did not differ between the High and Low CPI-So groups. The FH groups did not differ in estimated intelligence, based on their Shipley vocabulary scores, although the Low CPI-So group had modestly lower estimated intelligence than the High group. Educational achievement was lower for FH+ and for low CPI-So groups, although these differences were accounted for by the lowest level of achievement occurring in the presumed High Risk group (FH+, Low CPI-So). Mood regulation, reflected in EPI-neuroticism and BDI scores, was poorer in FH+ and in Low CPI-So groups, with the highest scores in the High Risk group. Indicators of alcohol and drug use showed that the presumed Low Risk group had the least reported alcohol intake, the lowest AUDIT scores, and the least use of tobacco, experimentation with drugs, and were the least likely to have a failed drug screen in the laboratory while the presumed High Risk subjects were highest of the 4 groups in each of these categories. Males and females had comparable CPI-So scores, 30.6 ± 0.54 and 31.6 ± 0.43, respectively, t = 1.40, p =0.163.
Table 2 provides Pearson correlations showing that higher CPI-So scores in this population are related to higher educational attainment, estimated intelligence, and SES, suggesting an external validity to the CPI-So scores. Similarly, lower scores are associated with greater evidence of poor mood stability and more negative affect. Most importantly, lower CPI-So scores are also associated with greater use of pharmacologic substances including caffeine, tobacco, and alcohol, as well as risky drinking practices as measured by the AUDIT.
Table 2.
Pearson Correlations Between CPI-So Scores and Indicators of Cognition, Mood Regulation, and Substance Use
| Behavioral indicator | r | p |
|---|---|---|
| Years of education | 0.22 | 0.002 |
| Shipley vocabulary | 0.15 | 0.02 |
| Hollingshead index | 0.16 | 0.02 |
| BDI score | −0.37 | 0.0001 |
| EPI neuroticism | −0.19 | 0.004 |
| Caffeine consumption | −0.157 | 0.02 |
| Cigarettes smoked per day | −0.36 | 0.0001 |
| Cahalan index | −0.202 | 0.004 |
| AUDIT score | −0.19 | 0.004 |
Signal Detection Analysis
Go-NoGo performance for the High and Low CPI-So groups is shown in Fig. 1. Multivariate analyses were performed using FH, gender, and CPI-So scores as independent variables and scores in each of the 4 Go-NoGo response categories as dependent variables. This model did not account for variability in scores for Hits, Misses, or Correct Rejections. However, False Alarm rates were predicted by the overall model, F (3, 226) = 3.89, p = 0.0097, accounting for 4.9% of the variance. As predicted, False Alarms were accounted for by low CPI-So status, F (1, 226) = 5.15, p = 0.024, and male gender, F (1, 226) = 6.27, p = 0.013 (Table 3). There was no effect of FH status on False Alarm rates (2.96 ± 0.29 vs. 2.63 ± 0.24 for FH− and FH+, respectively) and no interactions with the other independent variables after accounting for CPI-So status and gender. A partial correlation analysis, controlling for FH, showed a significant correlation between False Alarm rate and low CPI-So scores, r = −0.153, p = 0.021, and male gender, r = 0.16, p = 0.015. The f-hat estimate of effect size was 0.157 for the full model, showing a small to moderate association between the false alarm rates and the predictor variables (Cohen, 1988).
Table 3.
False Alarms for Sociability Groups by Sex
| Sociability group | High | Low | |
|---|---|---|---|
| Males | 2.84 (0.35) | 3.61 (0.39) | 3.23 (0.26) |
| Females | 2.09 (0.24) | 2.66 (0.47) | 2.38 (0.26) |
| 2.47 (0.21) | 3.14 (0.31) |
Entries show mean (± SEM).
Further analyses were performed using FH, gender, and CPI-So status as independent variables and d′ as the dependent variable. There was a trend toward a 3 way interaction, F (1, 226) = 3.11, p = .074, with FH+, low CPI-So status, male subjects having the lowest d′ values and FH−, high CPI-So, female subjects the highest. CPI-So status was marginally significant, F (1, 226) = 3.69, p = 0.056, with low CPI-So subjects exhibiting lower d′ values than high CPI-So subjects. There was no main effect of FH or gender.
Discussion
This study provides evidence of higher rates of false alarms during a Go-NoGo reaction time task in male subjects and in those with lower CPI-So scores, suggesting a relative degree of behavioral undercontrol in these groups. Because the task is a psychomotor task, the false alarm rates represent an undercontrol tendency manifested as a behavioral impulsivity. This evidence converges with findings that low CPI-So scores also predict affective, cognitive, and physiological response characteristics of volunteers in this sample (Table 2) (Lovallo et al., 2006; Miranda et al., 2002; Sorocco et al., 2006). In their diagnostic interviews, these FH+ were twice as likely as FH− to report Axis II, cluster B symptoms including: having unprotected sex, many recent sex partners, engaging in reckless driving, using an alias, having periods of not working for no reason, or quitting jobs without savings to live on, (American Psychiatric Association, 1994). Sher and colleagues reported a similar pattern of behavioral tendencies in a college sample of FH+ (Sher, 1991).
This symptom pattern is consistent with the idea that low CPI-So scores characterize the FH+ group as being impulsive and norm violating, and it is also consistent with studies showing a common inheritance of antisocial and impulsive tendencies in FH+ (Langbehn et al., 2003; Nurnberger et al., 2004). Other evidence suggests that increased risk of alcoholism in FH+ may be specifically associated with behavioral undercontrol and externalizing characteristics (Krueger et al., 2002; Sher et al., 2004; Tarter et al., 1985). In the present study, the High Risk subgroup (FH+, low CPI-So) was also lower in educational achievement, suggesting less motivation and direction in life. This subgroup also had poorer emotional regulation, as indicated by higher BDI and EPI scores, and they were more likely to experiment with drugs other than alcohol. They also had working memory deficits, as seen in poorer performance on the Stroop color-word test and a heightened attraction to rewards in a gambling paradigm (Lovallo et al., 2006; Smith and Jonides, 1999). The fact that FH was no longer a significant predictor of false alarms when CPI-So was entered into the statistical model may indicate that low CPI-So scores capture an impulsivity trait that may represent a core characteristic of FH+ and that may underlie their greater risk of future alcoholism. It is noteworthy that CPI-So score and sex did not interact in predicting false alarms. That is, lower CPI-So scores predicted similar increases in false alarm rates in men and women despite the higher false alarm rates in men within each CPI-So score group (Table 3).
We note also that higher false alarm rates accompany low CPI-So scores in both FH+ and FH− persons. This raises the key question of whether low CPI-So scores are indicative of a greater tendency toward alcoholism and other substance use disorders or represent a temperament characteristic independent of FH. As noted above, FH+ have far lower CPI-So scores than do the FH− subjects and are two-and-a-half times more likely to fall into the low CPI-So group. This suggests a strong clustering of behavioral undercontrol tendencies in the FH+ group, consistent with data in Tables 1 and 2 and interview reports described above. While many FH+ have low CPI-So scores, half score in the relatively prosocial range (≥30). It would be useful to know if these high-scoring FH+ are at normal risk for future drinking problems. Follow-up evaluations of drinking patterns will allow the independent effects of CPI-So scores and FH to be examined in relation to alcohol problems.
These findings converge with reports that alcohol increases false alarm rates on a Go-NoGo learning task in persons with low working memory capacity, although family history of alcoholism alone did not account for this result (Finn et al., 1999). The results presented here indicate that behavioral impulsivity can be seen in the absence of alcohol exposure in persons who are behaviorally undercontrolled suggesting that motor impulsivity is not only a reaction to alcohol's effects but is more fundamental to the trait of behavioral undercontrol. False alarm rates are also elevated in early-onset alcoholics who display conduct disorder, and this tendency is worsened in the presence of low working memory capacity (Finn et al., 1999). These agree with the present findings that a positive family history of alcoholism does not account for increased impulsivity above and beyond the behavioral undercontrol captured in low CPI-So scores. Tarter has noted that low sociability is actually an active, disinhibited, labile, impulsive disposition representing a prefrontal deficit (Tarter et al., 1985).
The rates of false alarms are tracked by trends in the d′ scores. The d′ parameter indicates the effectiveness with which a detection and response choice system works (Kornbrot, 2006; Swets, 1961, 1988). Other evidence indicates that areas of the prefrontal cortex are essential for performing this task, and that poorer performance indicates less well organized working memory functions. Behavioral impulsivity and poor behavioral adjustment to altered response contingencies has long been observed in persons with frontal lobe damage (Anderson et al., 1999; Berlin et al., 2004). Such deficits in intact individuals are associated with reduced working memory capacity. Finn has shown a greater sensitivity in FH+ to degraded Go-NoGo task performance under increased working memory load (Finn, 2002; Finn et al., 1999). Neuroimaging studies show that inadequate activation of prefrontal circuits associated with working memory may precede false alarm errors. Li and coworkers identified 2 predictive sources of impulsive errors in the stop signal task: (1) failure to adequately activate the anterior presupplementary motor area prior to a stop signal was associated with impulsivity and therefore a failure to inhibit responses when a stop signal was detected, (2) failure to activate bilateral middle and inferior frontal cortices was associated with a more global lack of vigilance, poor attentional monitoring, and subsequently failing to detect the signal as a stop signal and making a response (Li et al., 2006). Work with cocaine-dependent subjects on this task revealed that a failure to adequately activate the rostral anterior cingulate cortex was predictive of impulsive errors (Li et al., 2007a). This region is a associated with the formation and monitoring of response intentionality, and it provides critical inputs to the supplementary motor area in regulating overt behavior (Amodio and Frith, 2006). In a study comparing nondrinking FH+ and FH− adolescents, FH+ subjects had less fMRI evidence of prefrontal inhibitory activity during a Go-NoGo task (Schweinsburg et al., 2004), suggesting a lack of prefrontal regulation of attention and behavioral responsivity. Li and colleagues hypothesize that specific failure to deactivate parts of the posterior and anterior cingulate gyrus is associated with attentional and response inhibition failures preceding false alarms in a Go-NoGo task (Li et al., 2007b). These neuroimaging findings suggest that regional brain activity should be studied in relation to Go-NoGo and stop-signal performance in persons with the risk factors examined in the present study.
The above findings may have implications for alcohol and drug dependency treatment. For example, impulsivity, especially in males, appears to be a risk factor that also predicts poor mood regulation, lower educational and socio-economic achievement, a tendency to experiment with drugs other than alcohol, and a heightened sensitivity to rewards but not consequences. These risk factors suggest a deficit in patients' decision-making abilities. It seems important for treatment counselors to have an understanding of these risk factors so that they may bolster patients' decision-making deficits in order to improve treatment responsivity and relapse prevention.
Acknowledgments
Supported by the Department of Veterans Affairs Medical Research Service, the National Institutes of Health, NIAAA grant R01 AA12207, and NIRR grant M01 RR14467.
Footnotes
No claim to original U.S. government works
References
- American Psychiatric Association. Diagnostic and Statistical Manual of Mental Disorders. American Psychiatric Association; Washington, D.C.: 1994. [Google Scholar]
- Amodio DM, Frith CD. Meeting of minds: the medial frontal cortex and social cognition. Nat Rev Neurosci. 2006;7:268–277. doi: 10.1038/nrn1884. [DOI] [PubMed] [Google Scholar]
- Anderson SW, Bechara A, Damasio H, Tranel D, Damasio AR. Impairment of social and moral behavior related to early damage in human prefrontal cortex. Nat Neurosci. 1999;2:1032–1037. doi: 10.1038/14833. [DOI] [PubMed] [Google Scholar]
- Andreasen NC, Endicott J, Spitzer RL, Winokur G. The family history method using diagnostic criteria. Arch Gen Psychiatry. 1977;34:1229–1235. doi: 10.1001/archpsyc.1977.01770220111013. [DOI] [PubMed] [Google Scholar]
- Babor TF, De La Fuente JR, Saunders J, Grant M. AUDIT: The Alcohol Use Disorders Identification Test: Guidelines for Use in Primary Health Care. World Health Organization; Geneva, Switzerland: 1992. [Google Scholar]
- Beck AT, Steer RA, Ball R, Ranieri W. Comparison of Beck Depression Inventories -IA and -II in psychiatric outpatients. J Pers Assess. 1996;67:588–597. doi: 10.1207/s15327752jpa6703_13. [DOI] [PubMed] [Google Scholar]
- Berlin HA, Rolls ET, Kischka U. Impulsivity, time perception, emotion and reinforcement sensitivity in patients with orbitofrontal cortex lesions. Brain. 2004;127:1108–1126. doi: 10.1093/brain/awh135. [DOI] [PubMed] [Google Scholar]
- Bucholz KK, Cadoret R, Cloninger CR, Dinwiddie SH, Hesselbrock VM, Nurnberger JI, Jr, Reich T, Schmidt I, Schuckit MA. A new, semi-structured psychiatric interview for use in genetic linkage studies: a report on the reliability of the SSAGA. J Stud Alcohol. 1994;55:149–158. doi: 10.15288/jsa.1994.55.149. [DOI] [PubMed] [Google Scholar]
- Cahalan U, Cisin I, Crossely HM. American Drinking Practices. Rutgers Center for Alcohol Studies; Newark, NJ: 1969. [Google Scholar]
- Cloninger CR. Neurogenetic adaptive mechanisms in alcoholism. Science. 1987;236:410–416. doi: 10.1126/science.2882604. [DOI] [PubMed] [Google Scholar]
- Cloninger CR, Bohman M, Sigvardsson S. Inheritance of alcohol abuse: cross fostering analysis of adopted men. Arch Gen Psychiat. 1981;38:861–868. doi: 10.1001/archpsyc.1981.01780330019001. [DOI] [PubMed] [Google Scholar]
- Cognitive Studies Laboratory. The Drug Use Inventory. Center for Alcohol and Drug Related Studies, University of Oklahoma Health Sciences Center; Oklahoma City, OK: 1994. [Google Scholar]
- Cohen J. Statistical Power Analysis for the Behavioral Sciences. 2nd. Lawrence Erlbaum Associates; Hillsdale, NJ: 1988. [Google Scholar]
- Cooney NL, Kadden RM, Litt MD. A comparison of methods for assessing sociopathy in male and female alcoholics. J Stud Alcohol. 1990;51:42–48. doi: 10.15288/jsa.1990.51.42. [DOI] [PubMed] [Google Scholar]
- Coren S, Ward LM, Enns JT. Sensation and perception. 4th. Harcourt Brace College Publishers; New York: 1994. [Google Scholar]
- Dom G, De Wilde B, Hulstijn W, van den Brink W, Sabbe B. Behavioural aspects of impulsivity in alcoholics with and without a cluster-B personality disorder. Alcohol Alcohol. 2006;41:412–420. doi: 10.1093/alcalc/agl030. [DOI] [PubMed] [Google Scholar]
- Eysenck SB, Eysenck HJ. An improved short questionnaire for the measurement of extraversion and neuroticism. Life Sci. 1964;305:1103–1109. doi: 10.1016/0024-3205(64)90125-0. [DOI] [PubMed] [Google Scholar]
- Finn PR. Motivation, working memory, and decision making: a cognitive-motivational theory of personality vulnerability to alcoholism. Behav Cogn Neurosci Rev. 2002;1:183–205. doi: 10.1177/1534582302001003001. [DOI] [PubMed] [Google Scholar]
- Finn PR, Justus A, Mazas C, Steinmetz JE. Working memory, executive processes and the effects of alcohol on Go / No-Go learning: testing a model of behavioral regulation and impulsivity. Psychopharmacology (Berl) 1999;146:465–472. doi: 10.1007/pl00005492. [DOI] [PubMed] [Google Scholar]
- Finn PR, Mazas CA, Justus AN, Steinmetz J. Early-onset alcoholism with conduct disorder: go/no go learning deficits, working memory capacity, and personality. Alcohol Clin Exp Res. 2002;26:186–206. [PubMed] [Google Scholar]
- Gough H. Theory, development, and interpretation of the CPI socialization scale. Psychol Rep. 1994;75:651–700. doi: 10.2466/pr0.1994.75.1.651. [DOI] [PubMed] [Google Scholar]
- Grant BF, Dawson DA, Stinson FS, Chou SP, Dufour MC, Pickering RP. The 12-month prevalence and trends in DSM-IV alcohol abuse and dependence: United States, 1991–1992 and 2001–2002. Drug Alcohol Depend. 2004;74:223–234. doi: 10.1016/j.drugalcdep.2004.02.004. [DOI] [PubMed] [Google Scholar]
- Hollingshead AB. Four Factor Index of Social Status. Yale University; New Haven, CT: 1975. p. 22. [Google Scholar]
- Kornbrot DE. Signal detection theory, the approach of choice: model-based and distribution-free measures and evaluation. Percept Psychophys. 2006;68:393–414. doi: 10.3758/bf03193685. [DOI] [PubMed] [Google Scholar]
- Krueger RF, Hicks BM, Patrick CJ, Carlson SR, Iacono WG, McGue M. Etiologic connections among substance dependence, antisocial behavior, and personality: modeling the externalizing spectrum. J Abnorm Psychol. 2002;111:411–424. [PubMed] [Google Scholar]
- Langbehn DR, Cadoret RJ, Caspers K, Troughton EP, Yucuis R. Genetic and environmental risk factors for the onset of drug use and problems in adoptees. Drug Alcohol Depend. 2003;69:151–167. doi: 10.1016/s0376-8716(02)00310-1. [DOI] [PubMed] [Google Scholar]
- Li CS, Huang C, Constable RT, Sinha R. Imaging response inhibition in a stop-signal task: neural correlates independent of signal monitoring and post-response processing. J Neurosci. 2006;26:186–192. doi: 10.1523/JNEUROSCI.3741-05.2006. [DOI] [PMC free article] [PubMed] [Google Scholar]
- Li CS, Huang C, Yan P, Bhagwagar Z, Milivojevic V, Sinha R. Neural correlates of impulse control during stop signal inhibition in cocaine-dependent men. Neuropsychopharmacology. 2007a doi: 10.1038/sj.n.1301568. Epub ahead of print, 26 Sept 2007. [DOI] [PMC free article] [PubMed] [Google Scholar]
- Li CS, Yan P, Bergquist KL, Sinha R. Greater activation of the “default” brain regions predicts stop signal errors. Neuroimage. 2007b;38:640–648. doi: 10.1016/j.neuroimage.2007.07.021. [DOI] [PMC free article] [PubMed] [Google Scholar]
- Lieb R, Merikangas KR, Hofler M, Pfister H, Isensee B, Wittchen HU. Parental alcohol use disorders and alcohol use and disorders in offspring: a community study. Psychol Med. 2002;32:63–78. doi: 10.1017/s0033291701004883. [DOI] [PubMed] [Google Scholar]
- Lovallo WR, Yechiam E, Sorocco KH, Vincent AS, Collins FL. Working memory and decision-making biases in young adults with a family history of alcoholism: Studies from the Oklahoma Family Health Patterns Project. Alcohol Clin Exp Res. 2006;30:763–773. doi: 10.1111/j.1530-0277.2006.00089.x. [DOI] [PMC free article] [PubMed] [Google Scholar]
- Macmillan NA, Creelman CD. Detection Theory: A User's Guide. Lawrence Earlbaum Associates; Mahwah, NJ: 2005. [Google Scholar]
- Mann RE, Sobell LC, Sobell MB, Pavan D. Reliability of a family tree questionnaire for assessing family history of alcohol problems. Drug Alcohol Depend. 1985;15:61–67. doi: 10.1016/0376-8716(85)90030-4. [DOI] [PubMed] [Google Scholar]
- Merikangas KR, Stolar M, Stevens DE, Goulet J, Preisig MA, Fenton B, Zhang H, O'Malley SS, Rounsaville BJ. Familial transmission of substance use disorders. Arch Gen Psychiatry. 1998;55:973–979. doi: 10.1001/archpsyc.55.11.973. [DOI] [PubMed] [Google Scholar]
- Miranda R, Jr, Meyerson LA, Buchanan TW, Lovallo WR. Altered emotion-modulated startle in young adults with a family history of alcoholism. Alcohol Clin Exp Res. 2002;26:441–448. [PubMed] [Google Scholar]
- Mitchell SH. Measuring impulsivity and modeling its association with cigarette smoking. Behav Cogn Neurosci Rev. 2004;3:261–275. doi: 10.1177/1534582305276838. [DOI] [PubMed] [Google Scholar]
- Nurnberger JI, Jr, Wiegand R, Bucholz K, O'Connor S, Meyer ET, Reich T, Rice J, Schuckit M, King L, Petti T, Bierut L, Hinrichs AL, Kuperman S, Hesselbrock V, Porjesz B. A family study of alcohol dependence: coaggregation of multiple disorders in relatives of alcohol-dependent probands. Arch Gen Psychiatry. 2004;61:1246–1256. doi: 10.1001/archpsyc.61.12.1246. [DOI] [PubMed] [Google Scholar]
- Schuckit MA, Klein JL, Twitchell GR. The misclassification of family history status in studies of children of alcoholics. J Stud Alcohol. 1995;56:47–50. doi: 10.15288/jsa.1995.56.47. [DOI] [PubMed] [Google Scholar]
- Schweinsburg AD, Paulus MP, Barlett VC, Killeen LA, Caldwell LC, Pulido C, Brown SA, Tapert SF. An FMRI study of response inhibition in youths with a family history of alcoholism. Ann N Y Acad Sci. 2004;1021:391–394. doi: 10.1196/annals.1308.050. [DOI] [PubMed] [Google Scholar]
- Sher KJ. Psychological characteristics of children of alcoholics. Overview of research methods and findings. Recent Dev Alcohol. 1991;9:301–326. [PubMed] [Google Scholar]
- Sher KJ, Grekin ER, Williams NA. The development of alcohol use disorders. Annu Rev Clin Psychol. 2004;22:1–22. doi: 10.1146/annurev.clinpsy.1.102803.144107. [DOI] [PubMed] [Google Scholar]
- Smith EE, Jonides J. Storage and executive processes in the frontal lobes. Science. 1999;283:1657–1661. doi: 10.1126/science.283.5408.1657. [DOI] [PubMed] [Google Scholar]
- Sorocco KH, Lovallo WR, Vincent AS, Collins FL. Blunted hypothalamic-pituitary-adrenocortical axis responsivity to stress in persons with a family history of alcoholism. Int J Psychophysiol. 2006;59:210–217. doi: 10.1016/j.ijpsycho.2005.10.009. [DOI] [PMC free article] [PubMed] [Google Scholar]
- Sutocky JW, Shultz JM, Kizer KW. Alcohol-related mortality in California, 1980 to 1989. Am J Public Health. 1993;83:817–823. doi: 10.2105/ajph.83.6.817. [DOI] [PMC free article] [PubMed] [Google Scholar]
- Swets JA. Is there a sensory threshold? Science. 1961;134:168–177. doi: 10.1126/science.134.3473.168. [DOI] [PubMed] [Google Scholar]
- Swets JA. Measuring the accuracy of diagnostic systems. Science. 1988;240:1285–1293. doi: 10.1126/science.3287615. [DOI] [PubMed] [Google Scholar]
- Tarter RE. Etiology of adolescent substance abuse: a developmental perspective. Am J Addict. 2002;11:171–191. doi: 10.1080/10550490290087965. [DOI] [PubMed] [Google Scholar]
- Tarter RE, Alterman AI, Edwards KL. Vulnerability to alcoholism in men: a behavior-genetic perspective. J Stud Alcohol. 1985;46:329–356. doi: 10.15288/jsa.1985.46.329. [DOI] [PubMed] [Google Scholar]
- Verdejo-Garcia AJ, Perales JC, Perez-Garcia M. Cognitive impulsivity in cocaine and heroin polysubstance abusers. Addict Behav. 2007;32:950–966. doi: 10.1016/j.addbeh.2006.06.032. [DOI] [PubMed] [Google Scholar]
- Zachary RA. Shipley Institute of Living Scale Revised manual. Western Psychological Services; Los Angeles: 1986. [Google Scholar]
- Zimmerman M, Coryell W, Pfohl B, Stangl D. The reliability of the family history method for psychiatric diagnoses. Arch Gen Psychiatry. 1988;45:320–322. doi: 10.1001/archpsyc.1988.01800280030004. [DOI] [PubMed] [Google Scholar]