

Abstract
The nuclear LIM domain protein LMO2, a T cell oncoprotein, is essential for embryonic erythropoiesis. LIM-only proteins are presumed to act primarily through protein-protein interactions. We, and others, have identified a widely expressed protein, Ldb1, whose C-terminal 76-residues are sufficient to mediate interaction with LMO2. In murine erythroleukemia cells, the endogenous Lbd1 and LMO2 proteins exist in a stable complex, whose binding affinity appears greater than that between LMO2 and the bHLH transcription factor SCL. However, Ldb1, LMO2, and SCL/E12 can assemble as a multiprotein complex on a consensus SCL binding site. Like LMO2, the Ldb1 gene is expressed in fetal liver and erythroid cell lines. Forced expression of Ldb1 in G1ER proerythroblast cells inhibited cellular maturation, a finding compatible with the decrease in Ldb1 gene expression that normally occurs during erythroid differentiation. Overexpression of the LMO2 gene also inhibited erythroid differentiation. Our studies demonstrate a function for Ldb1 in hemopoietic cells and suggest that one role of the Ldb1/LMO2 complex is to maintain erythroid precursors in an immature state.
Keywords: protein interactions, transcription factors, hemopoiesis, leukemia
Hemopoiesis, the process by which multiple blood lineages are produced from pluripotential stem cells, involves the establishment of cell-specific programs of gene expression that ultimately dictate the cell phenotype. This requires the combinatorial action of cell-restricted and ubiquitous transcription factors. Several lineage-restricted factors have been shown to have a pivotal role in regulating different aspects of lineage commitment and differentiation within the hemopoietic compartment (1). The LMO2, SCL/tal-1 (hereafter, SCL), and GATA-1 genes encoding LIM domain, basic-helix-loop-helix, and zinc finger proteins, respectively, are essential for embryonic erythropoiesis (1). SCL has a more central role in the hemopoietic compartment, in that it is required for the development of all lineages (2, 3). It is thought that LMO2, which interacts physically with SCL (4–6), also acts in the earliest stages of hemopoiesis (7) . Evidence that LMO2, SCL, and GATA-1 assemble in a multiprotein complex further implies a close functional relationship between these nuclear regulators within the erythroid lineage (8). It is noteworthy that LMO2 and SCL, both of which were identified by chromosomal translocations in acute T cell leukemia, act synergistically to promote leukemia (6).
LMO2 is a member of a small family of proteins comprising two cysteine-rich, zinc-coordinating LIM domains (9). This subset of LIM-only proteins belongs to a larger family of LIM-domain-containing proteins, including nuclear LIM homeodomain transcription factors as well as cytoplasmic LIM domain proteins. Critical functions for several LIM homeodomain genes, such as Isl-1 (10), Lhx-1 (11), and Lhx-3 (12), have been established in lineage specification and differentiation of diverse cellular systems. Nonetheless, the molecular mechanisms by which these genes exert their functions remains elusive. In particular, the specific function of the LIM domain is not known. LIM domains are not thought to mediate DNA binding. Rather, they appear to serve as an interface for critical protein-protein interactions (13, 14).
To understand further the role of LMO2 in hemopoiesis, and its interrelationship with SCL, we searched for new partners of LMO2 in both primitive and definitive erythroid cells. A form of the recently reported NL-1/Ldb1/Clim-2 protein (hereafter, Ldb1) (15–17) was identified. Ldb1 has been shown to be a binding partner for several LIM domain transcription factors. Here we characterize the binding properties of a complex comprising Ldb1, LMO2, and SCL, and establish a function for the Ldb1/LMO2 complex in the hemopoietic compartment. Forced expression of the Ldb1 or LMO2 genes inhibits erythroid cell maturation, suggesting a potential role for the Ldb1/LMO2 complex in immature erythroid precursor cells.
MATERIALS AND METHODS
In Vitro and In vivo Expression Library Screens.
(i) In situ filter screening: Full-length LMO2 was inserted into pGEX2TK; the recombinant fusion protein was labeled with 32P and cleaved with thrombin as described (18). An E9.5 yolk sac λgt11 library (3 × 10⁶ plaque-forming units) was screened under denaturing/renaturing conditions (19). The inserts of positive clones were subcloned into Bluescript vector (KS) for DNA sequencing. (b) Yeast two-hybrid system: Full-length LMO2 was cloned in-frame into the GAL4 DNA-binding domain plasmid pGBT9 and used to screen 2.1 × 10⁶ mouse erythroleukemia (MEL) cDNA library transformants as described (CLONTECH Matchmaker Two-Hybrid System Protocol).
Plasmid Constructs and Preparation of Ldb1 Antisera.
Details of plasmid constructions are available on request. An Ldb1 cDNA encoding a 375-aa protein and an E12 cDNA (20) were cloned in the pEFpGKpuro expression vector. pEF1α-SCL has been described (21). cDNAs encoding Ldb1a (421 residues) and LdbΔN (C-terminal 76 residues) were fused to an N-terminal Flag-epitope tag in the expression vector pEFFlagpGKpuro (22). The N-terminal sequence of Ldb1a is deposited in the GenBank database. LMO2 was fused to either hemagglutinin (HA) or glutathione S-transferase epitope tags in vectors pEFHApGKpuro and pEBG, respectively.
A peptide corresponding to the C-terminal 15 amino acids of Ldb1, plus an additional N-terminal cysteine residue, was conjugated to the carrier KLH (Imject Maleimide Activated Carrier Kit, Pierce), purified, and injected into rabbits (Charles River Breeding Laboratories) to produce polyclonal antisera. Polyclonal antisera was also raised against full-length LMO2 fused to glutathione S-transferase in the vector pGEX2TK.
Protein-Protein Interaction and DNA-Binding Assays.
Total cell lysates, normalized for protein concentration, were incubated on ice with 1 μl of indicated antibody. Complexes were precipitated with protein A or G Sepharose, washed four times in RIPA buffer (50 mM Tris pH 7.5/150 mM NaCl/5 mM EDTA) that included 1% Nonidet P-40, 1% deoxycholate, and 0.1% SDS, then resolved by SDS/PAGE, before transfer to nitrocellulose membranes. Filters were incubated with indicated antisera (α-Flag, Kodak; α-HA, Boehringer Mannheim), followed by horseradish peroxidase-coupled secondary antibody, and developed by enhanced chemiluminescence (Amersham).
MEL nuclear extracts (2.5 mg) were separated by Superose 6 gel filtration chromatography (Pharmacia) in the presence of 20 mM Hepes (pH 7.9), 1 mM EDTA, 0.45 M KCl, 10% glycerin, 0.015% Nonidet P-40, 1 mM DTT using fast protein liquid chromatography (Pharmacia). Fractions (500 μl) were collected and 50 μl of every third fraction was subjected to SDS/PAGE and immunoblot analysis.
Nuclear extracts were prepared from transfected L293 cells and gel shift assays performed essentially as described (23), using the SCL/Tal-1 consensus DNA-binding site (24). Antibody (0.5 μl) was incubated with extracts for 30 min on ice prior to addition of probe.
Immunofluorescence.
Fetal liver erythroid cells (E12.5) and MEL cell transfectants were fixed in 4% paraformaldehyde, then subjected to immunofluorescence staining as described (25). Primary antibodies were detected with fluorescein isothiocyanate-labeled goat anti-mouse or anti-rabbit IgG (Jackson ImmunoResearch).
RNA Expression Analysis.
Poly(A)+ RNA was isolated from various murine hematopoietic cell lines (26). For analysis of G1ER transfectants, total cellular RNA was isolated by standard procedures (RNAzol, Tel-Test, Friendswood, TX). RNA (3 μg poly(A)+ RNA or 10 μg total RNA per lane) was fractionated on 1% agarose-formaldehyde gels, transferred to Hybond-C+ (Amersham), and hybridized to the appropriate radiolabeled cDNA probe. For in situ hybridization, antisense RNA probe representing the 3′ 717 nucleotides of Ldb1 (in Bluescript) was prepared using digoxigenin-UTP (Boehringer Mannheim) and performed as described (27) .
Retroviral Infections of G1ER Cells.
Dicistronic vectors consisting of an LTR-driven Ldb1 (encoding 375 amino acid variant) or LMO2 cDNA followed by an internal ribosome entry site (IRES)-zeocin cassette in the retroviral vector MFG (25) were constructed. A transient transfection system was used to infect G1E cells carrying the GATA-1/ER as described (28). Infected G1ER cells were selected with zeocin (150 μg/ml) for 7 days. To induce differentiation, zeocin-resistant pools of cells were cultured in the presence of 10−7 M β-estradiol for 48 hr; cells were then stained for hemoglobin.
RESULTS
Identification of the LMO2 Interacting Protein, Ldb1.
Ldb1 was isolated using two interactive screening approaches: (i) In vitro screening of a yolk sac erythrocyte cDNA λgt11 library using 32P-labeled LMO2, and (ii) a yeast two-hybrid screen of a MEL cDNA library with full-length LMO2 as bait. The first strategy yielded nine independent clones originating from the same gene; the longest cDNA was 1.8 kb and encoded an ORF of 421 amino acids, designated Ldb1a (Fig. 1A). The C-terminal 375 amino acids of this protein were found to be identical to those of the reported LIM-interacting protein Ldb1 (15–17). Our clones encoded 56 extra amino acids at the amino terminus, the consequence of an alternative 5′ exon (data not shown). One clone isolated from the yeast-two-hybrid screen encoded a 76 amino acid polypeptide corresponding to the C terminus of Ldb1 (LdbΔN; Fig. 1A). Thus, only 76 amino acids of Ldb1 are required to mediate interaction with LMO2 in yeast cells. This polypeptide also associated with the related LIM-domain protein, LMO1, in yeast cells (not shown).
Figure 1.
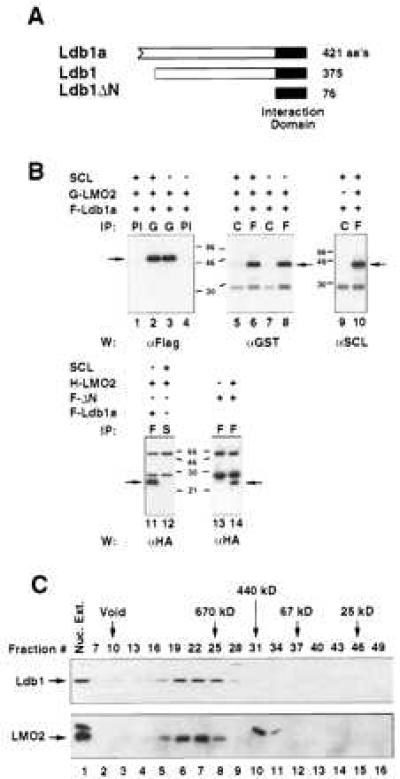
Specific in vivo interaction between Ldb1, LMO2, and SCL. (A) Schematic representation of two products of the Ldb1 gene, Ldb1a (421 residues), and Ldb1 (375 residues). The N terminus of Ldb1a is depicted as an ORF. LdbΔN corresponds to the LIM interaction domain, identified in the yeast two-hybrid system. (B) High affinity interaction between Ldb1 and LMO2, and complex formation between Ldb1, LMO2, and SCL/E2A. Cell extracts were coimmunoprecipitated with the indicated specific antisera and then immunoblotted using the antibody shown under each panel. G, glutathione S-transferase; F, Flag; H, HA; S, SCL; PI, preimmune sera; C, control mAb (α-HA). F-ΔN designates the Flag-tagged interaction domain of Ldb1. (C) Endogenous Ldb1 and LMO2 comigrate in gel filtration chromatography. Fractionation of nuclear extracts in a superose 6 column revealed comigration of Ldb1 and LMO2. The upper molecular mass band in the LMO2 Western blot (lanes 1, 10, 11) corresponds to a nonspecific cross-hybridizing protein.
Protein Interactions Involving Ldb1.
To examine interactions between LMO2, Ldb1, and SCL in mammalian cells, expression vectors containing SCL, Ldb1a, and LMO2 cDNAs, were transiently transfected into L293 cells and subjected to coupled coimmunoprecipitation/Western blot assays (Fig. 1B). To facilitate detection, Ldb1a and LMO2 cDNAs were tagged with N-terminal epitopes (Flag, HA, or glutathione S-transferase). As shown in Fig. 1B, glutathione S-transferase-LMO2 and Flag-Ldb1a were found to associate in vivo with high specificity, in reciprocal coimmunoprecipitation experiments (lanes 3 and 8). Like Ldb1a, the 375 amino acid variant of Ldb1 (Fig. 1A) interacted with LMO2 in transfected cells with high specificity (data not shown). Furthermore, the 76 amino acid interaction domain identified in the yeast two-hybrid screen was confirmed to mediate interaction in mammalian cells (Fig. 1B, lane 14).
To investigate whether Ldb1 associated with LMO2 in erythroid cells, MEL nuclear extracts were fractionated by gel filtration chromatography and resolved by electrophoresis. Ldb1 and LMO2 were found to stoichiometrically associate in a complex of ≈670 kDa (Fig. 1C, lanes 5–8), whereas SCL did not (data not shown). This association was observed in the presence of high salt, suggesting that the endogenous proteins interact with high affinity. On the basis of the large size of this complex (Fig. 1C), it can be inferred that other cellular proteins are contained within the Ldb1/LMO2 complex.
In contrast to the strong association between LMO2 and Ldb1a, LMO2 bound SCL in transfected L293 cells with substantially lower affinity (Fig. 1B, lanes 11 and 12). A weak interaction was observed only under low stringency conditions (data not shown). The presence of SCL did not interfere with complex formation between Ldb1a and LMO2 (Fig. 1B, lanes 2, 3, 6, and 8); diminished association was only observed in the presence of a 5-fold excess of SCL (data not shown). Ldb1a was precipitable by SCL antibody from cells expressing Ldb1, LMO2, and SCL (Fig. 1B, lane 10), even though Ldb1a did not bind to SCL alone in vivo (Fig. 1B, lane 9). This finding indicates that these three nuclear regulators can form a multiprotein complex in the absence of DNA, with LMO2 apparently serving as the adaptor.
The Ldb1, LMO2, SCL/E12 Multiprotein Complex Recognizes the SCL E-Box DNA-Binding Motif.
The potential involvement of Ldb1 in binding the SCL consensus E-box motif was evaluated by gel shift analysis of nuclear extracts prepared from transfected cells. Whereas LMO2 did not significantly alter the mobility of the SCL/E2A protein heterodimeric complex (Fig. 2A), Ldb1a together with LMO2 gave rise to a more slowly migrating binding activity. The presence of SCL, LMO2, and Ldb1a in this oligomeric complex was confirmed using specific antisera. Thus, a multiprotein complex comprising at least four proteins can assemble on the SCL E-box site. Moreover, a similar complex can be assembled on this target site from the endogenously expressed SCL/E2A, LMO2, and Ldb1 proteins in fetal liver erythroblasts (Fig. 2B) and adult erythroid cells (data not shown), as demonstrated by supershifting with specific antisera. However, the endogenous complex has a higher molecular weight than that observed in transfected cells, suggesting the presence of a larger E2A-like bHLH partner and/or other protein components in the native complex.
Figure 2.
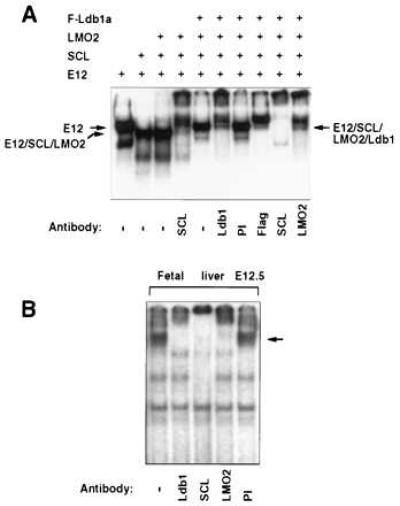
The SCL/E12, LMO2, Ldb1 multiprotein complex specifically recognizes the SCL target E-box site. (A) Proteins in nuclear extracts from L293 cells were supershifted with the indicated antisera. Relevant complexes are marked. (B) Gel shift analysis of E12.5 fetal liver nuclear extracts using the SCL E-Box sequence. Specific antisera were used to identify components of the endogenous multiprotein complex.
The Ldb1 Gene is Expressed in Embryonic and Adult Hemopoietic Cells.
In situ hybridization was performed to examine Ldb1 expression within the developing mouse embryo. At E13.5, Ldb1 transcripts are present widely at low level, and at high levels in several regions within the brain and central nervous sytem ganglia, as previously described (16, 17) (Fig. 3A). We note here that Ldb1 is also specifically expressed in fetal liver, as well as other sites including lung, kidney, thymus, and olfactory epithelium (Fig. 3A and data not shown). To confirm expression and the subcellular distribution of Ldb1 in fetal liver erythroid cells, the primary site of hemopoiesis within the embryo proper, we performed immunofluorescence using anti-Ldb1 peptide antisera. Strong nuclear staining of erythroid cells was detected (Fig. 3B).
Figure 3.

Expression of Ldb1 in developing and adult hemopoietic cells. (A) In situ hybridization of Ldb1 antisense RNA probe to mid-sagittal sections from E13.5 embryos. The arrow depicts fetal liver. (B) Immunofluorescence analysis demonstrating expression of Ldb1 in embryonic erythroblasts of fetal liver (E12.5). Cells were stained with α-Ldb1 peptide or preimmune sera. (C) Northern blot analysis of poly(A)+ RNA from murine hemopoieitic cell lines. The two Ldb1 transcripts are indicated in the upper panel. The control hybridization with a glyceraldehyde-3-phosphate dehydrogenase probe is shown in the lower panel. mØ, macrophage; Ery, erythroid; Ma, mast; Meg, megakaryocyte; T, T lymphoid.
In the adult mouse hemopoietic compartment, Ldb1 was expressed at moderate levels in erythroid cell lines as well as in all other hemopoietic lineages (myeloid, mast, megakaryocytic, B and T lymphoid). Two major RNA species of ≈2.3 and 3.5 kb were observed in each of these cell lines (Fig. 3C) and in several nonhemopoietic tissues (data not shown). LMO2 was expressed at relatively high levels in the erythroid and megakaryocytic lines surveyed here (data not shown), consistent with previous findings (7). We conclude that Ldb1 is coexpressed with LMO2 in certain hemopoietic lineages, most notably, the erythroid.
A Biological Role for Ldb1 and LMO2 in Erythroid Cells.
To explore the potential role of Ldb1 in erythroid differentiation, we initially examined the expression of Ldb1 during differentiation. Ldb1 RNA decreases in abundance during estrogen-induced differentiation of G1ER cells, a GATA-1− proerythroblast cell line harboring a conditional form of GATA-1 (28) (Fig. 4A). By 48 hr, when ≈30% of the cells have accumulated hemoglobin and are benzidine positive, little Ldb1 RNA was detectable compared with parental cells and untreated G1ER cells. LMO2 levels also declined with maturation (Fig. 4A), consistent with earlier findings (7). These data suggested that Ldb1 and LMO2 might function primarily in immature precursor cells.
Figure 4.
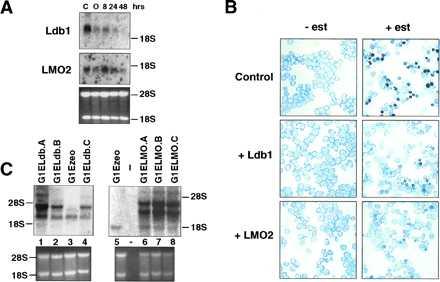
Ldb1 and LMO2 block erythroid differentiation of G1ER cells. (A) Northern blot analysis of total RNA from untreated (C) parental G1E cells (25), and those from G1ER cells after estrogen induction for the indicated times. In G1ER cells, the lower molecular weight transcript (2.3 kb) was more abundant, but the higher 3.5-kb RNA species was visible on longer exposure. As a control for RNA loading, the ethidium bromide stained gel displaying 28S and 18S RNA is given. Glyceraldehyde-3-phosphate dehydrogenase levels decrease during differentiation and therefore do not provide a control. (B) Benzidine staining of infected cells prior to (−est) and 48 hr (+est) after induction with estrogen. Darkly stained cells are benzidine positive. The figures shown are representative of six independent experiments. (C) Northern blot analysis of Ldb1 and LMO2 expression in infected G1ER cells. Total RNA was isolated from G1ER cells infected with vector alone (G1Ezeo) and those infected with Ldb1 or LMO2 cDNA-containing retroviruses. The major endogenous Ldb1 (lane 3) and LMO2 (lane 5) transcripts are clearly visible. Ethidium bromide stained agarose gels, shown in the lower panel, provide a monitor for RNA loading.
To test whether overexpression of Ldb1 or LMO2 influences erythroid maturation, cDNAs were introduced into two independent G1ER clones by retroviral infection (see Materials and Methods). As shown in Figs. 4B and 5, after 48 hr of estrogen treatment, infected G1ER cells expressing either exogenous Ldb1 or LMO2 exhibited a 4- to 5-fold decrease in the percent of benzidine positive cells, as compared with uninfected cells or those infected with retroviral vector alone. Moreover, the intensity of staining was significantly less for the Ldb1 or LMO2 retrovirus-infected cell pools, in contrast to the darkly stained control cells (Fig. 4B). Thus, both Ldb1 and LMO2 inhibit the ability of G1ER proerythroblasts to undergo maturation. Differentiation was not blocked further by coinfection with Ldb1 and LMO2 retroviruses (Fig. 5). A general block of differentiation by LMO2 could be excluded as its expression does not block GATA-1-induced megakaryocytic differentiation of 416B myeloid cells (data not shown). Northern blot analysis (Fig. 4C) demonstrated at least 3-fold higher RNA levels of the exogenous transcripts (Ldb1 lanes 1, 2, and 4; LMO2, lanes 6–8) from the retroviral LTR compared with that of the endogenous LMO2 (lane 5) and major Ldb1 RNA species (lane 3). The upper two LMO2-hybridizing bands (lanes 6–8) represent spliced and unspliced transcripts from the LTR, while the upper Ldb1-hybridizing band (lanes 1, 2, and 4) corresponds to spliced mRNA from the LTR (the longer unspliced transcript is present but at low levels).
Figure 5.
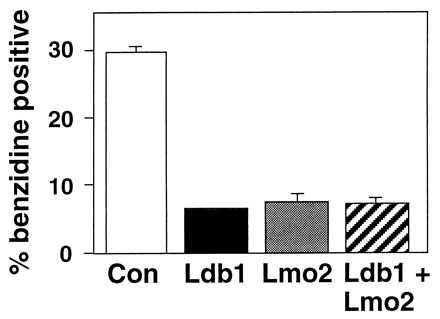
Degree of benzidine staining in infected G1ER cells. The mean values for benzidine positive cells expressed as the percentage of total cells in pools of infected G1ER cells are based on six independent experiments except for Ldb1 and LMO2 coinfected cells, for which three experiments were performed. For each sample, greater than 600 cells were scored for benzidine positivity. Bars = SEM.
DISCUSSION
The phenotype of a hemopoietic cell is likely to be defined by a distinct combination of transcriptional activators and repressors, rather than by a single master gene. One of the primary means of achieving combinatorial action is via direct protein-protein interaction. The LIM domain has emerged as an important structure for mediating protein-protein interactions. In this study, we have focused on the LIM-only protein LMO2 and its novel binding partner Ldb1, and defined a biological role for this complex in blood cells. Ldb1 and CLIM1 (17), a recently described family member, have also been shown to strongly associate with several members of the LIM homeodomain class of transcription factors (15–17), which have critical roles in the development of specific neuronal lineages. The ability of Ldb1 to interact with diverse types of LIM domain proteins is compatible with its widespread expression. Only 76 residues, characterized by acidic stretches and putative α-helical segments, appear to be necessary for its interaction with the LIM domain. Ldb1 does not possess a known DNA-binding motif and activator/repressor domains have not been delineated as yet. Ldb1 may function as a cofactor/adaptor, facilitating the assembly of specific complexes, or alternatively, could directly contribute an activation or repression domain to influence transcriptional activity.
The Ldb1, LMO2, SCL Multicomponent Transcriptional Complex.
Prior studies have indicated that a complex involving LMO2, SCL, and its bHLH partner E2A can form in erythroid cells (4, 5, 24). The interrelationship between LMO2 and SCL is of particular interest for two reasons: (i) targeted disruption of these genes reveals similar defects in yolk sac blood formation (2, 3, 7), suggesting that they function in a common pathway in early hemopoietic progenitors, and (ii) deregulation of SCL/LMO2 resulting from chromosomal rearrangement is associated with T cell leukemia (29). We have shown that Ldb1, LMO2, and SCL exist in a stable complex in cotransfected cells and that these endogenous proteins (together with an E2A-like protein) readily assemble on the SCL DNA recognition sequence. It is notable that Ldb1 and LMO2 interact with high affinity, whereas SCL appears to weakly associate with LMO2. Given the stability of the Ldb1/LMO2 complex, we postulate that, together, these proteins function as a core docking site for other factors. GATA-1 has been reported to physically interact with LMO2 (30), and recent evidence suggests that Ldb1, LMO2, SCL/E2A, and GATA-1, together, can assemble in vivo on a bipartite E box-GATA DNA-binding motif (8). The potential roles of these multicomponent complexes in erythroid cells are considered below.
Positive and Negative Regulators of Erythroid Differentiation.
The importance of LMO2 in embryonic erythropoiesis has been established but its precise role in the erythroid lineage is not known. Overexpression of either LMO2 or Ldb1 in the proerythroblast line G1ER indicated that these genes have parallel roles in the erythroid lineage, where they act as negative regulators of cellular maturation. Furthermore, high levels of Flag-Ldb1 expression in MEL cells inhibit terminal differentiation (data not shown). Given the high affinity interaction between Ldb1 and LMO2, it is presumed that they mediate inhibition as a complex. Our studies support a role for the Ldb1/LMO2 complex in maintaining erythroid precursors in an immature state, an hypothesis consistent with the observation that their expression declines during erythroid differentiation. Furthermore, the negative influence of LMO2 on differentiation has implications for T cell leukemia, where LMO2 may act in an analogous fashion.
The role of Ldb1 and LMO2 in the erythroid lineage is distinct from that of the transcription factors SCL and GATA-1. SCL has been shown to act as a positive regulator of erythroid differentiation in both overexpression and dominant-negative/antisense inhibition experiments (31, 32). GATA-1 is essential for progression from a proerythroblast to a mature erythrocyte (25). Indeed, expression of GATA-1 in an erythroid cell line derived from GATA-1− ES cells restores terminal maturation (25). A derivative (G1ER) of these cells was used for the functional studies described here. In these cells, overexpression of Ldb1 or LMO2 may block maturation either by directly interfering with GATA-1 function or acting through an independent pathway.
The potential of the erythroid-expressed factors SCL, LMO2, Ldb1, and GATA-1, to assemble in a multicomponent complex, taken together with their differential biological effects, raises the question as to which complexes serve to promote differentiation and which foster cell proliferation. It seems plausible that the balance of factors at any time determines the stoichiometry and transcriptional activity of a given complex, and ultimately dictates a choice between proliferation and differentiation. Our data suggest that the functions of Ldb1 and LMO2 may change during erythroid differentiation. In any event, high levels of each are evident in immature precursor cells and overexpression maintains the undifferentiated state.
Ldb1 as Both a Positive and Negative Transcriptional Modulator.
There is evidence that LIM domains and the Ldb family of LIM-binding proteins can exert both positive and negative regulatory influences. The LIM domain within LIM homeodomain transcription factors has been implicated in the inhibition of DNA-binding (33, 34), but has also been shown to mediate synergistic transcriptional activation by these proteins in association with other types of transcription factors (35, 36). Similarly, a closely related protein to Ldb1, CLIM1, mediates synergistic activation of the pituitary-specific promoter α-GSU by LIM and OTX homeodomain transcription factors (17). Moreover, coinjection of Ldb1 with X-Lim1 into Xenopus embryos promotes formation of partial secondary axes (15). On the other hand, we have provided evidence that Ldb1 and the LIM-only protein LMO2 act as negative regulators during erythroid differentiation. After completion of our work, Jurata and Gill (37) reported a negative role for Ldb1/NL-1 in repressing synergistic transcriptional activation of the insulin enhancer by Lmx1 and E47. Taken together, these findings suggest that Ldb1 serves as a multifunctional adaptor to modulate transcriptional activity in different developmental systems.
Acknowledgments
We are grateful to Geoff Lindeman, Alice Tsang, Gerd Blobel, and colleagues in the Orkin laboratory for helpful advice. We thank Mitch Weiss for providing G1ER cells, David Huang for Flag- and HA-tagged expression vectors, and Todd Gregory for RNA samples. S.H.O. is an investigator of the Howard Hughes Medical Institute. J.E.V. was a recipient of an American Cancer Society International Cancer Research Fellowship.
ABBREVIATION
- SCL
SCL/tal-1
- MEL
murine erythroleukemia
- LdB1
NL-1/lbd1/Clim-2 protein
- G1ER
GATA-1− (G1E) cells expressing GATA-1/ER
- HA
hemagglutinin
Footnotes
Data deposition: The sequence reported in this paper has been deposited in the GenBank database (accession no. AF030333)
References
- 1.Shivdasani R, Orkin S. Blood. 1996;87:4025–4039. [PubMed] [Google Scholar]
- 2.Porcher C, Swat W, Rockwell K, Fujiwara Y, Alt F, Orkin S. Cell. 1996;86:47–57. doi: 10.1016/s0092-8674(00)80076-8. [DOI] [PubMed] [Google Scholar]
- 3.Robb L, Elwood N, Elefanty A, Köntgen F, Li R, Barnett D, Begley C. EMBO J. 1996;15:4123–4129. [PMC free article] [PubMed] [Google Scholar]
- 4.Valge-Archer V E, Osada H, Warren A J, Forster A, Li J, Baer R, Rabbitts T H. Proc Natl Acad Sci USA. 1994;91:8617–8621. doi: 10.1073/pnas.91.18.8617. [DOI] [PMC free article] [PubMed] [Google Scholar]
- 5.Wadman I, Li J, Bash R O, Forster A, Osada H, Rabbitts T H, Baer R. EMBO J. 1994;13:4831–4839. doi: 10.1002/j.1460-2075.1994.tb06809.x. [DOI] [PMC free article] [PubMed] [Google Scholar]
- 6.Larson R C, Lavenir I, Larson T A, Baer R, Warren A J, Wadman I, Nottage K, Rabbitts T H. EMBO J. 1996;15:1021–1027. [PMC free article] [PubMed] [Google Scholar]
- 7.Warren A, Colledge W, Carlton M, Evans M, Smith A, Rabbitts T. Cell. 1994;78:45–57. doi: 10.1016/0092-8674(94)90571-1. [DOI] [PubMed] [Google Scholar]
- 8.Wadman I A, Osada H, Grütz G G, Agulnick A D, Westphal H, Forster A, Rabbitts T H. EMBO J. 1997;16:3145–3157. doi: 10.1093/emboj/16.11.3145. [DOI] [PMC free article] [PubMed] [Google Scholar]
- 9.Sanchez-Garcia I, Rabbitts T. Trends Genet. 1994;10:315–320. doi: 10.1016/0168-9525(94)90034-5. [DOI] [PubMed] [Google Scholar]
- 10.Pfaff S, Mendelsohn M, Stewart C, Edlund T, Jessel T. Cell. 1996;84:309–320. doi: 10.1016/s0092-8674(00)80985-x. [DOI] [PubMed] [Google Scholar]
- 11.Shawlot W, Behringer R. Nature (London) 1995;374:425–430. doi: 10.1038/374425a0. [DOI] [PubMed] [Google Scholar]
- 12.Sheng H, Zhadanov A, Mosinger B, Jr, Fujii T, Bertuzzi S, Grinberg A, Lee E, Huang S-P, Mahon K, Westphal H. Science. 1996;272:1004–1007. doi: 10.1126/science.272.5264.1004. [DOI] [PubMed] [Google Scholar]
- 13.Feuerstein R, Wang X, Song D, Cooke N, Liebhaber S. Proc Natl Acad Sci USA. 1994;91:10655–10659. doi: 10.1073/pnas.91.22.10655. [DOI] [PMC free article] [PubMed] [Google Scholar]
- 14.Schmeichel K L, Beckerle M C. Cell. 1994;79:211–219. doi: 10.1016/0092-8674(94)90191-0. [DOI] [PubMed] [Google Scholar]
- 15.Agulnick A D, Taira M, Breen J J, Tanaka T, Dawid I B, Westphal H. Nature (London) 1996;384:270–272. doi: 10.1038/384270a0. [DOI] [PubMed] [Google Scholar]
- 16.Jurata L, Kenny D, Gill G. Proc Natl Acad Sci USA. 1996;93:11693–11698. doi: 10.1073/pnas.93.21.11693. [DOI] [PMC free article] [PubMed] [Google Scholar]
- 17.Bach I, Carrière C, Ostendorff H, Anderson B, Rosenfeld M. Genes Dev. 1997;11:1370–1380. doi: 10.1101/gad.11.11.1370. [DOI] [PubMed] [Google Scholar]
- 18.Kaelin W, Jr, Krek W, Sellers W, DeCaprio J, Ajchenbaum F, Fuchs C, Chittenden T, Li Y, Farnham P, Blanar M, Livingston D, Flemington E. Cell. 1992;70:351–364. doi: 10.1016/0092-8674(92)90108-o. [DOI] [PubMed] [Google Scholar]
- 19.Vinson C, LaMarco K, Johnson P, Landschulz W, McKnight S. Genes Dev. 1988;2:801–806. doi: 10.1101/gad.2.7.801. [DOI] [PubMed] [Google Scholar]
- 20.Murre C, McCaw P S, Baltimore D. Cell. 1989;56:777–783. doi: 10.1016/0092-8674(89)90682-x. [DOI] [PubMed] [Google Scholar]
- 21.Visvader J E, Elefanty A G, Strasser A, Adams J M. EMBO J. 1992;11:4557–4564. doi: 10.1002/j.1460-2075.1992.tb05557.x. [DOI] [PMC free article] [PubMed] [Google Scholar]
- 22.Huang D, Cory S, Strasser A. Oncogene. 1997;14:405–414. doi: 10.1038/sj.onc.1200848. [DOI] [PubMed] [Google Scholar]
- 23.Sassone-Corsi P, Visvader J, Ferland L, Mellon P, Verma I. Genes Dev. 1988;2:1529–1538. doi: 10.1101/gad.2.12a.1529. [DOI] [PubMed] [Google Scholar]
- 24.Hsu H-L, Huang L, Tsan J, Funk W, Wright W, Hu J-S, Kingston R, Baer R. Mol Cell Biol. 1994;14:1256–1265. doi: 10.1128/mcb.14.2.1256. [DOI] [PMC free article] [PubMed] [Google Scholar]
- 25.Weiss M, Yu C, Orkin S. Mol Cell Biol. 1997;17:1642–1651. doi: 10.1128/mcb.17.3.1642. [DOI] [PMC free article] [PubMed] [Google Scholar]
- 26.Visvader J, Begley C, Adams J. Oncogene. 1991;6:187–194. [PubMed] [Google Scholar]
- 27.Wilkinson D. In Situ Hybridization. New York: IRL; 1992. [Google Scholar]
- 28.Tsang A, Visvader J, Turner C, Fujiwara Y, Yu C, Weiss M, Crossley M, Orkin S. Cell. 1997;90:109–119. doi: 10.1016/s0092-8674(00)80318-9. [DOI] [PubMed] [Google Scholar]
- 29.Rabbitts T. Nature (London) 1994;372:143–149. doi: 10.1038/372143a0. [DOI] [PubMed] [Google Scholar]
- 30.Osada H, Grutz G, Axelson H, Forster A, Rabbitts T. Proc Natl Acad Sci USA. 1995;92:9585–9589. doi: 10.1073/pnas.92.21.9585. [DOI] [PMC free article] [PubMed] [Google Scholar]
- 31.Green A R, DeLuca E, Begley C G. EMBO J. 1991;10:4153–4158. doi: 10.1002/j.1460-2075.1991.tb04993.x. [DOI] [PMC free article] [PubMed] [Google Scholar]
- 32.Aplan P D, Nakahara K, Orkin S H, Kirsch I R. EMBO J. 1992;11:4073–4081. doi: 10.1002/j.1460-2075.1992.tb05500.x. [DOI] [PMC free article] [PubMed] [Google Scholar]
- 33.Sánchez-Garcia I, Osada H, Forster A, Rabbitts T. EMBO J. 1993;12:4243–4250. doi: 10.1002/j.1460-2075.1993.tb06108.x. [DOI] [PMC free article] [PubMed] [Google Scholar]
- 34.Taira M, Otani H, Saint-Jeannet J-P, Dawid I. Nature (London) 1994;372:677–679. doi: 10.1038/372677a0. [DOI] [PubMed] [Google Scholar]
- 35.German M, Wang J, Chadwick R, Rutter W. Genes Dev. 1992;6:2165–2176. doi: 10.1101/gad.6.11.2165. [DOI] [PubMed] [Google Scholar]
- 36.Bach I, Rhodes S, Pearse II R, Heinzel T, Gloss B, Scully K, Sawchenko P, Rosenfeld M. Proc Natl Acad Sci USA. 1995;92:2720–2724. doi: 10.1073/pnas.92.7.2720. [DOI] [PMC free article] [PubMed] [Google Scholar]
- 37.Jurata L, Gill G. Mol Cell Biol. 1997;17:5688–5698. doi: 10.1128/mcb.17.10.5688. [DOI] [PMC free article] [PubMed] [Google Scholar]