

Abstract
Current strategies to limit macrophage adhesion, fusion and fibrous capsule formation in the foreign body response have focused on modulating material surface properties. We hypothesize that topography close to biological scale, in the micron and nanometric range, provides a passive approach without bioactive agents to modulate macrophage behavior. In our study, topography-induced changes in macrophage behavior was examined using parallel gratings (250 nm-2 μm line width) imprinted on poly(s-caprolactone) (PCL), poly(lactic acid) (PLA) and poly(dimethyl siloxane) (PDMS). RAW 264.7 cell adhesion and elongation occurred maximally on 500 nm gratings compared to planar controls over 48 hr. TNF-α and VEGF secretion levels by RAW 264.7 cells showed greatest sensitivity to topographical effects, with reduced levels observed on larger grating sizes at 48 hr. In vivo studies at 21 days showed reduced macrophage adhesion density and degree of high cell fusion on 2 μm gratings compared to planar controls. It was concluded that topography affects macrophage behavior in the foreign body response on all polymer surfaces examined. Topography-induced changes, independent of surface chemistry, did not reveal distinctive patterns but do affect cell morphology and cytokine secretion in vitro, and cell adhesion in vivo particularly on larger size topography compared to planar controls.
Keywords: Microtopography, Nanotopography, Foreign body response, Nanostructured biomaterials, Inflammation and wound healing, Cytokines
1. Introduction
Monocyte and macrophage cells play a key role in mediating host tissue response to implants in the foreign body reaction [1-3]. This response is characterized by non-specific protein adsorption onto the implant surface, followed by monocyte attachment and differentiation into adherent macrophage cells on the surface. The activated macrophages secrete cytokines to recruit leukocytes and other cell types involved in the foreign body reaction, and further mediate inflammation and wound healing / remodeling around the site of implant. Within 2 to 4 weeks, unresolved inflammation, marked by macrophage fusion into large multinucleated foreign body giant cells (FBGCs) surround the implant in a fibrotic scar tissue. The FBGCs may release oxygen radicals, degradative enzymes and acid that contribute to implant degradation and eventual failure.
Current strategies to mediate the foreign body reaction focus on reducing protein adsorption, initial cell adhesion, inflammatory cytokine secretion and FBGC fusion. They assume two general approaches: (1) modulation of chemical and physical properties of the implant surface, and (2) incorporation of bioactive cues onto the material to mediate material-host tissue interaction. In the first approach, materials engineering designs include improving wear-resistant property of polymeric and metallic implants [4] and modifying surface wettability, charge and crystallinity [5-7]. Surface chemistry [8-11], roughness [12, 13], substrate stiffness [14, 15], and geometry [16] have also been altered to study their effects on cell adhesion and responses associated with foreign body reaction. In the second approach, biomimetic “smart” materials with functional activity in the form of surface functionalization or polymer coatings that release or generate soluble small molecules have been used to mediate implant-host tissue response. For example, coatings that release or generate nitric oxide (NO) reduce thrombogenesis and inflammation [17-19] and hydroxyapatite coatings on titanium alloys improve osteointegration in orthopedic implants [20]. Chemokines, cytokines and soluble molecules such as IL-4, IL-13 and α-tocopherol can mediate FBGC formation in vitro [21-23], including the expression of different β-integrin subunits temporally [24], while surface-tethered or adsorbed vitronectin has been shown to be a key component in macrophage activation and FBGC formation [25].
For simplicity and regulatory considerations, a passive approach of modifying the physicochemical properties without resorting to addition of bioactive agents would be preferred in an implant design. In addition to the physicochemical factors discussed above, topography is increasingly recognized as an important cue that influences cellular response [26-29]. In vivo extracellular matrix (ECM) architecture shown in scanning electron micrographs of basement membranes and collagen fibers often reveal a topography of pores, ridges and fibrillar structures at the micron and nanometer scales [30, 31]. Recent studies show that macrophage activation and FBGC formation respond to differing polymer fiber diameter [32, 33], surface roughness [34, 35] and geometry [36]. These findings highlight the possibility of using topography to mediate implant-tissue reaction, and stimulate the current study to systematically investigate the effects of topographical features on macrophage culture.
In this study, we examine the response of macrophage cells to nano- and microgratings composed of commonly used biomedical polymers in this study. Poly(ε-caprolactone) (PCL), poly(lactic acid) (PLA) and poly(dimethyl siloxane) (PDMS) gratings with line width ranging from 250 nm to 2 μm were fabricated by reversal nanoimprint lithography and embossing technique. The in vitro early response of RAW 264.7 cells to these synthetic topographies with respect to adhesion, morphology and cytokine secretion was characterized. Samples of PCL gratings nanoimprinted on Mylar were evaluated in rats using the cage implant model to determine the effect of topography on foreign body reaction.
2. Materials and Methods
All chemicals and polymers were purchased from Sigma-Aldrich (St. Louis, MO) and cell culture reagents were purchased from GibcoBRL (Grand Island, NY), unless otherwise specified.
2.1 Substrate Fabrication and Characterization
Reversal nanoimprint lithography (NIL) techniques previously developed [37, 38] were used to fabricate gratings of poly(lactic acid) (PLA, Mw 60,000) and poly(ε-caprolactone) (PCL, Mw 65,000) with a line width ranging from 250 nm to 2 μm approximating the length scales of fibrillar structures observed in native ECM but with precisely defined anisotropic topographical cues (Figure 1 A). Briefly, PCL and PLA polymer films are coated onto silicon molds and heated above the glass transition temperatures (Tg) to “flow” and acquire the topography of the molds. Then, plasma-treated glass and Mylar substrates are pressed against the polymer coated molds. The sandwich structures are then placed inside a NIL-4” imprinter (Obducat, Sweden), and imprinting completed at 150°C and 4 MPa. The polymer films are allowed to cool below its Tg before de-molding, with the desired topography transferred from the molds to the plasma-treated substrates with higher surface energy. Glass and Mylar substrates were selected for its optical properties in fluorescence imaging and as a model polymer used in implants, respectively. The gratings consist of constant spacing of 250 nm, 500 nm, and 2 μm apart (width:height:period = 1:1:2). NIL manipulates the Tg and thermo-viscosity of polymers to transfer topographical relief from a rigid mold onto the polymer. It provides a great degree of flexibility in choice of polymeric materials, patterns and imprinting process parameters to obtain topographical patterns of great fidelity ranging from the micron to nanometric scale [39, 40]. Controls were fabricated by embossing PCL (heated to 62°C) on silicon wafers and allowed to cool to room temperature, resulting in planar PCL controls with surface roughness of less than 4Å.
Figure 1. Topographical substrate fabrication process.

Schematics of (A) the nanoimprint lithography fabrication process, and (B) the hybrid fabrication technique combining soft lithography, stitching and embossing. PCL and PLA gratings were fabricated using the NIL technique, and PDMS gratings were fabricated using the hybrid technique.
To isolate 3-dimensional effects of topographical depth (compared to NIL substrates with a range of 250 nm to 2 μm depth), we adapted a hybrid technique of soft lithography, stitching and embossing to imprint parallel lines onto poly(dimethyl siloxane) (PDMS) (Sylgard® 184, Dow Corning, 10:1 pre-polymer:curing agent) (Figure 1 B). Briefly, the hybrid technique serially transferred patterns from a primary silicon mold (5×5 mm2) to secondary PDMS replicas using traditional soft lithography. The secondary PDMS replicas were stitched into a larger secondary mold, and embossed onto a tertiary polystyrene-coated silicon wafer (at least 35×35 mm2). The tertiary mold was used to fabricate PDMS replicas of grating widths 300 nm, 500 nm and 1 μm spaced equally apart (width:period = 1:2) and constant height (350 nm). Planar PDMS controls were fabricated by heat curing on planar silicon wafers for a smooth surface (width = 0 nm).
The pattern transfer fidelity from mold to replica was examined using scanning electron microscopy (SEM) (FEI XL30 SEM-FEG) and atomic force microscopy (AFM) (Veeco Dimension 3100). Samples were coated with a 10 nm layer of gold film (Denton Desk IV vacuum sputter coater) to improve sample conductivity for SEM imaging. Topography dimensions were measured using AFM tapping mode (20×20 μm2 scan areas) with silicon TESP probes. The O/E value, a ratio of the observed value (O) of the width, period or height to the expected value (E), provides a measurement of the deviation of fabricated topography from the ideal (i.e. ideal O/E = 1.00).
2.2 Cell Culture and Immunohistochemistry Staining
Adherent murine macrophage cell line, RAW 264.7 (ATCC, Manassas, VA), was grown in Dulbecco's Modified Eagle's Medium (DMEM) cell culture media supplemented with 10% fetal bovine serum, penicillin (100 μg/mL) and streptomycin (100 μg/mL). Immediately prior to use, PCL and PLA grating samples (5×5 mm2) were sterilized in 10% penicillin-streptomycin (diluted in phosphate buffer saline, PBS, pH 7.4) for 1 hour, and rinsed twice in PBS before cell seeding. PDMS grating samples were cut into 21 mm diameter discs and sterilized with 70% ethanol in place of 10% penicillin-streptomycin. Cells were seeded onto sterile samples at 2×10⁴ cells/cm2 in 2 mL fresh culture media in 12-well TCPS plates. Triplicates (n=3) of each grating size were used for each time point. The plates were maintained in an incubator at 37°C temperature, 5% CO2: 95% humidified air for 6 hr, 24 hr and 48 hr to study cell adhesion, morphology changes and cytokine secretion in response to topographical cues. Supernatant collected was centrifuged to remove cell debris and stored at -80°C until assayed for cytokine concentration.
At each time point, adherent cells on the gratings were fixed in 4% paraformaldehyde for 10 minutes in preparation for fluorescence microscopy imaging. Cells were permeabilized in 0.02% Triton-X for 20 minutes, followed by staining with Phalloidin Oregon-Green 488 and DAPI (Molecular Probes) for F-actin and cell nuclei, respectively, for 30 minutes. Each step was preceded and followed by a brief PBS rinse. Samples were mounted onto glass cover slips with Gel/Mount (Biomeda) before imaging. Similarly, samples were prepared for optical microscopy imaging by ice-cold methanol fixation for 5 minutes, then allowed to air-dry, followed by May-Grünwald Giemsa staining. Stained samples were allowed to further air-dry before digital imaging (ImagePro, Media Cybernetics) with a fluorescence and light microscope (Nikon TE2000U). 8-10 images of separate random regions (20× and 40× magnification) were taken per sample. Morphology measurements were made from at least 150 cells in each triplicate sample (n=3) per grating size. The R-ratio, a measure of elongation morphology change, was determined as the ratio of length of major axis:length of minor axis of a cell. A perfectly round cell has an elongation factor of R=1. Elongated cells were defined as having R≥2.5 and angled within 30° of the gratings. Image analysis was performed using ImageJ (NIH, Bethesda, MD) and ImagePro (Media Cybernetics).
SEM was used to examine cell interaction with its underlying topography. Adherent cells on gratings were prepared for SEM imaging using standard protocol of fixation and serial dehydration in ethanol and hexamethyldisilazane (HMDS). All samples were allowed to vacuum-dry overnight before sputter coating (Denton Desk IV) of a 10 nm gold layer.
2.3 Cytokine Secretion Profile Immunoassays
The cytokine secretion profile of RAW 264.7 in response to topography was examined on a Bio-Plex array system reader (Bio-Rad) using a multiplex suspension bead immunoassay kit (Millipore) for 8 cytokines: TNF-α, IL-1β, MIP-1α, MCP-1, VEGF, IL-6, IL-10 and IL-12. Briefly, supernatant was incubated with antibody-coupled beads overnight at 4°C, followed by incubation of cytokine-bound beads with secondary antibody for 1 hr. Phycoerythrin dye was bound to the beads via biotin-streptavidin binding for 30 minutes. All incubation steps were performed on a plate shaker at room temperature unless specified otherwise. Cytokine concentrations (pg/mL) in triplicates were measured from the mean fluorescence intensity readings and compared against 4- and 5-parameter logistic (4PL and 5PL) standard curves generated from readings of known concentration of cytokine standards provided in the kit. The Bio-Plex reader was calibrated and validated prior to every reading, strictly following the manufacturer's instructions.
2.4 In vivo Cage Implant System
PCL gratings imprinted on Mylar with line widths 2 μm and 500 nm were cut into 1.5 cm × 0.8 cm rectangular samples and prepared for subcutaneous implantation in the back of 12-week-old female Sprague-Dawley rats (Charles River, MA) using protocols as previously described [41-43]. Briefly, the samples were sterilized in 70% ethanol and ethylene oxide, then placed inside cylindrical surgical-grade stainless steel wire mesh cages (3.5 cm length × 1.0 cm diameter). Cages containing one of each PCL/Mylar gratings (2 μm and 500 nm) were implanted on the lateral sides on the back of an animal, using 3 to 5 animals for each grating size per time point. All protocols were approved by the Institutional Animal Care and Use Committee of Case Western Reserve University.
On days 7 and 21 post-implantation, the cage implants were explanted using previously described protocol [43]. Retrieved implants were stained with May-Grünwald Giemsa to evaluate adherent cell density and cellular fusion. Cellular adhesion was determined by the total number of nuclei in adherent cells including those in uni- and multi-nucleated cells in 8-10 fields-of-view of separate random regions (20× and 40× magnification) per sample. Cellular fusion was categorically estimated as the percentage of fusion in each field at 0%, <10%, 25%. 50%, 75%, >90% and 100%. A total of 24 to 72 fields were examined on 3-5 samples, and cellular fusion was presented as the percent of fields with the corresponding categorical percent fusion values. Cellular orientation to grating direction was similarly analyzed via optical microscopy and SEM. To examine cell-gratings interaction, the samples previously stained with May-Grünwald Giemsa were gently washed with distilled water to remove residual salt crystals, allowed to air dry, then sputter-coated with a 10 nm gold layer (Denton Desk IV) in preparation for SEM imaging.
2.5 Statistical Analysis
Results are presented as mean ± standard error of the mean. Statistical analysis was performed using Student's t-test or ANOVA followed by Tukey's post hoc test, as appropriate. A level of p<0.05 (two-tailed) was considered statistically significant.
3. Results
3.1 Substrate Fabrication and Characterization
NIL was successfully applied to fabricate various patterns on glass and Mylar. Figures 2A and B show respectively the characteristic SEM of 2 μm PCL gratings and 2 μm PLA gratings imprinted on treated glass with a residual layer. A sample with a residual layer has gratings with ridges and troughs of the same polymeric material. Conversely, a residual layer-free sample created with further etching, would have ridges made of polymeric materials (PCL or PLA) but troughs made of substrate materials (glass or Mylar).
Figure 2. Substrate characterization.
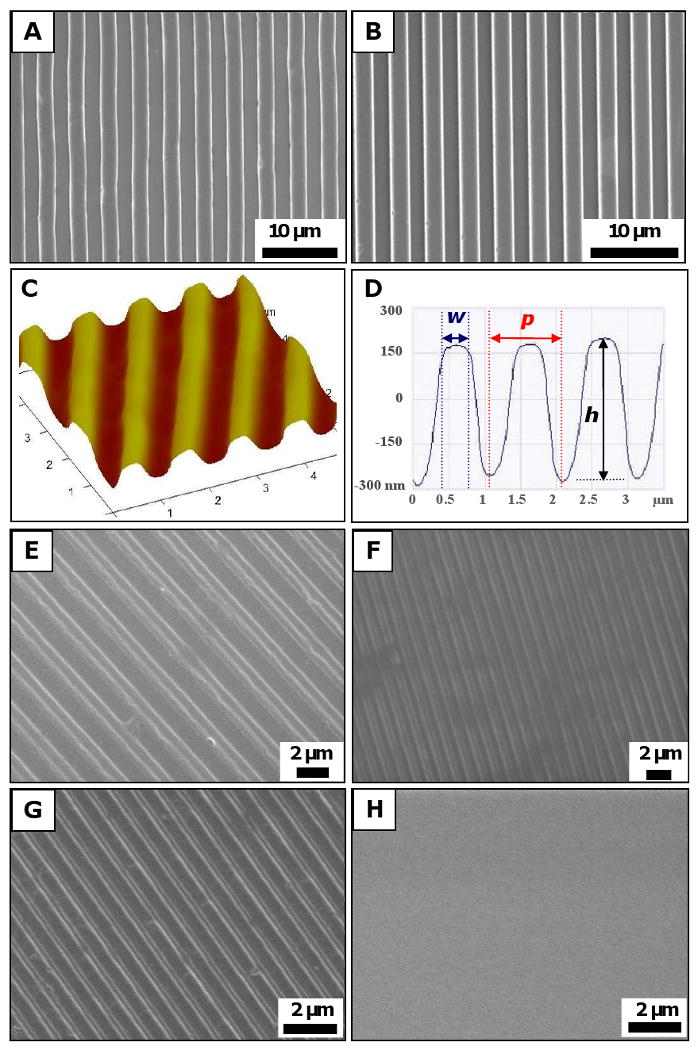
SEM micrographs of substrates fabricated using NIL technique: (A) 2 μm PCL gratings, and (B) 2 μm PLA gratings on treated glass. AFM characterization of (C) a 5×5 μm2 scan area on a 500 nm PCL sample imprinted on Mylar showed (D) dimensions of 500 nm width (w), 500 nm height (h) and 1 μm period (p). SEM micrographs of constant height PDMS gratings showed that the hybrid technique was successful in transferring patterns from rigid mold to PDMS replicas with high fidelity: (E) 1 μm grating width, (F) 500 nm gratings width, (G) 300 nm gratings width, and (H) planar controls. Scale bar = 10 μm (A-B), and 2 μm (E-H).
AFM characterization of the substrates measured its topography, as shown in a representative 3-dimensional projection of a 5×5 μm2 AFM scan of a 500 nm PCL gratings imprinted on Mylar sample (Figure 2 C). A cross-section of the 3-dimensional projection shows the gratings topography in terms of width (w), period (p) and height (h) (Figure 2 D). Table 1 summarizes topography dimensions measured from AFM scans. A comparison of the observed values (O) to the expected value (E) of the topographical gratings showed fidelity to be within 8% of expected feature size (O/E value of 1.08). The only discrepancy in pattern transfer fidelity occurred with respect to the height of 250 nm substrates, which has an O/E value of 0.46. This discrepancy was attributed to the sensitivity limit of the AFM readings because the AFM tip was larger than the spacing between the gratings (250 nm apart), and could not measure the actual trough of 250 nm samples, hence providing a lower height (h) value.
Table 1. AFM characterization of PCL/Mylar gratings.
| Topography1 | ||||
|---|---|---|---|---|
| Substrates | Width, w (nm) | Period, p (nm) | Height, h (nm) | |
| 250 nm | O2 | 270 (11) | 534 (12) | 114 (12) |
| E3 | 250 | 500 | 250 | |
| O/E | 1.08 | 1.07 | 0.46 | |
| n4 | 6 | 6 | 6 | |
| 500 nm | O | 518 (18) | 1,056 (19) | 486 (20) |
| E | 500 | 1,000 | 500 | |
| O/E | 1.04 | 1.06 | 0.97 | |
| n | 4 | 4 | 4 | |
| 2 μm | O | 2,064 (162) | 4,047 (51) | 1,972 (253) |
| E | 2,000 | 4,000 | 2,000 | |
| O/E | 1.03 | 1.01 | 0.99 | |
| n | 10 | 8 | 15 | |
Data presented as mean (standard deviation).
O = Observed value from AFM scan
E = Expected value of topography measurements
n = Number of measurements
Similarly, the hybrid technique was successful in fabricating PDMS replicas with gratings of varying widths (1 μm, 500 nm and 300 nm) at constant height (350 nm) (Figure 2 EH).
3.2 Cell Adhesion and Morphology Changes on NIL gratings
RAW 264.7 was cultured on 3 different types of polymers, PCL, PLA and PDMS gratings, to examine macrophage response to topography independent of surface chemistry. Cells elongated on the PDMS topographical gratings (Figure 3 A) compared to its native round shape on planar PDMS controls after 48h culture (Figure 3 B). This phenomenon was distinctively observed at the border of imprinted surfaces and its planar underlying substrates (Figures 3 C). Only on the 2 μm PLA gratings did the cells clearly elongate in the direction of gratings (left portion), as illustrated by the immunostained F-actin (green) and nuclei (blue) of the cells. In contrast, cells retained their native round morphology on the planar surface (right portion), separated by the distinct border (dotted white line). The underlying PLA topography and its border may be clearly seen in a phase contrast image of the 2 μm PLA gratings imprinted on glass (Figure 3 D), along with adherent RAW 264.7 cells. Similarly, macrophages elongated in the direction of gratings on three different widths of PCL gratings imprinted on glass: 2 μm (Figure 3 E), 500 nm (Figure 3 F), and 250 nm (Figure 3 G). In contrast, cells retained their native round shape on planar controls of glass (Figure 3 H), planar PCL film (Figure 3 I) and tissue culture polystyrene (TCPS, Figure 3 J).
Figure 3. Macrophage morphology changes on topographical gratings compared to planar controls.
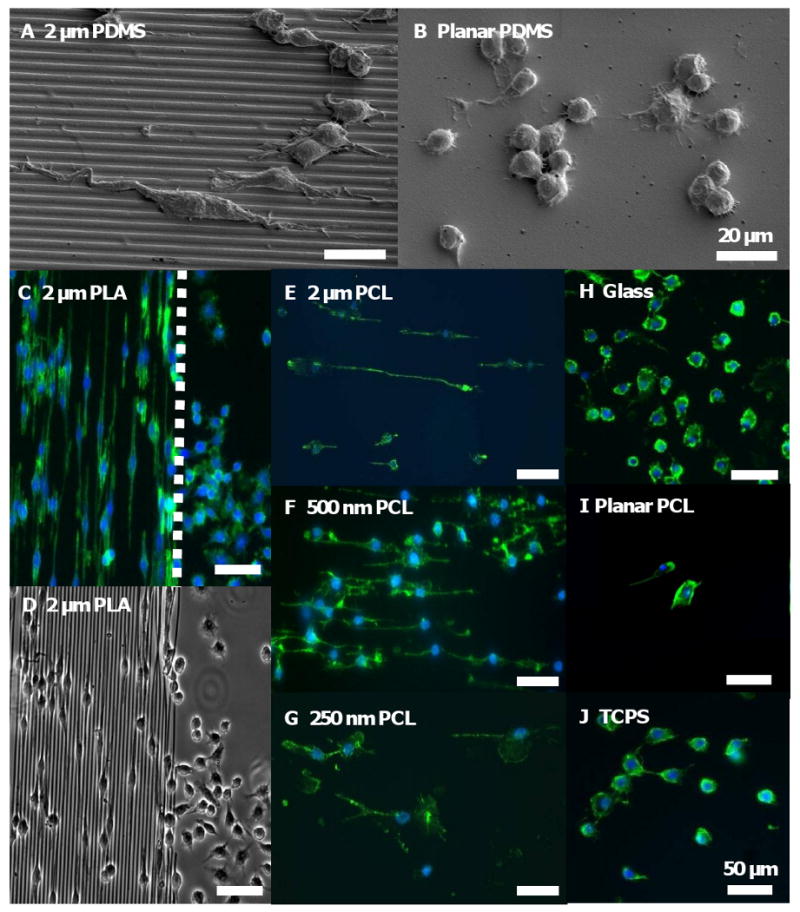
SEM micrographs of RAW 264.7 cultured on (A) 2 μm PDMS gratings for 48 hr showed that cells elongated in the direction of the gratings, but (B) maintained its native round morphology on the planar PDMS control. (C) Fluorescent staining of adherent RAW 264.7 cultured on 2 μm PLA gratings imprinted on glass for 48 hr showed distinct cell elongation in the direction of the gratings, in contrast to cells with round morphology on the planar border (dotted white line). (D) A phase contrast image of the sample clearly showed the border between the 2 μm PLA gratings and its planar surface. Cell elongation was similarly observed on PCL gratings imprinted on glass at 48 hr: (E) 2 μm gratings width, (F) 500 nm gratings width, and (G) 250 nm gratings width. In contrast, cells retained its native round shape on planar controls such as (H) glass, (I) planar PCL film and (J) tissue culture polystyrene (TCPS). F-actin and cell nuclei immunostaining were performed by Phalloidin Oregon Green-488 (green) and DAPI (blue), respectively. Scale bar = 20 μm (A-B), and 50 μm (C-J).
Analyzing the morphological changes in RAW 264.7 due to topography in greater detail, the average elongation ratio, R-ratio = length of major axis / length of minor axis, was measured for adherent cells on PCL gratings imprinted on Mylar (Figure 4 A). Micro- and nanotopography significantly increased the average R-ratio of adherent macrophage on all surfaces compared to planar controls (*p<0.05), particularly on 500 nm gratings (**p<0.01). The average R-ratio of macrophages on planar control was 1.78, but increased to 2.18 on 250 nm gratings and 2.53 on 500 nm gratings, and then decreased slightly to 2.24 on 2 μm gratings. The observed increase in R-ratio correlated with an increase in sub-population of cells attaining the elongated morphology, defined as having R ≥ 2.5 and aligned within 30° of the parallel gratings (Figure 4 B). The fraction of elongated cells increased from 0.10 on planar controls to 0.17 (66% increase), 0.23 (123% increase) and 0.20 (85% increase) on 250 nm, 500 nm and 2 μm gratings, respectively. While the fraction of elongated cells on each topography was small (less than 25% of total cell population), statistical significance was observed on 250 nm and 2 μm PCL gratings compared to planar control (*p<0.05), and on 500 nm gratings (**p<0.01). The average R-ratio of adherent cells on PCL gratings imprinted on glass was comparable to that of PCL gratings on Mylar, except for 250 nm gratings (#p<0.01) (Figure 4 C). The average R-ratios of cells on planar PCL (0 nm) imprinted on glass and on Mylar were significantly different (#p<0.01), and marginally higher than that on planar TCPS and glass controls.
Figure 4. Morphometric analysis of RAW 264.7 on NIL substrates. (A).

The average elongation ratio, R-ratio = (length of major axis)/(length of minor axis), of adherent cells on PCL gratings imprinted on Mylar showed statistical significance on all grating sizes compared to planar PCL controls: 250 nm (*p<0.05), 500 nm (*p<0.01) and 2 μm (*p<0.05). The average R-ratio increased from planar to 500 nm gratings but decreased on 2 μm gratings. (B) Of the total adherent cells, a small fraction (<25%) of cells were elongated in the same direction (within 30° angle) as the gratings. The changes in fraction of elongated cells (defined as R≥2.5) to topography shared the same trend as changes in average R-ratio, and were statistically significant compared to planar controls. (C) A comparison of average R-ratio on PCL gratings imprinted onto different treated surfaces (glass vs. Mylar) showed similar trends of increasing up to 500 nm but decreasing at 2 μm, with statistical significance (#p<0.05) between cells on planar glass vs Mylar (0 nm) and between cells on 250 nm glass vs 250 nm Mylar. Statistical analysis with student's t-test or one-way ANOVA comparison followed by Tukey's post-hoc test was used where needed. Statistical significance was noted at *p<0.05 and **p<0.01.
3.3 RAW 246.7 Response on Constant Height Topography
Compared to other cell types that have an increased R-ratio with decreased topographical size, the trend diverged in macrophage cells. We further investigated the topography-mediated changes in cell morphology by isolating the 3-dimensional effects with PDMS gratings varying in width but constant in pattern depth (350 nm). Cells were seeded on planar PDMS controls (Figure 5 A1-A3), 300 nm gratings (Figure 5 B1-B3), 500 nm gratings (Figure 5 C1-C3), and 1 μm gratings (Figure 5 D1-D3). Topography-induced changes in cell adhesion, spreading and elongation were examined at 6 hr (Figure 5 A1, B1, C1, D1), 24 hr (Figure 5 A2, B2, C2, D2,) and 48 hr (Figure 5 A3, B3, C3, D3). Adherent cells on PDMS gratings elongated along the parallel axis of gratings compared to planar controls.
Figure 5. RAW 264.7 response to PDMS topography.
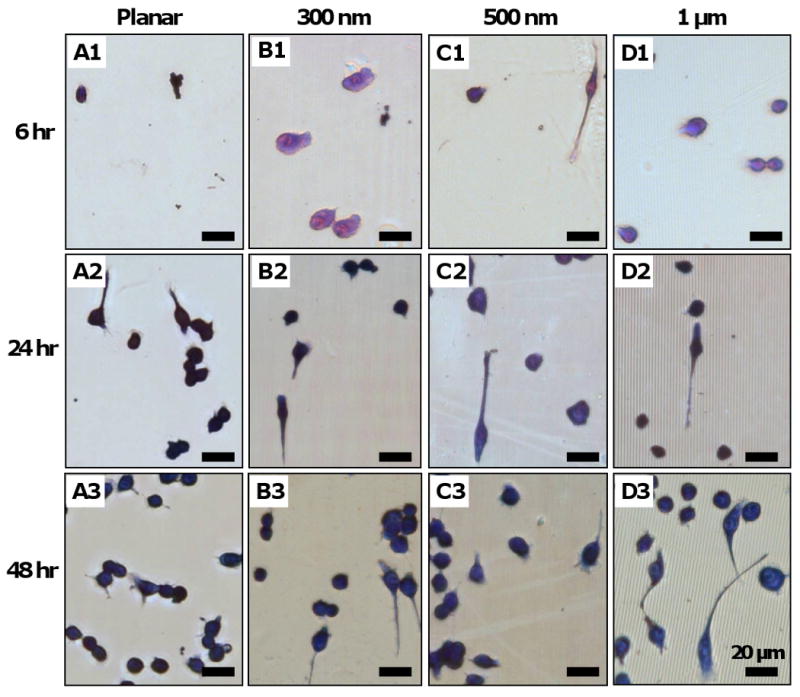

Photomicrographs of adherent cells on PDMS gratings and controls of constant height (at 350 nm): planar control (Column A), 300 nm gratings (Column B), 500 nm gratings (Column D), and 1μm gratings. Across all gratings size, cell adhesion was observed on 6 hr samples (A1-D1), while cell elongation in the direction of gratings was observed at 24 hr (A2-D2), and 48 hr (A3-D3). Morphometric analysis of adherent cells on PDMS topography showed (E) no statistical difference in cell adhesion density due to topography at 6 hr, 24 hr and 48 hr. (F) Cell spreading area was comparable at 6 hr and 24 hr, but was considered significant on 500 nm (p<0.05) and 1 μm gratings (p<0.05) compared to planar control at 48 hr. (G) A major fraction of total adherent cells (>85%) retain its native round shape, while (H) a small fraction of cells (<15%) acquired an elongated morphology of R≥2.5, with comparable levels across each pattern. (I) The average R-ratio of adherent cells (R-ratio = 1 to 2) was similarly comparable to that of round cells (I, inset). In contrast, (J) the R-ratio of elongated cells on each topographical pattern was higher (R-ratio = 3 to 4) but was not considered statistically significant. Data is reported as mean ± standard error of the mean (sample size, n = 3). ANOVA/Tukey's post hoc statistical test was used to examine data, and significance was determined at *p<0.05. Scale bar = 20 μm, May-Grünwald Giemsa stain, direction of gratings = vertical (B1-D3).
Morphometric analysis of RAW 264.7 response to topography showed that cell adhesion density on 6 hr samples was low (around 1 × 100 cells/mm2) and did not increase above the cell seeding density (at 2 × 100 cells/mm2) until between 24 hr and 48 hr (Figure 5 E), when proliferation occurred. However, cell adhesion density was comparable across all grating widths at each time point. Cell spreading of adherent macrophage was comparable across all grating sizes at 6 hr and 24 hr, but increased significantly on 500 nm and 1 μm gratings compared to planar PDMS control (Figure 5 F). Similar to macrophage adhesion and elongation on PCL gratings, the majority of adherent cells retained their native round shape (Figure 5 G) while elongated cells formed a small fraction, less than 15%, of total cells (Figure 5 F). The low average R-ratio of all adherent cells (R<2, Figure 5 I) was due to the round cells predominating in the sub-population (1.2<R<1.6, Figure 5 I, inset). However, the elongated cells had a higher R-ratio (R>3, Figure 5 J). The effect of topography on fractional distribution of elongated cells and average R-ratio was not statistically significant. It was noted that cell elongation generally increased the average cell area compared to its native round shape on each topographical pattern (Supplementary Figure 1).
3.4 Cytokine Secretion Profile
The cytokine secretion profile of RAW 264.7 cells cultured on PDMS samples was measured at 6 hr, 24 hr and 48 hr using multiplex immunoassays. The cytokines examined were categorized into pro-/anti-inflammation, and pro-/anti-wound healing according to their respective roles in the foreign body response [9, 10]. TNF-α (tumor necrosis factor-α), MIP-1α (macrophage inflammatory protein-1α), MCP-1 (monocyte chemoattractant protein-1) and VEGF (vascular endothelial growth factor) cytokines were detected in the supernatant. To account for variation in cell density among the grating sizes, cytokine production was normalized to its respective cell number (Figure 6). Supplementary Figures 2 and 3 show the corresponding total cytokine production levels and relative expression of topography-induced cytokine secretion normalized to planar PDMS (0 nm), respectively. During the initial stages of cell adhesion and morphology change RAW 264.7 secreted pro-inflammatory/anti-wound healing cytokines TNF-α, MIP-1α and MCP-1. The temporal secretion of TNF-α, MIP-1α and MCP-1 (pg/mL per 1000 cells) generally increased from 6 hr to 24 hr, then decreased slightly at 48 hr (Figure 6 A-C). In contrast, VEGF was low at 6 hr to 24 hr (<0.5 pg/mL per 1000 cells, Figure 6 D), but increased at 48 hr. Between 24 hr to 48 hr, the levels of pro-inflammatory cytokines TNF-α, MIP-1α and MCP-1 were maintained or reduced, while VEGF, a pro-inflammation/pro-wound healing cytokine, increased. Together, these results suggest a transition from a proinflammatory cytokine profile (TNF-α, MIP-1α, MCP-1) at 6 hr and 24 hr towards a pro-wound healing cytokine profile (VEGF) at 48 hr.
Figure 6. Cytokine secretion profile normalized to cell number.

The normalized cytokine secretion levels of cells (pg/mL per 1000 cells) in response to PDMS topography were detected using multiplex immunoassay for (A) TNF-α, (B) MIP-1α, (C) MCP-1, and (D) VEGF. Data is reported as mean ± standard error of the mean (n=3). ANOVA/Tukey's post hoc statistical test was used to examine data, and significance was determined at *p<0.05, #p<0.01, **p<0.005.
A more detailed analysis of using ANOVA and Tukey's post-hoc test showed statistical significance in topography-induced TNF-α secretion (Figure 6 A) at 6 hr, particularly on 1 μm gratings compared to planar and 500 nm samples (*p<0.05). At 24 hr, increasing grating width increased TNF-α secretion (*p<0.001), but the trend was reversed at 48 hr (*p<0.05), with statistical significance noted for 1 μm gratings compared to 300 nm gratings. The topographical effect on MIP-1α secretion was difficult to discern (Figure 6 B) but significance was observed at 6 hr for 300 nm samples compared to planar control (*p<0.05), at 24 hr for 1 μm gratings compared to 300 nm and 500 nm samples (*p<0.01), and at 48 hr for 300 nm, 500 nm and 1 μm gratings compared to planar samples (*p<0.05). Similarly, the MCP-1 secretion profile shared the same trend as TNF-α secretion (Figure 6 C). Topography-induced MCP-1 secretion was most significant at 24 hr (*p<0.001) with increasing MCP-1 levels on increasing grating sizes: planar (*p<0.01), 300 nm (*p<0.05) and 500 nm (*p<0.05) compared to 1 μm gratings, but was difficult to discern at 48 hr. VEGF cytokine secretion (Figure 6 D) responded significantly to topography at 6 hr (*p<0.05), 24 hr (*p<0.05), and 48 hr (*p<0.005). In particular at 48 hr, increasing grating width caused a significant decrease in VEGF levels, with the greatest decrease measured on 1 μm gratings compared to other topographical samples: planar (*p<0.01), 300 nm gratings (*p<0.01) and 500 nm gratings (*p<0.05).
Patterns in topography-induced cytokine secretion were difficult to discern but greater statistical significance was observed for 24 hr and 48 hr readings. The pro-inflammatory and pro-wound healing cytokine IL-1β, and the anti-inflammatory and pro-wound healing cytokines IL-6, IL-10, and IL-12 were not detected in the supernatant (detection limit: 3.2 pg/mL).
3.5 In vivo Characterization in the Rat Cage Implant System
The in vitro results of RAW 264.7 cells prompted us to investigate the corresponding in vivo macrophage response to topography. Samples of 2 μm and 500 nm PCL gratings imprinted on Mylar (PCL/Mylar) were subcutaneously implanted into rats using the cage implant model, an established system for studying host tissue-implant response [44]. At Days 7 and 21, the implants were retrieved to examine macrophage attachment and FBGC fusion on the different gratings (Figure 7 A-F). As the subcutaneous cage implant system allows for cellular adhesion on both surfaces of the samples, the reverse side of the sample was used as a planar Mylar control (0 nm). Macrophage adhesion and foreign body giant cell (FBGC) fusion were present on all grating samples at Day 7 (Figure 7 A, C, E) and Day 21 (Figure 7 B, D, F). Cells became thinly spread and flattened on the PCL gratings. Cellular adhesion was determined based on the total number of nuclei in adherent cells, including macrophages and FBGCs. The density of adherent macrophage nuclei generally decreased from Days 7 to 21 (Figure 7 G) with comparable nuclei density observed on all grating samples, except for increased cell density on 2 μm gratings compared to planar control at Day 21 (*p<0.05).
Figure 7. In vivo cellular adhesion and fusion on PCL gratings imprinted on Mylar.
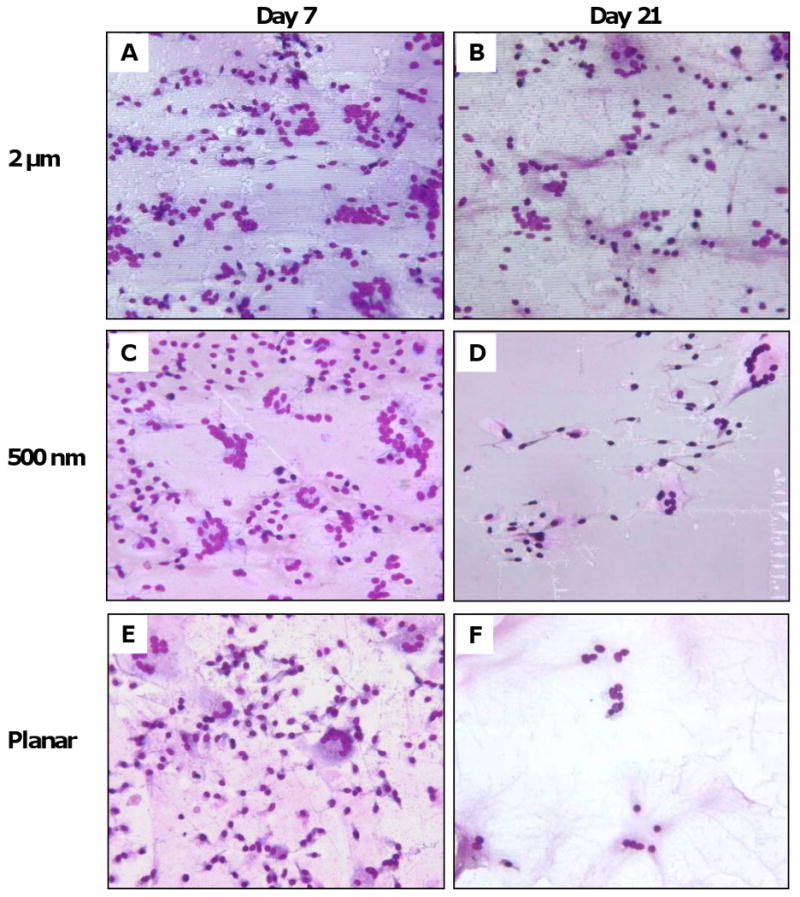

Photomicrographs of macrophage cell adhesion and fusion on PCL/Mylar samples: (A-B) 2 μm gratings, (C-D) 500 nm gratings, and (E-F) planar Mylar control, at Day 7 (A, C, E) and Day 21 (B, D, F). (G) Cell adhesion density due to topography was comparable across all PCL gratings sizes at Day 7 (diamonds), then decreasing at Day 21 (squares). Adhesion density on 2 μm PCL gratings was statistically significant compared to planar Mylar controls (*p<0.05). (H) Low fusion (<10% of fields with the corresponding percent FBGC fusion) decreased as grating size increased at Day 7, but the trend was reversed on Day 21. In contrast, high fusion (>90% of fields with the corresponding percent FBGC fusion) was low at Day 7 but increased at Day 21, with a trend of decreasing high fusion on larger gratings. Magnification = 20×, May-Grünwald Giemsa stain (A-F).
Due to the highly spread morphology of the stained adherent cells, it was difficult to distinguish FBGC borders from background staining. Instead of counting the fraction of nuclei contained within FBGCs, we estimated the percentage of fusion in each field-of-view categorically at 0%, <10%, 25%. 50%, 75%, >90% or 100%. A total of 24 to 72 fields-of-view were examined on 3-5 samples per grating size, and the percentage of fusion was presented as the percentage of fields-of-view with the corresponding categorical percentage fusion values. The extent of cell fusion was defined as low (<10%), medium (25%-75%), or high fusion (>90%), summarized in Table 2. At Day 7, fusion was minimal on all surfaces with 58-74% of fields having low (<10%) or no fusion (0%), and only 0-5% of fields with high fusion (>90%). At Day 21, fusion increased on all surfaces. Approximately 25-55% of fields on surfaces registered high levels of fusion (>90%) while only 28-37% of fields supported low fusion (<10%). Topography-induced cellular fusion showed that low fusion decreased with increasing grating sizes at Day 7, but the trend reversed at Day 21 (Figure 7 H). In contrast, high fusion was not prevalent at Day 7 but showed a decreasing trend with larger grating sizes.
Table 2. In vivo FBGC fusion on PCL/Mylar gratings.
| Day | Material | Width (nm) | Percentage of Fields with the Corresponding Percent Fusion1 | Low Fusion2 | Medium3 | High Fusion4 | ||||||
|---|---|---|---|---|---|---|---|---|---|---|---|---|
| Low Fusion | Medium Fusion | High Fusion | ||||||||||
| 0% | <10% | 25% | 50% | 75% | >90% | 100% | <10% | 25-75% | >90% | |||
| 7 | Mylar | 0 | 56 | 18 | 12 | 12 | 3 | 0 | 0 | 74 | 27 | 0 |
| 500 nm | 500 | 55 | 18 | 15 | 5 | 3 | 5 | 0 | 73 | 23 | 5 | |
| 2 μm | 2000 | 43 | 15 | 20 | 5 | 13 | 5 | 0 | 58 | 38 | 5 | |
| 21 | Mylar | 0 | 25 | 3 | 8 | 3 | 8 | 25 | 30 | 28 | 19 | 55 |
| 500 nm | 500 | 33 | 3 | 5 | 8 | 20 | 30 | 3 | 36 | 33 | 33 | |
| 2 μm | 2000 | 29 | 8 | 17 | 0 | 21 | 25 | 0 | 37 | 38 | 25 | |
A total of 24-72 fields were analyzed on 3-5 samples
Summation of fields with 0% and <10% fusion
Summation of fields with 25%, 50% and 75% fusion
Summation of fields with >90% and 100% fusion
No distinct patterns of cell elongation and alignment to the topographical substrates were observed at Days 7 or 21. While most adherent cells and FBGCs displayed a thinly spread morphology on the PCL/Mylar surfaces, some cells displayed elongated morphologies and the extension of pseudopodia in the direction of gratings, confirmed by SEM imaging (Supplementary Figure 4). Cell elongation and pseudopodia presence indicated cellular migration across the surfaces.
4. Discussion
The nanoimprint lithography (NIL) fabrication technique allowed the introduction of PCL and PLA with topographical relief onto glass (optical clarity for microscopy) or Mylar (model implant biomaterial) substrates. Cellular studies were conducted on PCL and PLA topography with a residual layer to create a uniform surface chemistry between the ridges and troughs of the gratings. However, the contractile forces of adherent RAW 264.7 caused the polymer topography to delaminate over 24 hr to 48 hr. This necessitated the development of the stitching and embossing techniques to fabricate PDMS replicas that were inert, could withstand cell contractile forces, optically clear and with sufficiently large cell growth area for cellular studies.
Adhesion, elongation and alignment of RAW 264.7 to its underlying topography was clearly observed on PCL and PLA gratings (width:height:period = 1:1:2) and on PDMS substrates of constant height (width:period = 1:2, height = 350 nm), independent of surface chemistry. The lack of distinctive trends in cell morphology and orientation changes of both RAW 264.7 and in vivo macrophage cells to the topography differed from our previous studies involving other cell types, such as mesenchymal stem cells [26] and smooth muscle cells [45], that showed over 80% cell elongation and alignment. Macrophage cells studies in our system showed that elongation increased with decreasing topography, but only to a limit of 500 nm before the trend diverged. Macrophage cells appeared to be relatively insensitive to nanotopography (less than 500 nm), preferring to respond to 500 nm, 1 μm and 2 μm gratings. The phenomenon appears to mirror that of phagocytosis, where macrophages preferentially internalize particulates in the micron range over the nanometric range, with peak phagocytosis observed with particles of approximately 2 μm in diameter [46-48]. The intrinsic properties of membrane ruffles in macrophages have been postulated to contribute to size sensitivity during the attachment step of phagocytosis of such particles [49]. Contractile forces exerted by macrophage cells during cell spreading, elongation and migration delaminated PCL nanogratings from its treated substrates and also distorted 1 μm PDMS gratings in our studies (Figure 5). While the infinitely long parallel gratings, compared to a cell dimension, provide a non-phagocytosable surface, the limit of macrophage sensitivity to nanotopographical cues could be compared to a surface area dependence on pro-inflammation response, analogous to surface area dependence of nanoparticles in determining inflammatory response [50, 51], and the influence of particle shape and size on internalization kinetics [52].
By measuring the functional response of macrophages in terms of its cytokine secretion profile, our results show that macrophages do respond to topographical cues in the early 6 - 48 hr inflammation stage. TNF-α secretion has been implicated in inducing apoptosis of adherent macrophage on biomaterials [53], while MIP-1α is involved in chemotaxis and recruitment of monocytes and leukocytes during the inflammatory response. The MIP-1α secretion profile agreed with initial inflammation observed, followed by a transition towards pro-wound healing activity. MCP-1 (macrophage chemoattractant protein-1), a chemokine that recruits macrophage and promotes migration, also stimulates murine FBGC fusion in vivo [54]. VEGF promotes blood vessel dilation and angiogenesis in the event of inflammation to promote wound healing in damaged tissue. Reduction of pro-inflammatory (TNF-α) and pro-wound healing (VEGF) cytokine levels on 1 μm gratings compared to planar and nanogratings suggest that inflammation-related processes may be reduced on 1 μm topography compared to nanogratings and planar controls.
We observed that topography affected in vivo macrophage functional response in terms of adherent cell density particularly on 2 μm PCL gratings compared to planar controls. In the long term response (21 days), high cellular fusion (>90%) was reduced as grating sizes increased: represented as high fusion on planar > 500 nm > 2 μm (Figure 7 G). The larger topographical cues (2 μm gratings) could be presenting a physical interruption or constraint to the fibrous scar tissue formation process, reducing cell adhesion density and limiting FBGC fusion on larger gratings compared to planar controls. Sanders et al. showed thinner in vivo fibrous capsule formation around smaller microfibers (1-5 μm diameter) compared to larger ones (6-10 μm diameter) for a variety of polymers [55], attributing these results to polymer surface curvature or cell-substrate contact area that minimally activates macrophages and its inflammatory response. Our results suggest that larger size topography (500 nm-2 μm) limits macrophage activation and inflammation-related processes but topography-induced sensitivity reaches a limit around 500 nm. Smaller topography (250-300 nm) and planar controls may share the same adhesion and motility kinetics that result in the conventional macrophage adhesion, spreading and fusion observed during foreign body response. Although the intrinsic dynamic and plastic roles of the macrophage cell system may mask or cause an averaging of topography-induced response both in vitro and in vivo, the heterogeneity of cell morphologies observed (elongated and round cells) reflect the diverse plasticity of macrophage cells that define its myriad of phenotypes [56]. Macrophage desensitization to nanotopographical cues below 500 nm could be an advantage in motility and movement into different tissue types. Macrophages differentiate from non-adherent monocytic precursors that move throughout the vascular system into adherent macrophages that migrate into different organs and tissue, with specific functional roles that differ widely such as MHC (major histocompatibility complex) presentation in the innate immune response, phagocytosis, osteoclast fusion and bone resorption, and wound healing [57, 58].
The consistent cellular response to three different types of polymers (PCL, PLA and PDMS) in our studies confirm that topography dictates changes in macrophage behavior, independent of surface chemistry. Topography-induced changes using our model surfaces could be examined at a greater number of time points and over a longer period of study to elucidate the complex cross-talk between cells and cytokines that varies temporally and spatially throughout the inflammation and wound healing process. Cellular changes observed in our studies focused on macrophages cultured on micro- and nanopatterns of fixed width parallel lines. The use of additional patterns and geometry in future studies, such as fixed width gratings of varying depths, pillars, pits or islands, would enhance our understanding of macrophage response to topography. Topography-induced change in macrophage behavior provides an opportunity to influence its phenotypic response such as cell activation, motility, maturation and fusion in the foreign body response without the addition of bioactive cues. Cellular responses to topography are known to affect cell function in terms of adhesion strength, spreading, intracellular signaling and differentiation potential [59-61]. This has been observed in various cell types including, but not limited to, mesenchymal stem cells [62-64], endothelial cells [65, 66], fibroblasts [67, 68] and epithelial cells [69-71]. By improving our understanding of topographical effects on macrophage behavior, we may design biocompatible materials with optimal topographical cues that could mediate macrophage behavior in the foreign body reaction favorably.
5. Conclusions
This study suggests that topography may modulate the phenotypes of macrophages in the context of foreign body reaction. Although the response to topography in the form of gratings from micro- to submicron scale has not revealed a distinctive pattern, topography indeed affects cell morphology, cytokine secretion in vitro, and cell adhesion in vivo particularly for larger size patterns compared to planar controls. The changes in cell morphology are observed in three different types of polymers, indicating that the findings in this study are topography-mediated. The weak correlation between topographical features and macrophage response may be a reflection of the intrinsically dynamic, heterogeneous, and complex nature of the macrophage cell system, which might mask the relationship due to our limited time point investigation and ensemble analysis. The role of topography in modulating implant-tissue reaction would require further elucidation; this study suggests that it is a fruitful direction that might impact biomaterials design.
Supplementary Material
Acknowledgments
Support from NIH (grant numbers HL83008 and EB000282) is acknowledged. We are grateful to Dr. Yong Yang in teaching us the hybrid technique to fabricate a large nanopatterned surface area for cell culture. We also acknowledge the expertise of Wei Zhao in fabricating NIL-imprinted PCL on Mylar substrates.
Footnotes
Publisher's Disclaimer: This is a PDF file of an unedited manuscript that has been accepted for publication. As a service to our customers we are providing this early version of the manuscript. The manuscript will undergo copyediting, typesetting, and review of the resulting proof before it is published in its final citable form. Please note that during the production process errors may be discovered which could affect the content, and all legal disclaimers that apply to the journal pertain.
The authors confirm that there are no known conflicts of interest associated with this publication and there has been no significant financial support for this work that could have influenced its outcome.
References
- 1.Williams DF. On the mechanisms of biocompatibility. Biomaterials. 2008;29:2941–53. doi: 10.1016/j.biomaterials.2008.04.023. [DOI] [PubMed] [Google Scholar]
- 2.Anderson JM, Rodriguez A, Chang DT. Foreign body reaction to biomaterials. Semin Immunol. 2008;20:86–100. doi: 10.1016/j.smim.2007.11.004. [DOI] [PMC free article] [PubMed] [Google Scholar]
- 3.Ratner BD, Bryant SJ. Biomaterials: where we have been and where we are going. Annu Rev Biomed Eng. 2004;6:41–75. doi: 10.1146/annurev.bioeng.6.040803.140027. [DOI] [PubMed] [Google Scholar]
- 4.Atienza C, Maloney WJ. Highly cross-linked polyethylene bearing surfaces in total hip arthroplasty. J Surg Orthop Adv. 2008;17:27–33. [PubMed] [Google Scholar]
- 5.Santerre JP, Woodhouse K, Laroche G, Labow RS. Understanding the biodegradation of polyurethanes: from classical implants to tissue engineering materials. Biomaterials. 2005;26:7457–70. doi: 10.1016/j.biomaterials.2005.05.079. [DOI] [PubMed] [Google Scholar]
- 6.Ward B, Anderson J, McVenes R, Stokes K. In vivo biostability of polyether polyurethanes with fluoropolymer surface modifying endgroups: resistance to biologic oxidation and stress cracking. J Biomed Mater Res A. 2007;80:33–44. doi: 10.1002/jbm.a.30802. [DOI] [PubMed] [Google Scholar]
- 7.Jones JA, Qin LA, Meyerson H, Kwon IK, Matsuda T, Anderson JM. Instability of self-assembled monolayers as a model material system for macrophage/FBGC cellular behavior. J Biomed Mater Res A. 2008;84:158–66. doi: 10.1002/jbm.a.31660. [DOI] [PMC free article] [PubMed] [Google Scholar]
- 8.Brodbeck WG, Nakayama Y, Matsuda T, Colton E, Ziats NP, Anderson JM. Biomaterial surface chemistry dictates adherent monocyte/macrophage cytokine expression in vitro. Cytokine. 2002;18:311–9. doi: 10.1006/cyto.2002.1048. [DOI] [PubMed] [Google Scholar]
- 9.Brodbeck WG, Voskerician G, Ziats NP, Nakayama Y, Matsuda T, Anderson JM. In vivo leukocyte cytokine mRNA responses to biomaterials are dependent on surface chemistry. J Biomed Mater Res A. 2003;64:320–9. doi: 10.1002/jbm.a.10425. [DOI] [PubMed] [Google Scholar]
- 10.Schutte RJ, Parisi-Amon A, Reichert WM. Cytokine profiling using monocytes/macrophages cultured on common biomaterials with a range of surface chemistries. J Biomed Mater Res A. 2009;88:128–39. doi: 10.1002/jbm.a.31863. [DOI] [PMC free article] [PubMed] [Google Scholar]
- 11.Tang YW, Labow RS, Revenko I, Santerre JP. Influence of surface morphology and chemistry on the enzyme catalyzed biodegradation of polycarbonate-urethanes. J Biomater Sci Polym Ed. 2002;13:463–83. doi: 10.1163/156856202320253965. [DOI] [PubMed] [Google Scholar]
- 12.Refai AK, Textor M, Brunette DM, Waterfield JD. Effect of titanium surface topography on macrophage activation and secretion of proinflammatory cytokines and chemokines. J Biomed Mater Res A. 2004;70:194–205. doi: 10.1002/jbm.a.30075. [DOI] [PubMed] [Google Scholar]
- 13.Ingram JH, Stone M, Fisher J, Ingham E. The influence of molecular weight, crosslinking and counterface roughness on TNF-alpha production by macrophages in response to ultra high molecular weight polyethylene particles. Biomaterials. 2004;25:3511–22. doi: 10.1016/j.biomaterials.2003.10.054. [DOI] [PubMed] [Google Scholar]
- 14.Irwin EF, Saha K, Rosenbluth M, Gamble LJ, Castner DG, Healy KE. Modulus-dependent macrophage adhesion and behavior. J Biomater Sci Polym Ed. 2008;19:1363–82. doi: 10.1163/156856208786052407. [DOI] [PubMed] [Google Scholar]
- 15.Fereol S, Fodil R, Labat B, Galiacy S, Laurent VM, Louis B, et al. Sensitivity of alveolar macrophages to substrate mechanical and adhesive properties. Cell Motil Cytoskeleton. 2006;63:321–40. doi: 10.1002/cm.20130. [DOI] [PubMed] [Google Scholar]
- 16.Voskerician G, Gingras PH, Anderson JM. Macroporous condensed poly(tetrafluoroethylene). I. In vivo inflammatory response and healing characteristics. J Biomed Mater Res A. 2006;76:234–42. doi: 10.1002/jbm.a.30481. [DOI] [PubMed] [Google Scholar]
- 17.Williams D. The role of nitric oxide in biocompatibility. Med Device Technol. 2008;19:8, 10. [PubMed] [Google Scholar]
- 18.Batchelor MM, Reoma SL, Fleser PS, Nuthakki VK, Callahan RE, Shanley CJ, et al. More lipophilic dialkyldiamine-based diazeniumdiolates: synthesis, characterization, and application in preparing thromboresistant nitric oxide release polymeric coatings. J Med Chem. 2003;46:5153–61. doi: 10.1021/jm030286t. [DOI] [PubMed] [Google Scholar]
- 19.Smith DJ, Chakravarthy D, Pulfer S, Simmons ML, Hrabie JA, Citro ML, et al. Nitric oxide-releasing polymers containing the [N(O)NO]- group. J Med Chem. 1996;39:1148–56. doi: 10.1021/jm950652b. [DOI] [PubMed] [Google Scholar]
- 20.Balasundaram G, Webster TJ. Nanotechnology and biomaterials for orthopedic medical applications. Nanomed. 2006;1:169–76. doi: 10.2217/17435889.1.2.169. [DOI] [PubMed] [Google Scholar]
- 21.McNally AK, DeFife KM, Anderson JM. Interleukin-4-induced macrophage fusion is prevented by inhibitors of mannose receptor activity. Am J Pathol. 1996;149:975–85. [PMC free article] [PubMed] [Google Scholar]
- 22.DeFife KM, Jenney CR, McNally AK, Colton E, Anderson JM. Interleukin-13 induces human monocyte/macrophage fusion and macrophage mannose receptor expression. J Immunol. 1997;158:3385–90. [PubMed] [Google Scholar]
- 23.McNally AK, Anderson JM. Foreign body-type multinucleated giant cell formation is potently induced by alpha-tocopherol and prevented by the diacylglycerol kinase inhibitor R59022. Am J Pathol. 2003;163:1147–56. doi: 10.1016/s0002-9440(10)63474-8. [DOI] [PMC free article] [PubMed] [Google Scholar]
- 24.McNally AK, Anderson JM. Beta1 and beta2 integrins mediate adhesion during macrophage fusion and multinucleated foreign body giant cell formation. Am J Pathol. 2002;160:621–30. doi: 10.1016/s0002-9440(10)64882-1. [DOI] [PMC free article] [PubMed] [Google Scholar]
- 25.McNally AK, Jones JA, Macewan SR, Colton E, Anderson JM. Vitronectin is a critical protein adhesion substrate for IL-4-induced foreign body giant cell formation. J Biomed Mater Res A. 2008;86:535–43. doi: 10.1002/jbm.a.31658. [DOI] [PMC free article] [PubMed] [Google Scholar]
- 26.Yim EK, Pang SW, Leong KW. Synthetic nanostructures inducing differentiation of human mesenchymal stem cells into neuronal lineage. Exp Cell Res. 2007;313:1820–9. doi: 10.1016/j.yexcr.2007.02.031. [DOI] [PMC free article] [PubMed] [Google Scholar]
- 27.Dalby MJ, Gadegaard N, Curtis AS, Oreffo RO. Nanotopographical control of human osteoprogenitor differentiation. Curr Stem Cell Res Ther. 2007;2:129–38. doi: 10.2174/157488807780599220. [DOI] [PubMed] [Google Scholar]
- 28.Hansen JC, Lim JY, Xu LC, Siedlecki CA, Mauger DT, Donahue HJ. Effect of surface nanoscale topography on elastic modulus of individual osteoblastic cells as determined by atomic force microscopy. J Biomech. 2007;40:2865–71. doi: 10.1016/j.jbiomech.2007.03.018. [DOI] [PMC free article] [PubMed] [Google Scholar]
- 29.Dalby MJ, Gadegaard N, Wilkinson CD. The response of fibroblasts to hexagonal nanotopography fabricated by electron beam lithography. J Biomed Mater Res A. 2008;84:973–9. doi: 10.1002/jbm.a.31409. [DOI] [PubMed] [Google Scholar]
- 30.Abrams GA, Bentley E, Nealey PF, Murphy CJ. Electron microscopy of the canine corneal basement membranes. Cells Tissues Organs. 2002;170:251–7. doi: 10.1159/000047929. [DOI] [PubMed] [Google Scholar]
- 31.Abrams GA, Murphy CJ, Wang ZY, Nealey PF, Bjorling DE. Ultrastructural basement membrane topography of the bladder epithelium. Urol Res. 2003;31:341–6. doi: 10.1007/s00240-003-0347-9. [DOI] [PubMed] [Google Scholar]
- 32.Sanders JE, Stiles CE, Hayes CL. Tissue response to single-polymer fibers of varying diameters: evaluation of fibrous encapsulation and macrophage density. J Biomed Mater Res. 2000;52:231–7. doi: 10.1002/1097-4636(200010)52:1<231::aid-jbm29>3.0.co;2-e. [DOI] [PubMed] [Google Scholar]
- 33.Cao H, McHugh K, Chew SY, Anderson JM. The topographical effect of electrospun nanofibrous scaffolds on the in vivo and in vitro foreign body reaction. 2010 doi: 10.1002/jbm.a.32609. In press. [DOI] [PMC free article] [PubMed] [Google Scholar]
- 34.Fink J, Fuhrmann R, Scharnweber T, Franke RP. Stimulation of monocytes and macrophages: possible influence of surface roughness. Clin Hemorheol Microcirc. 2008;39:205–12. [PubMed] [Google Scholar]
- 35.Spiller D, Mirtelli C, Losi P, Briganti E, Sbrana S, Counoupas C, et al. In vitro evaluation of the PEtU-PDMS material immunocompatibility: the influence of surface topography and PDMS content. J Mater Sci Mater Med. 2009;20:2511–20. doi: 10.1007/s10856-009-3823-0. [DOI] [PubMed] [Google Scholar]
- 36.Schulte VA, Diez M, Moller M, Lensen MC. Surface topography induces fibroblast adhesion on intrinsically nonadhesive poly(ethylene glycol) substrates. Biomacromolecules. 2009;10:2795–801. doi: 10.1021/bm900631s. [DOI] [PubMed] [Google Scholar]
- 37.Kong YP, Low HY, Pang SW, Yee AF. Duo-mold imprinting of three-dimensional polymeric structures. J Vac Sci Technol B. 2004;22:3251–6. [Google Scholar]
- 38.Xu Y, Zhao W, Low HY. Sacrificial film-assisted nanoimprint lithography. Microelectron Eng. 2006;83:542–6. [Google Scholar]
- 39.Huang XD, Bao LR, Cheng X, Guo LJ, Pang SW, Yee AF. Reversal imprinting by transferring polymer from mold to substrate. J Vac Sci Technol B. 2002;20:2872–76. [Google Scholar]
- 40.Guo LJ. Recent progress in nanoimprint technology and its applications. J Phys D: Appl Phys. 2004;37:R123–41. [Google Scholar]
- 41.Marchant R, Hiltner A, Hamlin C, Rabinovitch A, Slobodkin R, Anderson JM. In vivo biocompatibility studies. I. The cage implant system and a biodegradable hydrogel. J Biomed Mater Res. 1983;17:301–25. doi: 10.1002/jbm.820170209. [DOI] [PubMed] [Google Scholar]
- 42.Kao WJ, Hubbell JA, Anderson JM. Protein-mediated macrophage adhesion and activation on biomaterials: a model for modulating cell behavior. J Mater Sci Mater Med. 1999;10:601–5. doi: 10.1023/a:1008971222932. [DOI] [PubMed] [Google Scholar]
- 43.Brodbeck WG, Patel J, Voskerician G, Christenson E, Shive MS, Nakayama Y, et al. Biomaterial adherent macrophage apoptosis is increased by hydrophilic and anionic substrates in vivo. Proc Natl Acad Sci U S A. 2002;99:10287–92. doi: 10.1073/pnas.162124199. [DOI] [PMC free article] [PubMed] [Google Scholar]
- 44.Miller KM, Rose-Caprara V, Anderson JM. Generation of IL-1-like activity in response to biomedical polymer implants: a comparison of in vitro and in vivo models. J Biomed Mater Res. 1989;23:1007–26. doi: 10.1002/jbm.820230904. [DOI] [PubMed] [Google Scholar]
- 45.Yim EK, Reano RM, Pang SW, Yee AF, Chen CS, Leong KW. Nanopattern-induced changes in morphology and motility of smooth muscle cells. Biomaterials. 2005;26:5405–13. doi: 10.1016/j.biomaterials.2005.01.058. [DOI] [PMC free article] [PubMed] [Google Scholar]
- 46.Ahsan F, Rivas IP, Khan MA, Torres Suarez AI. Targeting to macrophages: role of physicochemical properties of particulate carriers--liposomes and microspheres--on the phagocytosis by macrophages. J Control Release. 2002;79:29–40. doi: 10.1016/s0168-3659(01)00549-1. [DOI] [PubMed] [Google Scholar]
- 47.Schafer V, von Briesen H, Andreesen R, Steffan AM, Royer C, Troster S, et al. Phagocytosis of nanoparticles by human immunodeficiency virus (HIV)-infected macrophages: a possibility for antiviral drug targeting. Pharm Res. 1992;9:541–6. doi: 10.1023/a:1015852732512. [DOI] [PubMed] [Google Scholar]
- 48.Tabata Y, Ikada Y. Effect of the size and surface charge of polymer microspheres on their phagocytosis by macrophage. Biomaterials. 1988;9:356–62. doi: 10.1016/0142-9612(88)90033-6. [DOI] [PubMed] [Google Scholar]
- 49.Champion JA, Walker A, Mitragotri S. Role of particle size in phagocytosis of polymeric microspheres. Pharm Res. 2008;25:1815–21. doi: 10.1007/s11095-008-9562-y. [DOI] [PMC free article] [PubMed] [Google Scholar]
- 50.Limbach LK, Li Y, Grass RN, Brunner TJ, Hintermann MA, Muller M, et al. Oxide nanoparticle uptake in human lung fibroblasts: effects of particle size, agglomeration, and diffusion at low concentrations. Environ Sci Technol. 2005;39:9370–6. doi: 10.1021/es051043o. [DOI] [PubMed] [Google Scholar]
- 51.Hussain S, Boland S, Baeza-Squiban A, Hamel R, Thomassen LC, Martens JA, et al. Oxidative stress and proinflammatory effects of carbon black and titanium dioxide nanoparticles: role of particle surface area and internalized amount. Toxicology. 2009;260:142–9. doi: 10.1016/j.tox.2009.04.001. [DOI] [PubMed] [Google Scholar]
- 52.Gratton SE, Ropp PA, Pohlhaus PD, Luft JC, Madden VJ, Napier ME, et al. The effect of particle design on cellular internalization pathways. Proc Natl Acad Sci U S A. 2008;105:11613–8. doi: 10.1073/pnas.0801763105. [DOI] [PMC free article] [PubMed] [Google Scholar]
- 53.Brodbeck WG, Shive MS, Colton E, Ziats NP, Anderson JM. Interleukin-4 inhibits tumor necrosis factor-alpha-induced and spontaneous apoptosis of biomaterial-adherent macrophages. J Lab Clin Med. 2002;139:90–100. doi: 10.1067/mlc.2002.121260. [DOI] [PubMed] [Google Scholar]
- 54.Kyriakides TR, Foster MJ, Keeney GE, Tsai A, Giachelli CM, Clark-Lewis I, et al. The CC chemokine ligand, CCL2/MCP1, participates in macrophage fusion and foreign body giant cell formation. Am J Pathol. 2004;165:2157–66. doi: 10.1016/S0002-9440(10)63265-8. [DOI] [PMC free article] [PubMed] [Google Scholar]
- 55.Sanders JE, Bale SD, Neumann T. Tissue response to microfibers of different polymers: polyester, polyethylene, polylactic acid, and polyurethane. J Biomed Mater Res. 2002;62:222–7. doi: 10.1002/jbm.10285. [DOI] [PubMed] [Google Scholar]
- 56.Mosser DM, Edwards JP. Exploring the full spectrum of macrophage activation. Nat Rev Immunol. 2008;8:958–69. doi: 10.1038/nri2448. [DOI] [PMC free article] [PubMed] [Google Scholar]
- 57.Vignery A. Macrophage fusion: molecular mechanisms. Methods Mol Biol. 2008;475:149–61. doi: 10.1007/978-1-59745-250-2_9. [DOI] [PubMed] [Google Scholar]
- 58.Gimona M, Buccione R. Adhesions that mediate invasion. Int J Biochem Cell Biol. 2006;38:1875–92. doi: 10.1016/j.biocel.2006.05.003. [DOI] [PubMed] [Google Scholar]
- 59.Kulangara K, Leong KW. Substrate topography shapes cell function. Soft Matter. 2009;5:4072–6. [Google Scholar]
- 60.Vogel V, Sheetz M. Local force and geometry sensing regulate cell functions. Nat Rev Mol Cell Biol. 2006;7:265–75. doi: 10.1038/nrm1890. [DOI] [PubMed] [Google Scholar]
- 61.Yim EK, Leong KW. Significance of synthetic nanostructures in dictating cellular response. Nanomedicine. 2005;1:10–21. doi: 10.1016/j.nano.2004.11.008. [DOI] [PubMed] [Google Scholar]
- 62.Yim EK, Darling EM, Kulangara K, Guilak F, Leong KW. Nanotopography-induced changes in focal adhesions, cytoskeletal organization, and mechanical properties of human mesenchymal stem cells. 2010 doi: 10.1016/j.biomaterials.2009.10.037. In press. [DOI] [PMC free article] [PubMed] [Google Scholar]
- 63.Oh S, Brammer KS, Li YS, Teng D, Engler AJ, Chien S, et al. Stem cell fate dictated solely by altered nanotube dimension. Proc Natl Acad Sci U S A. 2009;106:2130–5. doi: 10.1073/pnas.0813200106. [DOI] [PMC free article] [PubMed] [Google Scholar]
- 64.Dalby MJ, Gadegaard N, Tare R, Andar A, Riehle MO, Herzyk P, et al. The control of human mesenchymal cell differentiation using nanoscale symmetry and disorder. Nat Mater. 2007;6:997–1003. doi: 10.1038/nmat2013. [DOI] [PubMed] [Google Scholar]
- 65.Hung HS, Wu CC, Chien S, Hsu SH. The behavior of endothelial cells on polyurethane nanocomposites and the associated signaling pathways. Biomaterials. 2009;30:1502–11. doi: 10.1016/j.biomaterials.2008.12.003. [DOI] [PubMed] [Google Scholar]
- 66.Dalby MJ, Riehle MO, Johnstone H, Affrossman S, Curtis AS. In vitro reaction of endothelial cells to polymer demixed nanotopography. Biomaterials. 2002;23:2945–54. doi: 10.1016/s0142-9612(01)00424-0. [DOI] [PubMed] [Google Scholar]
- 67.Dalby MJ, Riehle MO, Sutherland DS, Agheli H, Curtis AS. Use of nanotopography to study mechanotransduction in fibroblasts--methods and perspectives. Eur J Cell Biol. 2004;83:159–69. doi: 10.1078/0171-9335-00369. [DOI] [PubMed] [Google Scholar]
- 68.Kim D-H, Han K, Gupta K, Kwon KW, Suh K-Y, Levchenko A. Mechanosensitivity of fibroblast cell shape and movement to anisotropic substratum topography gradients. Biomaterials. 2009;30:5433–44. doi: 10.1016/j.biomaterials.2009.06.042. [DOI] [PMC free article] [PubMed] [Google Scholar]
- 69.Andersson AS, Backhed F, von Euler A, Richter-Dahlfors A, Sutherland D, Kasemo B. Nanoscale features influence epithelial cell morphology and cytokine production. Biomaterials. 2003;24:3427–36. doi: 10.1016/s0142-9612(03)00208-4. [DOI] [PubMed] [Google Scholar]
- 70.Teixeira AI, McKie GA, Foley JD, Bertics PJ, Nealey PF, Murphy CJ. The effect of environmental factors on the response of human corneal epithelial cells to nanoscale substrate topography. Biomaterials. 2006;27:3945–54. doi: 10.1016/j.biomaterials.2006.01.044. [DOI] [PMC free article] [PubMed] [Google Scholar]
- 71.Karuri NW, Liliensiek S, Teixeira AI, Abrams G, Campbell S, Nealey PF, et al. Biological length scale topography enhances cell-substratum adhesion of human corneal epithelial cells. J Cell Sci. 2004;117:3153–64. doi: 10.1242/jcs.01146. [DOI] [PMC free article] [PubMed] [Google Scholar]
Associated Data
This section collects any data citations, data availability statements, or supplementary materials included in this article.