

Abstract
Excess adiposity and high-carbohydrate diets have been associated with an atherogenic lipoprotein phenotype (ALP) characterized by increased concentrations of small, dense low-density lipoprotein (LDL) particles (pattern B). We tested whether weight loss and normalization of adiposity could reverse ALP in overweight men with pattern B. After consuming a moderate-carbohydrate, high-fat diet for 3 weeks, pattern B and nonpattern B (pattern A) men were randomized to a weight loss (n = 60 and n = 36, respectively) or control weight-stable arm (n = 20 and n = 17, respectively). Men in the weight loss arm consumed ∼1,000 fewer calories per day over 9 weeks to induce an average ∼9 kg weight loss. In the control group, weight stability was maintained for 4 weeks after randomization. Weight loss led to the conversion of pattern B to pattern A in 58% of baseline pattern B men. Among men who achieved BMIs of <25kg/m2 (62% of pattern B men vs. 83% of pattern A men), 81% of pattern B men converted to pattern A. Weight loss was associated with a significantly greater decrease in small, dense LDL subclass 3b in pattern B relative to pattern A men. The lipoprotein profiles of pattern A men who converted from pattern B were comparable to those of men with pattern A at baseline. Conversion of LDL subclass pattern B to pattern A and reversal of ALP can be achieved in a high proportion of overweight men by normalization of adiposity.
Introduction
Overweight and obesity have been associated with an atherogenic lipoprotein phenotype (ALP) that is characterized by elevated triacylglycerols (TGs), reduced high-density lipoprotein (HDL) cholesterol and increased concentrations of small, dense low-density lipoprotein (LDL subclass pattern B) (1,2). Abnormalities in TG-rich lipoprotein metabolism are thought to underlie the lipid and lipoprotein components of ALP. Each of these components has been associated with increased cardiovascular disease risk (3–5). Importantly, although there is a genetic heritability to the trait (6,7), its prevalence can be significantly modulated by environmental factors, particularly, the proportion of macronutrients and the degree of adiposity (8).
Higher prevalence of pattern B has been associated with increased dietary carbohydrate and decreased dietary fat intake in both population studies (9) and dietary intervention trials (8). We recently showed reductions in the prevalence of pattern B with reduced dietary carbohydrate even when dietary fat was held constant (10). Weight loss in overweight individuals was also effective in decreasing the prevalence of pattern B (10). Notably, the effects of weight loss on pattern B prevalence were more apparent at higher levels of carbohydrate intake. Furthermore, in the context of dietary carbohydrate restriction, relatively high concentrations of saturated fat (∼15%) did not raise LDL cholesterol, in contrast to what would have been predicted from meta-analyses (11). This lack of change in LDL cholesterol was shown to be due to specific effects of saturated fat on raising larger and more buoyant LDL particles, which was favorably counterbalanced by reductions in small, more dense LDL with reduced carbohydrate intake.
The objective of the present study was to test the hypothesis that pattern B and its commonly associated lipid abnormalities could be substantially reversed in moderately overweight men through caloric restriction resulting in weight loss and normalization of adiposity. It was expected that the conversion of pattern B to pattern A would be associated with significant reductions in plasma concentrations of small, dense LDL and that the biochemical and metabolic profile ultimately achieved would be similar to those who expressed pattern A at baseline.
Methods and Procedures
Study design
This was a randomized controlled clinical trial of moderately overweight (BMI 25–28 kg/m2) but otherwise healthy men who were enrolled into the study based on LDL pattern (A or B; Supplementary Figure S1 online). The planned recruitment of 40 pattern A men and 60 pattern B men in the weight loss group was based on power calculations and the expectation that ≥2/3 of pattern B men would convert to pattern A. For the control group, 20 pattern A and 20 pattern B men were sought. Men were screened within 3 months of starting on the study diet. After 2 weeks on the study diet, LDL subclass pattern was determined. Based on these subclass patterns, men were randomized according to directions in sealed sequentially numbered envelopes that were the result of random permutations of participants into treatment conditions for randomly determined blocks of 4, 8, 12, 16, 20, or 24 participants.
A total of 464 men were screened for this study, and 252 of them were not enrolled due to ineligibility (n = 68), improbability of being pattern B, i.e., TG/HDL ratio <3.5 (n = 128) (12), and study-related timing considerations (n = 33). Men with intermediate LDL subclass patterns were excluded (n = 23). Of 212 participants found eligible after screening, 28 men declined to enroll and 51 men discontinued after beginning the dietary protocol. There were 39 men who dropped out before randomization and 12 men who dropped out after randomization. Of the 12 men who dropped out after randomization, 8 were pattern B and 4 were pattern A. A total of 37 men who were randomized to the control group (17 pattern A and 20 pattern B) and 96 men randomized to the weight loss group (36 pattern A and 60 pattern B) completed the study.
Baseline characteristics were determined after 3 weeks on the study diet, and the men in the control group continued to consume this diet without weight loss for an additional 4 weeks. Men in the weight loss arm underwent a 9-week acute weight loss phase followed by a 4-week weight stabilization phase. Weight loss was achieved by reduction of ∼1,000 kcal/day of the experimental diet. All study participants were asked to maintain the same level of physical activity throughout the study, i.e., at least 7,500 steps per day as measured by a provided pedometer (Accusplit Eagle 120; Accusplit, Pleasanton, CA). Participants were asked to record their daily number of steps in provided worksheets that were collected at weekly clinic visits.
Blood samples were obtained after overnight fasts at randomization and at the end of the 3 -week run-in period, the 9-week weight loss phase (intervention group only) and the 4-week weight stabilization phase. Plasma was kept at 4 °C for ≤3d before processing. At each visit, body weight was measured, and percentage body fat was estimated by bio-electrical impedance analysis (model TBF-551; Tanita, Skokie, IL). In addition, at baseline and at the end of the study, total body fat and body fat distribution were measured by dual-energy X-ray absorptiometry (Hologic Delphi-A, software version 11.2; Bedford, MA).
Study diet
Study participants were free-living and received menus designed to provide 40% carbohydrate, 40% fat (14% saturated, 19% monounsaturated, and 7% polyunsaturated), and 20% protein over 6-day cycles. Diets contained ∼25 g/day fiber, 150 mg per 1,000 kcal cholesterol (to a maximum of 300 mg per day), and a ratio of simple:complex carbohydrates of 50%:50%. In addition, the diet contained three portions of dairy products (milk, cheese, or yogurt) per day. Nutrient calculations were performed using the Nutrition Data System for Research software (version 4.06; Minneapolis, MN). Frozen, prepared entrees fortified with vitamins and minerals to meet the Recommended Dietary Allowances (Lifespring Home Nutrition; Irvine, CA) were provided for lunch and dinner. The participants prepared their own snacks and breakfasts according to individualized menus, and the participants were weighed weekly by the staff who adjusted energy intakes as necessary. Adherence was promoted through frequent telephone contacts and weekly meetings with the dietitians. Study compliance was assessed using food lists and direct communication with study participants. There were two men whose compliance was deemed unsatisfactory by the head study dietitian. Our intention-to-treat design required that their data be included in all analyses.
Study participants
Participants were recruited through mailed solicitations to households within a reasonable driving distance to our outpatient clinic in Berkeley, CA, through commercially available mailing lists. Financial and logistical constraints on the number of participants that could be managed during the 3-year study required the inclusion of only one gender to satisfy statistical power calculations. Men were chosen because of their higher prevalence of LDL pattern B, which was the major outcome variable on which the power calculations were based.
Study participants had no history of cardiovascular disease or other chronic diseases and none were taking drugs known to affect lipid metabolism, blood thinning agents or hormones. Other eligibility criteria included BMI between 25–28 kg/m2, total and LDL cholesterol below the 95th percentile for age and sex, TG concentration <500 mg/dl (5.65 mmol/l), fasting glucose concentration <126 mg/dl (6.94 mmol/l), systolic blood pressure <150 mm Hg and diastolic blood pressure <90 mm Hg. None of the men smoked, and no alcohol was consumed during the study. All participants gave written informed consent under a protocol approved by the Institutional Review Board of Children's Hospital & Research Center Oakland.
Laboratory measurements
Plasma samples were prepared within 2 h of collection from venous blood collected in tubes containing Na2EDTA (1.4 g/l) and a preservative cocktail of protease and bacterial inhibitors. Blood and plasma were kept at 4 °C throughout processing. Plasma total cholesterol (TC) and TG concentrations were determined by enzymatic procedures on an Express 550 Plus analyzer (Ciba Corning, Oberlin, OH). These measurements were consistently in control as monitored by the Centers for Disease Control and Prevention—National Heart, Lung, and Blood Institute standardization program. HDL cholesterol was measured after dextran sulfate precipitation of plasma. LDL cholesterol was calculated from the formula of Friedewald et al. in plasma samples with triglyceride <400 mg/dl (13). For plasma samples with triglyceride concentrations >400 mg/dl, the d >1.006 was isolated after overnight ultracentrifugation of plasma, cholesterol and HDL cholesterol were measured directly, and LDL cholesterol was determined as the difference between TC and HDL cholesterol. Apolipoproteins A-I (apoA-I) and B (apoB) were measured by immunoturbidimetric assay (Express 550 Plus Analyzer; Bacton Assay Systems, San Marcos, CA).
Glucose concentrations were measured enzymatically (Express 550 Plus Analyzer, cat. no 07157965; Siemens). Insulin concentrations were measured with commercially available enzyme linked immunoassay kits (cat. no. EXHI-14K; Millipore). The homeostasis Model Assessment of Insulin Resistance (HOMA-IR) was calculated using the following equation (14): (Insulin (μU/ml) × Glucose (mg/dl) × 0.055)/22.5.
Nondenaturing polyacrylamide gradient gel electrophoresis with lipid staining of plasma was performed as described previously for determination of peak LDL particle diameter and LDL subclass patterns A and B (15). The concentration of each LDL subclass was determined by multiplying the total LDL cholesterol with the percentage of the area under the curve profile defined for each subclass (16).
Statistical procedures
Comparisons at each study period as well as the changes pre- and post-treatment between pattern A and pattern B men in the control and intervention groups were made by two-way ANOVA and post hoc Tukey's tests. The “post-treatment” results reported refer to results obtained after the weight stabilization phase, as acute weight loss has been shown to represent a dynamic state with results that may be difficult to interpret. All statistical procedures were performed using JMP statistical software (version 6.0.2; SAS Institute, Cary, NC). Graphs were created in PRISM (version 4.0; GraphPad, San Diego, CA). Group averages and changes are reported as means ± s.d., whereas mean group differences are reported ± s.e. Log transformations of plasma TG concentrations were performed to obtain normal distributions. The study was designed to be able to detect a significant difference between treatment conditions if at least 45% of pattern B men converted to pattern A in the weight loss group and no >15% of control pattern B men sporadically converted to pattern A. Reductions in small LDL due to weight loss should be detectable at 80% power, 5% significance, two-tailed test. To test whether lipoprotein features of pattern B men were the same as men who started out as pattern A, the differences between the groups were compared. The 95% confidence intervals were estimated to be 0.06 g/l for apoA-I, 0.09 g/l for apoB, 0.54 nm for LDL peak diameter, 18 mg/dl for TG, 4.6 mg/dl for HDL cholesterol and 2.1 mg/dl for LDL cholesterol.
Results
Baseline parameters
A total of 133 men (53 pattern A and 80 pattern B) completed the study, with 36 pattern A and 60 pattern B in the weight loss arm and 17 pattern A and 20 pattern B men in the control arm. At baseline, the weight loss and control groups showed no significant differences in age, weight, BMI, percentage body fat by bioelectrical impedance analysis or dual-energy X-ray absorptiometry, trunk fat as percentage total fat, trunk mass as percentage total mass, waist circumference or waist-to-hip ratios (Table 1). Steps per day as measured by pedometry were not different in pattern A or pattern B men in the weight loss or control group. At baseline, plasma biochemical measurements were similar for the two treatment arms, except for plasma glucose, which was higher in the control than the weight loss group.
Table 1. Baseline characteristics by LDL subclass pattern and treatment group.
| LDL subclass pattern at randomization | Mean ± s-d. | ANOVA significance | |||||
|---|---|---|---|---|---|---|---|
| Pattern A | Pattern B | Weight loss vs. control | LDL subclass pattern (A vs. B) | Treatment by LDL pattern interaction | |||
| Treatment group | Weight loss (n = 36) |
Control (n = 17) |
Weight loss (n = 60) |
Control (n = 20) |
|||
| Age (years) | 45 ± 9 | 50 ± 9 | 46 ± 9 | 47 ± 11 | NS | NS | NS |
| Weight (kg) | 85 ± 8 | 84 ± 8 | 85 ± 8 | 86 ± 7 | NS | NS | NS |
| BMI | 26.7 ± 1.1 | 27.1 ± 0.9 | 27.1 ± 1.0 | 27.3 ± 1.0 | NS | NS | NS |
| % body fatBIA | 24.7 ± 3.3 | 25.4 ± 2.3 | 25.4 ± 2.8 | 26.3 ± 2.8 | NS | NS | NS |
| % body fatDXA | 24.5 ± 3.7 | 24.8 ± 3.4 | 24.8 ± 3.3 | 25.2 ± 3.3 | NS | NS | NS |
| Trunk fat as % total fat | 51.4 ± 4.5 | 53.1 ± 5.2 | 54.0 ± 4.1 | 53.3 ± 5.0 | NS | NS | NS |
| Trunk mass as % total mass | 48.8 ± 1.7 | 49.2 ± 1.9 | 49.5 ± 1.8 | 49.5 ± 2.2 | NS | NS | NS |
| Waist (cm) | 95.0 ± 6.1 | 97.2 ± 5.9 | 96.8 ± 5.6 | 98.3 ± 5.8 | NS | NS | NS |
| Waist-to-hip ratio | 0.92 ± 0.04 | 0.94 ± 0.06 | 0.94 ± 0.04 | 0.94 ± 0.05 | NS | NS | NS |
| Average steps per day | 9,205 ± 1,880 | 9,061 ± 1,812 | 9,608 ± 1,833 | 8,720 ± 1,850 | NS | NS | NS |
| SBP (mm Hg) | 117 ± 8 | 122 ± 11 | 121 ± 10 | 121 ± 11 | NS | NS | NS |
| DBP (mm Hg) | 073 ± 5b | 75 ± 6a,b | 77 ± 7a | 73 ± 7a,b | NS | NS | 0.02 |
| TC (mg/dl) | 191 ± 32 | 185 ± 26 | 204 ± 34 | 203 ± 26 | NS | 0.01 | NS |
| TG (mg/dl) | 117 ± 57 | 136 ± 55 | 209 ± 98 | 195 ± 136 | NS | <0.0001 | NS |
| LDL-C (mg/dl) | 123 ± 28 | 115 ± 25 | 126 ± 30 | 128 ± 32 | NS | NS | NS |
| HDL-C (mg/dl) | 45 ± 6 | 42 ± 7 | 36 ± 7 | 36 ± 6 | NS | <0.0001 | NS |
| TC:HDL cholesterol | 4.4 ± 0.96 | 4.5 ± 1.1 | 5.9 ± 1.7 | 5.8 ± 1.3 | NS | <0.0001 | NS |
| ApoB (mg/dl) | 82 ± 17 | 85 ± 14 | 99 ± 19 | 96 ± 15 | NS | <0.0001 | NS |
| ApoA-I (mg/dl) | 116 ± 12 | 111 ± 15 | 109 ± 14 | 106 ± 11 | NS | 0.02 | NS |
| Glucose (mg/dl) | 95 ± 6 | 98 ± 8 | 96 ± 8 | 99 ± 7 | 0.03 | NS | NS |
| Insulin (μU/ml) | 7.4 ± 5.1 | 8.6 ± 4.0 | 9.7 ± 4.9 | 10.8 ± 5.2 | NS | 0.02 | NS |
| HOMA-IR | 1.7 ± 1.3 | 2.1 ± 1.0 | 2.3 ± 1.1 | 2.6 ± 1.3 | NS | 0.02 | NS |
Values given are means ± s.d. Statistical comparisons were performed by two-way ANOVA. Statistical analysis of triglyceride data was performed with log-transformed data. Values not sharing the same letter (a,b or c) are significantly different by post hoc Tukey's test. To convert cholesterol and TG concentrations to SI units (mmol/l), multiply by 0.0259 and 0.0113, respectively.
BIA, bioelectrical impedance analysis; DBP, diastolic blood pressure; DXA, dual-energy X-ray absorptiometry; HOMA-IR, homeostasis model assessment of insulin resistance; NS, nonsignificance; SBP, systolic blood pressure; TC, total cholesterol; TG, triacylglycerol.
As expected, pattern B men had higher baseline plasma concentrations of TC, TG, TC:HDL cholesterol ratios and apoB and lower plasma concentrations of HDL cholesterol and apoA-I compared to pattern A men (Table 1). LDL cholesterol and glucose concentrations were comparable, whereas plasma insulin concentrations and HOMA-IR were higher in pattern B vs. pattern A men. Diastolic blood pressure was significantly higher in pattern B relative to pattern A men in the weight loss, but not control, group.
Intervention
The main results reported here are those obtained after weight loss and weight stabilization so as not to introduce the confounding effects of acute energy restriction. The effects of acute weight loss on clinical and biochemical parameters are given in Supplementary Table S1 online. In brief, acute weight loss led to greater decreases in systolic and diastolic blood pressure, triglyceride, TC:HDL ratios and apoB concentrations in pattern B vs. pattern A men.
In pattern A and pattern B men, following energy restriction and weight stabilization, there were mean reductions of body mass of 8.9 and 8.2 kg, respectively, and parallel reductions in other measures of adiposity, including BMI, percentage body fat, trunk fat as % total fat, trunk mass as % total mass, waist circumference and waist-to-hip ratio (Table 2). Physical activity as measured in steps per day did not differ throughout the course of the study. Weight loss significantly decreased systolic and diastolic blood pressures. The aforementioned treatment vs. control group differences did not differ between pattern A and pattern B men.
Table 2. Measurements of changes with intervention in weight loss and control groups.
| LDL subclass pattern at randomization | Pattern A | Pattern B | |||||
|---|---|---|---|---|---|---|---|
| Treatment group | Weight loss (n = 36) |
Control (n = 17) |
Weight loss (n = 60) |
Control (n = 20) |
Weight loss vs. control | A vs. B | Treatment by LDL pattern interaction |
| Δ weight (kg) | −8.9 ± 2.2 | −0.26 ± 0.89 | −8.2 ± 2.7 | −0.17 ± 0.71 | <0.0001 | NS | NS |
| Δ BMI (kg/m2) | −2.8 ± 0.7 | −0.1 ± 0.3 | −2.6 ± 0.8 | −0.1 ± 0.2 | <0.0001 | NS | NS |
| Δ % body fatBIA | −6.2 ± 1.7 | 0.5 ± 1.0 | −5.6 ± 2.7 | −0.4 ± 1.4 | <0.0001 | NS | NS |
| Δ % body fatDXA | −4.3 ± 2.1 | −0.5 ± 1.0 | −3.7 ± 2.2 | −0.4 ± 0.8 | <0.0001 | NS | NS |
| Δ trunk fat as % total fat | −4.0 ± 3.2 | −0.5 ± 2.8 | −3.6 ± 3.3 | −0.5 ± 2.1 | <0.0001 | NS | NS |
| Δ trunk mass as % total mass | −1.3 ± 1.3 | 0.02 ± 1.4 | −1.0 ± 1.5 | −0.2 ± 1.5 | 0.0004 | NS | NS |
| Δ waist (cm) | −7.8 ± 3.4 | −0.82 ± 2.7 | −8.6 ± 4.1 | −0.45 ± 2.8 | <0.0001 | NS | NS |
| Δ Waist-to-hip ratio | −0.03 ± 0.05 | −0.001 ± 0.03 | −0.04 ± 0.03 | −0.01 ± 0.02 | 0.0002 | NS | NS |
| Δ Steps per day | 109 ± 1,830 | −187 ± 1,002 | −393 ± 1,433 | 175 ± 971 | NS | NS | NS |
| Δ SBP (mm Hg) | −5 ± 8 | −3 ± 8 | −7 ± 8 | −1 ± 10 | 0.014 | NS | NS |
| Δ DBP(mm Hg) | −2 ± 8 | 1 ± 8 | −6 ± 7 | 0 ± 9 | 0.0036 | NS | NS |
| Δ TC (mg/dl) | −4 ± 22 | 5 ± 15 | −8 ± 26 | 1 ± 26 | NS | NS | NS |
| Δ TG (mg/dl) | −35 ± 51b,c | 5 ± 45b | −72 ± 84c | 109 ± 129a | <0.0001 | 0.07 | 0.001 |
| Δ LDL-C (mg/dl) | −3 ± 20a,b | 5 ± 14a | 0 ± 25b | −16 ± 30b | NS | NS | 0.01 |
| Δ HDL-C (mg/dl) | 6 ± 6 | −1 ± 3 | 7 ± 6 | −1 ± 4 | <0.0001 | NS | NS |
| Δ TC:HDL cholesterol | −0.6 ± 0.6 | 0.2 ± 0.4 | −1.1 ± 1.4 | 0.2 ± 1.2 | <0.0001 | NS | NS |
| Δ ApoB (mg/dl) | −9 ± 13 | 2 ± 8 | −12 ± 16 | 9 ± 18 | <0.0001 | NS | NS |
| Δ ApoA-I (mg/dl) | 6 ± 12 | 4 ± 7 | 8 ± 13 | 7 ± 10 | NS | NS | NS |
| Δ Glucose (mg/dl) | −4 ± 6 | 2 ± 5 | −3 ± 5 | 2 ± 6 | <0.0001 | NS | NS |
| Δ Insulin (μU/ml) | −2.0. ± 4.3 | −0.21 ± 2.4 | −3.0 ± 4.4 | 0.03 ± 4.1 | 0.0038 | NS | NS |
| Δ HOMA-IR | −0.53 ± 1.1 | −0.02 ± 0.61 | −0.75 ± 1.03 | 0.09 ± 0.98 | 0.0009 | NS | NS |
Values given are means ± s.d. Statistical comparisons were performed by two-way ANOVA. Statistical analysis of triglyceride data was performed with log-transformed data. Values not sharing the same letter (a,b or c) are significantly different by post hoc Tukey's test. To convert cholesterol and TG concentrations to SI units (mmol/l), multiply by 0.0259 and 0.0113, respectively.
BIA, bioelectrical impedance analysis; DBP, diastolic blood pressure; DXA, dual-energy X-ray absorptiometry; HOMA-IR, homeostasis model assessment of insulin resistance; NS, nonsignificance; SBP, systolic blood pressure; TC, total cholesterol; TG, triacylglycerol.
In comparison with the control group, weight loss produced significant decreases in TG and apoB concentrations, increases in HDL cholesterol concentrations, and reductions in total:HDL cholesterol ratios without affecting total or LDL cholesterol or apoA-I concentrations (Table 2). Weight loss also significantly reduced glucose, insulin and HOMA-IR. These changes were not significantly different between pattern A and pattern B men. Although two-way ANOVA revealed significant interactions between LDL subclass pattern and treatment arm for changes in LDL cholesterol and TG concentrations, post hoc analyses indicated that this was not a treatment effect, but rather that there were greater LDL cholesterol decreases and TG increases in pattern B than pattern A men in the control group only. All change data were reanalyzed as percentage change from baseline (data not shown), and the statistical test results presented in Table 2 were confirmed for all variables, except LDL cholesterol, insulin and HOMA-IR. When the data were expressed as percent change from baseline, LDL cholesterol was no longer different according to LDL subclass pattern or treatment group, whereas insulin and HOMA-IR were no longer significantly different by treatment group.
LDL subclass pattern conversions
In the control group, there were 17 pattern A and 20 pattern B men who began the intervention. Four pattern A men, or 24%, converted to pattern B (A→BCO), and two pattern B men, or 10%, converted from pattern B to pattern A (B→ACO) (Table 3). In the weight loss group, one of the 36 pattern A men (3%) converted to pattern B (A→BRx), and 35 of 60, or 58%, of pattern B men converted to pattern A (B→ARx). Pattern B to pattern A conversions were significantly more frequent in the weight loss than in the control group (P< 0.0001 by χ2). Fewer pattern B men achieved the study goals of BMI <25 or percentage body fat <20%, i.e., 37/60 or 62%, compared to pattern A men, who had an 83% success rate. Of those who achieved the target BMI of <25, 81% of the pattern B men became pattern A.
Table 3. LDL Subclass pattern conversions between randomization and study end.
| LDL subclass patterns at randomization and study end | Weight loss (n = 96) |
Control (n = 37) |
|---|---|---|
| A→A | 35 (97%) | 13 (76%) |
| A→B | 1 (3%) | 4 (24%) |
| B→A | 35 (58%) | 2 (10%) |
| B→B | 25 (42%) | 18 (90%) |
χ2 for weight loss vs. control: P < 0.0001 overall significance; P = 0.0002 when restricted to LDL pattern B men at entry, P = 0.02 when restricted to LDL pattern A men at entry.
As part of a post hoc analysis, we evaluated predictors of conversion among pattern B men in the weight loss group using logistic regression analysis. When changes in weight, percentage body fat, TG, HDL cholesterol and insulin were considered simultaneously in a model with conversion pattern as the dependent variable, change in HDL cholesterol was the only variable that retained statistical significance (data not shown; P = 0.01). When change in LDL diameter was considered as the dependent variable in a multiple regression model, significant associations were observed for changes in TG and HDL cholesterol (data not shown; P < 0.01 and P = 0.03, respectively).
Supplementary Table S2 online presents the baseline and changes in the plasma concentrations for the individual LDL subclasses. These analyses were not affected by a regression to the mean effect because they used a separate clinic measurement for calculating change than for classifying pattern A and B. By definition, pattern B men had smaller LDL diameter compared to pattern A men at baseline due to their lower concentrations of LDL-I and LDL-Iia, and higher concentrations of LDL-IIIa, LDL-IIIb, and LDL-Iva. Weight loss increased plasma LDL-I and LDL-Iia and decreased plasma LDL-IIIa, LDL-IIIb, and LDL-Iva concentrations. Grouping of the major individual subclasses into broader categories of “large” and “small” LDL (where large LDL comprises LDL-I, LDL-Iia, and IIB, and small LDL comprises LDL-IIIa, LDL-IIIb, LDL-Iva, and LDL-Ivb) yielded similar conclusions (data not shown). The increase in LDL-Iia and decrease in LDL-IIIb with weight loss appeared to be specific to pattern B men. In addition, weight loss vs. control group differences in LDL-Iib were significant in pattern B men only. Except for LDL-Iva, the significant changes of Table 4 were reaffirmed when the data were reanalyzed as percentage change from baseline (the interaction term for LDL-Iva became significant and pattern B men in the control group showed an increase relative to decreases observed in pattern A and B men in the weight loss group; analyses not displayed). Statistical adjustment for TG eliminated the significant subclass pattern-by-treatment interactions for all LDL subclasses except LDL-IIIa (data not shown), indicating that effects on TG may underlie the changes in LDL subfractions with weight loss.
Comparison of pattern A men at the end of the study by treatment and initial LDL subclass pattern
The end-of-study lipoprotein concentrations were not significantly different between control pattern A men who entered the study as pattern A and treatment pattern B men who became pattern A after weight loss, despite the fact that those assigned to treatment had lower end-of-study weight, BMI, % body fat, and waist circumferences than pattern A controls (Supplementary Table S3 online). The pattern B men who became pattern A after weight loss had lower fasting plasma glucose concentrations than pattern A controls.
Discussion
Dyslipidemia characterized by elevated TG, reduced HDL cholesterol and small dense LDL (pattern B) is closely linked to obesity (17–19), and weight loss is associated with improvements in these lipid abnormalities (20,21). Previous studies have demonstrated the ability to substantially reverse pattern B with weight loss in overweight and obese men (BMI from 26 to 35) (10). The goal of the current study was to determine the extent to which reversal of pattern B could be achieved through the normalization of BMI <25 and percentage body fat <20%. In the majority of pattern B men, weight loss of ∼8kg was associated with conversion to pattern A, and the reversal of all components of the ALP. Weight loss improved insulin sensitivity to a similar extent irrespective of LDL subclass pattern conversion status, indicating that conversion did not appear to be mediated by improved insulin sensitivity. Notably, men who were pattern B at baseline were less likely to achieve study weight loss goals compared to men who were pattern A at baseline. This disparity was not due to differences in physical activity as measured by steps per day. Because the current protocol did not enable us to determine whether the decreased propensity towards weight loss in pattern B vs. pattern A men was due to lack of compliance or underlying metabolic differences, further investigation will be required to test the latter possibility.
Nonetheless, this study supports the concept that despite evidence for genetic influences on atherogenic dyslipidemia and LDL subclass pattern B (18), these traits can be reversed in a high proportion of individuals by weight loss and normalization of adiposity in the context of moderate levels of carbohydrate in the diet. Furthermore, pattern B men had a differential response to weight loss with regard to LDL subclass distribution compared to pattern A men. With weight loss, the reversal of ALP in pattern B men was associated with a greater decrease in small, dense LDL-IIIb and a concomitant increase in larger, more buoyant LDL-Iia compared to pattern A men.
Changes in LDL subclass distributions with dietary intervention are strongly correlated with changes in both triglyceride-rich lipoproteins and HDL. In the present study, regression analyses indicated that both reductions in triglyceride and increases in HDL-C associated with increases in LDL peak diameter with weight loss independently of weight, percentage body fat and plasma insulin. Moreover, increases in HDL-C were associated with conversion from pattern B to A and changes in triglyceride were associated with changes in levels of LDL subclasses.
This study further demonstrated that weight loss in pattern B men resulted in lipoprotein and biochemical measurements that were comparable to those of pattern A men at baseline who did not undergo weight loss. Notably, the BMI required to elicit LDL subclass pattern A was significantly lower in pattern B men. Similarly, lower percentages of body fat were required to achieve pattern A in men who were pattern B at baseline. These data suggest a fundamental metabolic disparity, such that pattern B men may be more resistant to normalizing their plasma concentrations of lipids and lipoproteins at a given body weight and level of adiposity. However, BMI is only an indirect measure of what are thought to be important fat depots that can influence ALP (22–24), and total body fat measurements do not provide enough detail to discern these metabolically active tissues. Despite the fact that the pattern A men in the control group were heavier and had increased total body fat relative to pattern B men who underwent weight loss, they may be metabolically more lean, i.e., they may have lower visceral or hepatic fat mass. Differences in such metabolically active tissues may explain their relative protection from ALP (23).
During the weight-stable period following weight loss, the men were still in caloric deficit relative to their average consumption at the beginning of the study (estimated reductions of 895 ± 457 and 1,029 ± 427 kcal/day for pattern A and pattern B men, respectively). Interestingly, achieved weight loss may lead to lipoprotein profiles that are improved relative to persons at comparable BMIs who have not lost weight. There was an 81% conversion of pattern B men to pattern A in those men who reached the BMI target of <25 in this study. Assuming a pre-weight loss population prevalence of pattern B of 29% in men with BMIs between 25 and 28 (based on cross-sectional data in 229 men; R.M. Krauss, unpublished data), we would predict that the prevalence of pattern B after weight loss would be ∼6%, an estimate that is much lower than the prevalence of pattern B in nonweight reduced men (∼18%; R.M. Krauss, unpublished data). Improved lipoprotein profiles in the weight-reduced compared to the nonweight reduced state are not without precedent. Williams has previously shown higher HDL cholesterol concentrations in male runners who had lost weight than in runners with similar BMIs who had not lost weight (25,26). These findings speak to the potential metabolic benefits of weight reduction over baseline weight status.
Some pattern B men at baseline did not convert to pattern A, and as this may have been due to decreased compliance (which was not directly measured in this study), the inability to convert may be related to underlying metabolic or physiological characteristics. Logistic regression models suggested that changes in HDL cholesterol significantly predicted conversion patterns. Furthermore, pattern B men who remained pattern B after weight loss had greater body fat and trunk fat, higher TG and smaller LDL particle diameters at baseline, with expected shifts in LDL subclass distribution (data not shown). When only the subset of men who reached the BMI<25 goal was considered, the one distinguishing characteristic that differentiated the B→BRx from the B→ARx group was baseline particle distribution with a significantly larger LDL peak particle diameter in the converters (data not shown). These data suggest that peak LDL particle size may be predictive of adaptability to environmental modulators of body weight.
Our previous studies have shown that dietary carbohydrate plays a more important role than dietary fat in influencing the expression of pattern B (10). Other investigators have also shown an improvement in markers of cardiovascular disease risk with low to moderate intakes vs. high-carbohydrate intakes (27–29). In the present study, dietary carbohydrate was maintained at 40% of energy (with relatively high concentrations of total and saturated fat) with parallel measurements in the control and weight loss groups to control for variability in response to the experimental diet. Pattern B men in the control group had unexpected, but significant increases in TG over the course of the study. However, all men exhibited a significant decrease in TG between the screening and baseline visits (data not shown), and by the end of the 4-week weight-stable period in the control arm, TG concentrations had increased in all study participants, with a greater increase observed in pattern B men whose plasma TG reached pre-study concentrations. The changes in plasma TG in the control arm were, therefore, probably related to deviations from the participants' usual (pre-study) diets. There were several caveats to this study. Because of its relatively short-term nature, the results may not be applicable to longer-term dietary interventions. A related issue was the shorter intervention time in the control relative to the weight loss group (4 vs. 9 weeks), which was a design feature based on the potential difficulty of maintaining stable weight over long periods of time. Furthermore, because this study was conducted in a population of predominantly middle-aged white men, extrapolation of the results to women and other ethnic groups may be limited. Women have a significantly lower prevalence of pattern B, even at higher BMIs (30) so weight loss may not be as important a contributor to ALP in women. Furthermore, other ethnic groups, particularly Asians, have been shown to exhibit dyslipidemia at BMI values lower than would be expected among Whites (31,32).
Nonetheless, the findings of this study indicate that the achievement of body mass indices in the currently recommended “normal” range is sufficient to reverse ALP in a substantial proportion of the population and further reduction may be advised to ensure maximal benefit to this group of individuals.
Supplementary Material
Figure 1.
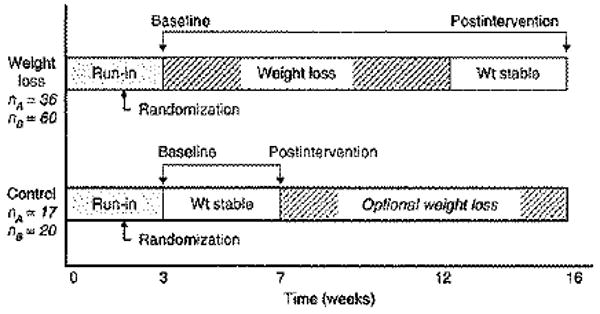
Over a 3-year period, 133 overweight men (BMI:25–28kg/m2) were enrolled in a dietary intervention program designed to reduce weight by ∼9 kg (weight loss group) or maintain weight stability (control group). Men were recruited based on LDL subclass pattern (A or B), placed on a run-in study diet for 3 weeks and subsequently randomized into the different arms of the study based on LDL subclass pattern at the randomization visit. Men in the weight loss arm followed a 9-week weight loss program followed by a 4-week weight-stable period. The control group continued consuming the study diet without losing weight.
Acknowledgments
We thank Patricia J. Blanche, Kathleen Wojnoonski and the staff of the CHORI Lipoprotein Analysis Laboratory for laboratory measurements; Linda Abe for data management; the staff of the Cholesterol Research Center for participant recruitment and clinical study assistance; and Ellen Fung for assistance with dual-energy X-ray absorptiometry measurements. This research was supported by the National Dairy Council and was made possible by Grant Number UL1 RR024131-01 from the National Center for Research Resources (NCRR), a component of the National Institutes of Health (NIH), and NIH Roadmap for Medical Research. Its contents are solely the responsibility of the authors and do not necessarily represent the official view of NCRR or NIH. Information on NCRR is available at http://www.ncrr.nih.gov/. <http://www.ncrr.nih.gov/.> Information on Re-engineering the Clinical Research Enterprise can be obtained from http://nihroadmap.nih.gov/clinicalresearch/overview-translational.asp <http://nihroadmap.nih.gov/clinicalresearch/overview-translational.asp>.
Footnotes
Supplementary Material: Supplementary material is linked to the online version of the paper at http://www.nature.com/oby
Disclosure: R.M.K has served on Advisory Boards for Isis Pharmaceuticals, Merck & Co., Inc., and Merck/Schering-Plough. He is also a Consultant for ActivX Biosciences, Inc., Celera Diagnostics and Metabolex, Inc. He has received grant support from Merck & Co., Inc., Merck/Schering-Plough, Metaboiex, Inc. and Sanofi-Synthelabo Inc.
References
- 1.Austin MA, King MC, Vranizan KM, Krauss RM. Atherogenic lipoprotein phenotype. A proposed genetic marker for coronary heart disease risk Circulation. 1990;82:495–506. doi: 10.1161/01.cir.82.2.495. [DOI] [PubMed] [Google Scholar]
- 2.Reaven GM, Chen YD, Jeppesen J, Maheux P, Krauss RM. Insulin resistance and hyperinsulinemia in individuals with small, dense low density lipoprotein particles. J Clin Invest. 1993;92:141–146. doi: 10.1172/JCI116541. [DOI] [PMC free article] [PubMed] [Google Scholar]
- 3.Castelli WP, Garrison RJ, Wilson PW, et al. Incidence of coronary heart disease and lipoprotein cholesterol levels. The Framingham Study. JAMA. 1986;256:2835–2838. [PubMed] [Google Scholar]
- 4.Sharrett AR, Ballantyne CM, Coady SA, et al. Coronary heart disease prediction from lipoprotein cholesterol levels, triglycerides, lipoprotein(a), apolipoproteins A-I and B, and HDL density subfractions: The Atherosclerosis Risk in Communities (ARIC) Study. Circulation. 2001;104:1108–1113. doi: 10.1161/hc3501.095214. [DOI] [PubMed] [Google Scholar]
- 5.Hokanson JE, Austin MA. Plasma triglyceride level is a risk factor for cardiovascular disease independent of high-density lipoprotein cholesterol level: a meta-analysis of population-based prospective studies. J Cardiovasc Risk. 1996;3:213–219. [PubMed] [Google Scholar]
- 6.Austin MA, Newman B, Selby JV, et al. Genetics of LDL subclass phenotypes in women twins. Concordance, heritability, and commingling analysis. Arterioscler Thromb. 1993;13:687–695. doi: 10.1161/01.atv.13.5.687. [DOI] [PubMed] [Google Scholar]
- 7.Campos H, Blijlevens E, McNamara JR, et al. LDL particle size distribution. Results from the Framingham Offspring Study. Arterioscler Thromb. 1992;12:1410–1419. doi: 10.1161/01.atv.12.12.1410. [DOI] [PubMed] [Google Scholar]
- 8.Krauss RM. Dietary and genetic effects on low-density lipoprotein heterogeneity. Annu Rev Nutr. 2001;21:283–295. doi: 10.1146/annurev.nutr.21.1.283. [DOI] [PubMed] [Google Scholar]
- 9.Campos H, Willett WC, Peterson RM, et al. Nutrient intake comparisons between Framingham and rural and Urban Puriscal, Costa Rica. Associations with lipoproteins, apolipoproteins, and low density lipoprotein particle size. Arterioscler Thromb. 1991;11:1089–1099. doi: 10.1161/01.atv.11.4.1089. [DOI] [PubMed] [Google Scholar]
- 10.Krauss RM, Blanche PJ, Rawlings RS, Fernstrom HS, Williams PT. Separate effects of reduced carbohydrate intake and weight loss on atherogenic dyslipidemia. Am J Clin Nutr. 2006;83:1025–31. doi: 10.1093/ajcn/83.5.1025. quiz 1205. [DOI] [PubMed] [Google Scholar]
- 11.Mensink RP, Katan MB. Effect of dietary fatty acids on serum lipids and lipoproteins. A meta-analysis of 27 trials. Arterioscler Thromb. 1992;12:911–919. doi: 10.1161/01.atv.12.8.911. [DOI] [PubMed] [Google Scholar]
- 12.McLaughlin T, Reaven G, Abbasi F, et al. Is there a simple way to identify insulin-resistant individuals at increased risk of cardiovascular disease? Am J Cardiol. 2005;96:399–404. doi: 10.1016/j.amjcard.2005.03.085. [DOI] [PubMed] [Google Scholar]
- 13.Friedewald WT, Levy RI, Fredrickson DS. Estimation of the concentration of low-density lipoprotein cholesterol in plasma, without use of the preparative ultracentrifuge. Clin Chem. 1972;18:499–502. [PubMed] [Google Scholar]
- 14.Haffner SM, Miettinen H, Stern MP. The homeostasis model in the San Antonio Heart Study. Diabetes Care. 1997;20:1087–1092. doi: 10.2337/diacare.20.7.1087. [DOI] [PubMed] [Google Scholar]
- 15.Dreon DM, Fernstrom HA, Williams PT, Krauss RM. Reduced LDL particle size in children consuming a very-low-fat diet is related to parental LDL-subclass patterns. Am J Clin Nutr. 2000;71:1611–1616. doi: 10.1093/ajcn/71.6.1611. [DOI] [PubMed] [Google Scholar]
- 16.Rainwater DL, Almasy L, Blangero J, et al. A genome search identifies major quantitative trait loci on human chromosomes 3 and 4 that influence cholesterol concentrations in small LDL particles. Arterioscler Thromb Vasc Biol. 1999;19:777–783. doi: 10.1161/01.atv.19.3.777. [DOI] [PubMed] [Google Scholar]
- 17.Ginsberg HN, Zhang YL, Hemandez-Ono A. Metabolic syndrome: focus on dyslipidemia. Obesity (Silver Spring) 2006;14 1:41S–49S. doi: 10.1038/oby.2006.281. [DOI] [PubMed] [Google Scholar]
- 18.Krauss RM. Dietary and genetic probes of atherogenic dyslipidemia. Arterioscler Thromb Vasc Biol. 2005;25:2265–2272. doi: 10.1161/01.ATV.0000186365.73973.f0. [DOI] [PubMed] [Google Scholar]
- 19.Siri PW, Krauss RM. Influence of dietary carbohydrate and fat on LDL and HDL particle distributions. Curr Atheroscler Rep. 2005;7:455–459. doi: 10.1007/s11883-005-0062-9. [DOI] [PubMed] [Google Scholar]
- 20.Nordmann AJ, Nordmann A, Briel M, et al. Effects of low-carbohydrate vs low-fat diets on weight loss and cardiovascular risk factors: a meta-analysis of randomized controlled trials. Arch Intern Med. 2008;166:285–293. doi: 10.1001/archinte.166.3.285. [DOI] [PubMed] [Google Scholar]
- 21.Stone NJ. Successful control of dyslipidemia in patients with metabolic syndrome: focus on lifestyle changes. Clin Cornerstone. 2006;8 1:S15–S20. doi: 10.1016/s1098-3597(06)80004-9. [DOI] [PubMed] [Google Scholar]
- 22.Purnell JQ, Kahn SE, Albers JJ, et al. Effect of weight loss with reduction of intra-abdominal fat on lipid metabolism in older men. J Clin Endocrinol Metab. 2000;85:977–982. doi: 10.1210/jcem.85.3.6402. [DOI] [PubMed] [Google Scholar]
- 23.Després JP, Lemieux I, Bergeron J, et al. Abdominal obesity and the metabolic syndrome: contribution to global cardiometaboiic risk. Arterioscler Thromb Vasc Biol. 2008;28:1039–1049. doi: 10.1161/ATVBAHA.107.159228. [DOI] [PubMed] [Google Scholar]
- 24.Guilherme A, Virbasius JV, Puri V, Czech MP. Adipocyte dysfunctions linking obesity to insulin resistance and type 2 diabetes. Nat Rev Mol Cell Biol. 2008;9:367–377. doi: 10.1038/nrm2391. [DOI] [PMC free article] [PubMed] [Google Scholar]
- 25.Williams PT. Weight set-point theory and the high-density lipoprotein concentrations of long-distance runners. Metab Clin Exp. 1990;39:460–467. doi: 10.1016/0026-0495(90)90003-u. [DOI] [PMC free article] [PubMed] [Google Scholar]
- 26.Williams PT. Weight set-point theory predicts HDL-cholesterol levels in previously obese long-distance runners. Int J Obes. 1990;14:421–427. [PubMed] [Google Scholar]
- 27.McLaughlin T, Carter S, Lamendola C, et al. Effects of moderate variations in macronutrient composition on weight loss and reduction in cardiovascular disease risk in obese, insulin-resistant adults. Am J Clin Nutr. 2006;84:813–821. doi: 10.1093/ajcn/84.4.813. [DOI] [PubMed] [Google Scholar]
- 28.Samaha FF, Foster GD, Makris AP. Low-carbohydrate diets, obesity, and metabolic risk factors for cardiovascular disease. Curr Atheroscler Rep. 2007;9:441–447. doi: 10.1007/s11883-007-0059-7. [DOI] [PubMed] [Google Scholar]
- 29.Westman EC, Feinman RD, Mavropoulos JC, et al. Low-carbohydrate nutrition and metabolism. Am J Clin Nutr. 2007;86:276–284. doi: 10.1093/ajcn/86.2.276. [DOI] [PubMed] [Google Scholar]
- 30.Dreon DM, Fernstrom HA, Williams PT, Krauss RM. LDL subclass patterns and lipoprotein response to a low-fat, high-carbohydrate diet in women. Arterioscler Thromb Vasc Biol. 1997;17:707–714. doi: 10.1161/01.atv.17.4.707. [DOI] [PubMed] [Google Scholar]
- 31.Enas EA, Mohan V, Deepa M, et al. The metabolic syndrome and dyslipidemia among Asian Indians: a population with high rates of diabetes and premature coronary artery disease. J Cardiometab Syndr. 2007;2:267–275. doi: 10.1111/j.1559-4564.2007.07392.x. [DOI] [PubMed] [Google Scholar]
- 32.Hoang KC, Le TV, Wong ND. The metabolic syndrome in East Asians. J Cardiometab Syndr. 2007;2:276–282. doi: 10.1111/j.1559-4564.2007.07491.x. [DOI] [PubMed] [Google Scholar]
Associated Data
This section collects any data citations, data availability statements, or supplementary materials included in this article.