

Abstract
Anatomical and electrophysiological studies have revealed a complex organization in the macaque prelunate gyrus. We investigated the morphology and architecture of the prelunate gyrus in Old World monkeys. In Macaca nemestrina, we observed a sulcus crossing the prelunate gyrus within 2 mm of the vertical meridian representation. In other macaque species and other cercopithecines, we observed substantial variations in sulcal morphology across the prelunate gyrus. We did not find a sulcus in all species, and the location and depth of that indentation on the gyrus varied among species. A deep sulcus was observed in all species that emerged earlier in evolution than macaques, like guenons, baboons, and colobines. We analyzed the regional and parcellation features of the prelunate gyrus in three macaque species, M. maura, M. mulatta and M. radiata, and in Erythrocebus patas, with emphasis on the relation of structure to the distribution of prelunate visual areas. Nonphosphorylated neurofilament protein immunoreactivity permitted the delineation of a novel area in the prelunate gyrus of Old World monkeys, located around the prelunate sulcus. Species-specific patterns were also observed in the prelunate gyrus of the patas monkey, compared to macaques. These observations, as well as a cladistic analysis of the data, suggest an expanded and diversified organization of the prelunate gyrus in some cercopithecoids that may reflect adaptation to specific ecological environments. It was however progressively lost in most macaques, being retained only in species that diverged early in the evolution of the genus Macaca, such as M. nemestrina and M. maura.
Keywords: area V4, cercopithecines, neurofilament proteins, prestriate cortex, primate neocortex, visual cortex
The macaque monkey is widely used in neuroscience research, for studies of anatomy, physiology and behavior. Several species of macaques have been used, including the rhesus monkey, Macaca mulatta (Hubel and Wiesel, 1968), the long-tailed macaque, M. fascicularis (Olavarria et al.,1992), the pigtail macaque, M. nemestrina (Blasco et al., 1999), and the Japanese macaque, M. fuscata (Takeuchi and Sano, 1983). Some studies also reported results from more than one species (Lund and Wu, 1997). The results of these studies are generally considered valid across all macaques, but differences in the functional organization of different macaque brains have not been subjected to systematic study.
The question of the number and organization of prestriate visual areas in the macaque neocortex has been the center of much interest. Despite numerous anatomical and electrophysiological studies, some controversy still remains (Gattass et al., 1988; Van Essen et al., 1990; Kaas, 1997; De Weerd et al., 2003; Sereno and Tootell, 2005; Stepniewska et al., 2005). Studies of the visuotopic organization of one region of the prestriate cortex, the prelunate gyrus, which includes visual area V4, notoriously differ in their conclusions about the number and borders of visual areas in this gyrus (Baizer and Maguire, 1983; Maguire and Baizer, 1984; Gattass et al., 1988; Youakim et al., 2001; Fize et al., 2003; Stepniewska et al., 2005). Two areas, V4 and DP, are recognized in most studies, but there is disagreement about the dorsal border of V4, which is placed at about the level of the end of the superior temporal sulcus in one study (Gattass et al., 1988), but much more ventrally in others (Youakim et al., 2001; Stepniewska et al., 2005). There is also the suggestion of a third representation of the lower quadrant interposed between V4 and DP (Maguire and Baizer, 1984; Youakim et al., 2001).
In the course of studying the visuotopic organization of the prelunate gyrus in the pigtail macaque, M. nemestrina (Youakim et al., 2001), we noticed a small sulcus that crossed the prelunate gyrus about 2–4 mm medial to the intersection of the lateral and superior temporal sulci. Here, we refer to that sulcus as the prelunate sulcus. That sulcus was always found within 2 mm of a visuotopic landmark, the representation of the vertical meridian. The visuotopic organization we found in this monkey was similar to that we had found earlier in the rhesus monkey, M. mulatta (Maguire and Baizer, 1984; see also Fize et al., 2003), but we had not noted a prelunate sulcus in the rhesus. In agreement with our observations, neither an early study of the rhesus monkey brain (Von Bonin and Bailey, 1947), nor more recent atlases (Paxinos et al., 2000; www.brainmaps.org; online atlas of M. mulatta, prepared by Maria K. Szwarcbart, Laboratory of Neuropsychology, NIMH, http://neuron.nimh.nih.gov) describe such a sulcus in M. mulatta.
In the present study we examined whether the prelunate sulcus is a unique feature of the brain of the pigtail macaque or whether it is present in other macaque species and related Cercopithecines from genera such as Papio, Mandrillus, Cercopithecus Chlorocebus, and Erythrocebus, as well as in two Colobines. Our approach was to analyze as many specimens as possible, using both archival and new materials. We studied intact brains, photographs of brains, and stained sections from different collections. Because earlier studies suggested that the pattern of immunoreactivity seen with SMI-32, an antibody against nonphosphorylated neurofilament proteins is useful in delimiting cortical visual areas (Hof and Morrison, 1995), whenever possible we also analyzed the patterns of immunostaining with SMI-32 along the prelunate gyrus.
MATERIALS AND METHODS
Specimen Collections
Collection 1, SUNY Buffalo, NY
Brain sections were available from four species of macaque monkeys, M. mulatta (rhesus monkey, n = 18), M. fascicularis (long-tailed macaque, n = 15), M. nemestrina (pigtail macaque, n = 3), and M. arctoides (stump-tailed macaque, n = 1) that had been used in a variety of unrelated anatomical, physiological or behavioral experiments (e.g., Maguire and Baizer, 1984; Youakim et al., 2001). At the end of these experiments, the animals had been perfused with saline and either 4% paraformaldehyde or 10% formalin. The brains were removed, and, in some cases photographed. They were then cryoprotected in sucrose in phosphate buffered saline (PBS) or in sucrose in formalin, and 30–50 µm-thick frozen sections were cut on an American Optical sliding microtome. Sections were stored in formalin, or a cryoprotection solution made of 30% ethylene glycol and 40% glycerol in 0.1 M phosphate buffer. Different planes of section were used in different cases, including coronal, parasagittal and horizontal planes. Sets of sections were then stained with cell and/or fiber stains including the Nissl stains cresyl violet and thionin, and the Gallyas myelin stain. From this set of brains, no sections were usable for immunohistochemistry, and SMI-32 staining patterns could not be determined.
Collection 2, Mount Sinai School of Medicine, NY
Brains of several other species were available from this collection including two macaque species, M. radiata (bonnet macaque, n = 4), and M. maura (Moor’s macaque, n = 6), as well as Erythrocebus patas (patas monkey, n = 4), Chlorocebus aethiops (grivet, n = 1), Cercopithecus kandti (golden monkey, n = 1), Mandrillus sphinx (mandrill, n = 1), Papio anubis (olive baboon, n = 2), Colobus angolensis (Angolan colobus, n = 1), and Trachypithecus françoisi (François’ langur, n = 1). The macaques, patas monkeys, and baboon were tranquilized by an overdose of pentobarbital (50 mg/kg, i.v.), intubated and perfused through the heart with saline followed by 1% paraformaldehyde for 1 minute, and then by a mixture of 4% paraformaldehyde and 0.125% glutaraldehyde in PBS. Six additional animals, including one M. fascicularis and five M. mulatta were sacrificed with an overdose of sodium pentobarbital (60 mg/kg, i.v.) and were immediately perfused transcardially with 0.9% saline, followed by cold 4% paraformaldehyde in 0.15 M PBS (pH 7.4). Brains were removed from the skull, postfixed, rinsed, and stored at 4°C in PBS. The brains of the mandrill, the golden monkey, grivet, and the two colobines were obtained shortly after natural death and were fixed by immersion in 10% formalin. The brains were removed, photographed, and divided into blocks that included the prelunate gyrus and stored in PBS containing 0.01% sodium azide. We had digital photographs of all of these brains or brain blocks. In addition to examining the blocks, select blocks including the prelunate gyrus were sectioned with a Vibratome in a plane parallel to the long axis of the prelunate gyrus, and serial free-floating sections were processed for immunocytochemistry with a monoclonal antibody SMI-32 (Covance Research Products, Berkeley, CA; Sternberger and Sternberger, 1983) against the medium and heavy subunits of nonphosphorylated neurofilament proteins. Adjacent sections were stained for cresyl violet (1%, Fluka Chemical, Sigma-Aldrich, St. Louis, MO) according to standard protocols. All protocols involving live animals comply with the NIH guidelines on animal welfare and were reviewed and approved by the relevant Institutional Animal Care and Use Committees at SUNY Buffalo, Mount Sinai School of Medicine, and K.U. Leuven.
Neurofilament Protein Immunohistochemistry
For immunocytochemistry, serial 50 µm-thick Vibratome sections were pretreated with 30% H2O2 for 10 minutes, rinsed, and preincubated in normal goat serum (NGS, 1:5) for 45 minutes. After incubation overnight with monoclonal antibody SMI-32 (1:2,000, Covance), detection was performed using biotinylated goat anti-mouse IgGs (1:200, 30 minutes, Dako, Glostrup, Denmark) and an avidin-biotin-horseradish peroxidase solution (Vectastain Elite ABC, Vector Laboratories, Burlingame, CA). The sections were immunostained using the glucose oxidase-DAB-nickel method resulting in a grey-black staining (Shu et al., 1988; Van der Gucht et al., 2001). All incubations and rinses (3×10 minutes) were performed at room temperature under gentle agitation in Tris buffered saline (TBS, 0.01 M Tris, 0.9% NaCl, 0.3% Triton-X 100, pH 7.6). In addition, free-floating sections of all brains were pretreated by antigen retrieval prior to the actual immunocytochemical procedure. All sections were incubated in citric acid buffer (0.1 M, pH 8.0) for 10 minutes at 90°C. Next, they were allowed to cool down to room temperature in citric acid buffer for 20 minutes, followed by rinsing in TBS for 2 hours. Staining specificity was checked by serial dilutions of the primary antibody, resulting in a gradual decrease of the immunostaining. Substitution of the primary antibody by NGS resulted in an absence of immunostaining. Omission of one of the various incubation steps abolished the immunocytochemical staining completely, indicating the specificity of the staining.
Cladistic Analysis
The evolution of prelunate gyrus traits were reconstructed using a maximum parsimony approach as implemented in Mesquite software version 1.06 (Maddison and Maddison, 2005) based on the phylogeny of cercopithecoids given by Tosi et al. (2003). Parsimony analyses employed character state transformations unordered. The character states were coded as (a) if the prelunate sulcus was absent, (b) if it was equivocal and showed as a dimple or a shallow sulcus, and (c) if it was present.
Photography and Figures
Digital images of sections from the SUNY Buffalo collection were obtained with a SPOT Insight Color Mosaic camera (Diagnostic Instruments, Sterling Heights, MI) mounted on a Wild Makroskope, M420. Digital images of the intact brains were made by scanning existing photographs with a Hewlett-Packard 5470c scanner. Digital images of tissue blocks from the Mount Sinai collection were taken with a Sony digital video camera recorder DCR-PC120E (Sony International, Stuttgart, Germany). Low and high-power photomicrographs of cresyl violet and SMI-32 stained sections were taken with a Kodak 35 mm camera mounted on a Leitz DM RBE microscope (Leica, Leitz Instruments, Heidelberg, Germany). Digital files of the films were assembled and edited with Adobe Photoshop version 10.
RESULTS
Identification of the Prelunate Gyrus
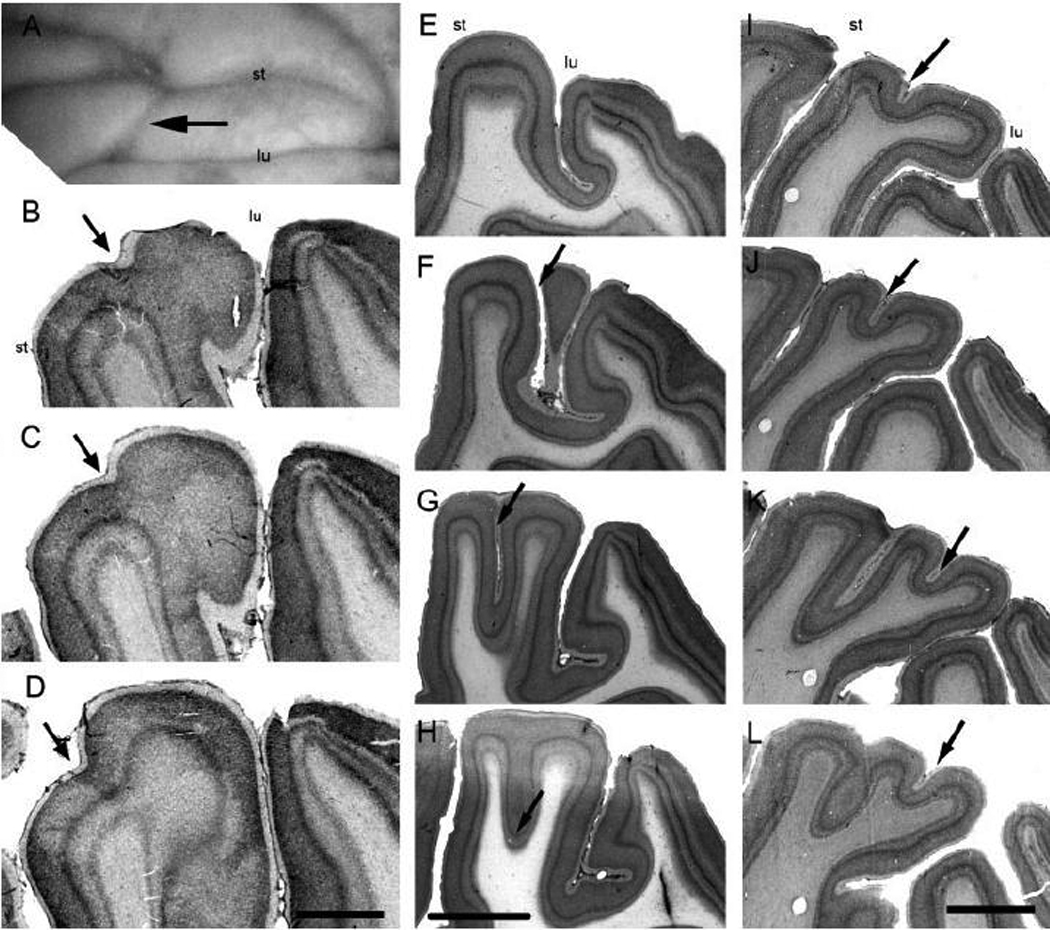
The prelunate gyrus is bounded posteriorly by the lunate sulcus and anteriorly by the superior temporal sulcus. Dorsally it continues past the end of the superior temporal sulcus until the junction of the lunate and intraparietal sulci. Ventrally it continues to the end of the lunate sulcus, where the ascending arm of the inferior occipital sulcus may intersect it. There is variability from animal to animal, and even between hemispheres of the same animal, in the course of the bounding sulci and hence, the shape of the prelunate gyrus. On coronal sections the prelunate gyrus is present at levels from about −3.0 to −14 (based on coordinates from the atlas of M. mulatta available from http://neuron.nimh.nih.gov). Figure 1 illustrates the appearance of the prelunate gyrus (arrow) on five parasagittal sections of M. mulatta at different medio-lateral levels (sections from www.brainmaps.org, case RH12, sections 42, 115, 165, 210 and 275). Figure 1A shows a section lateral to the disappearance of the lateral sulcus, Figure 1B–D demonstrate the typical appearance of the prelunate gyrus on sections roughly 2 mm apart, and Figure 1E shows the gyrus at a level medial to the end of the superior temporal sulcus. In all five sections, the gyrus has a smooth inverted "U" shape, and the layers follow the surface contours of the gyrus.
Fig. 1.
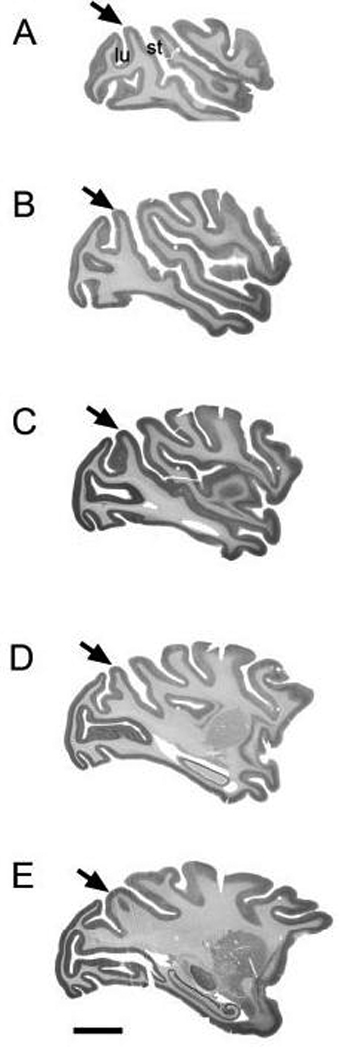
Location of the prelunate gyrus (arrow) in M. mulatta. All photographs of the parasagittal sections shown on panels A–E were taken from www.brainmaps.org (case RH12). (A) Section 42: 20.9 mm, (B) section 115: 18.0 mm, (C) section 165: 16.0 mm, (D) section 210: 14.2 mm, and (E) section 275: 11.6 mm. Posterior is to the left, anterior to the right. st, superior temporal sulcus; lu, lunate sulcus. Scale bar = 2 cm.
General Morphology
In many cases, examination of intact brains or brain photographs revealed an indentation running across the gyrus within about 2–3 mm of the dorsal end of the lateral sulcus. From a surface photograph it is impossible to determine if this indentation is a true sulcus or simply the footprint of a blood vessel. When the brain was available, gentle dissection could aid in determining if a sulcus was present. The determination was best made by examination of stained serial sections, which in some cases revealed a deep sulcus, in others a shallow sulcus, and in still others only a slight dimple on the surface. We refer to sulci within 2–3 mm medial to the intersection of the lateral and superior temporal sulci as the "prelunate sulcus". In some cases, other small sulci were seen either medial or lateral to that location. However, one should keep in mind that the localization and extent of the prelunate gyrus (and the prelunate sulcus, when apparent) vary considerably among individuals within a species as well as across species. We will therefore present the results for the different species separately.
Macaca nemestrina
In M. nemestrina, we found a small sulcus, which crosses the prelunate gyrus 2–3 mm medial to the medial termination of the lateral sulcus (Fig. 2A). In general, the brains of pigtail macaques appeared to have more dimples, and a more complex sulcal branching pattern than the brains of either M. mulatta (Fig 2D–F) or M. fascicularis (Fig. 2G). Figure 3 shows the prelunate sulcus on drawings of parasagittal sections from the left (PO-L) and right (BR-R) hemispheres of two different monkeys. In PO-L the sulcus is deep (section 1) but extends only about half way across the prelunate gyrus. In BR-R the sulcus begins buried in the anterior bank of the lunate (section 1), crosses the prelunate gyrus (section 2) and continues into the posterior bank of the superior temporal sulcus (section 3).
Fig. 2.
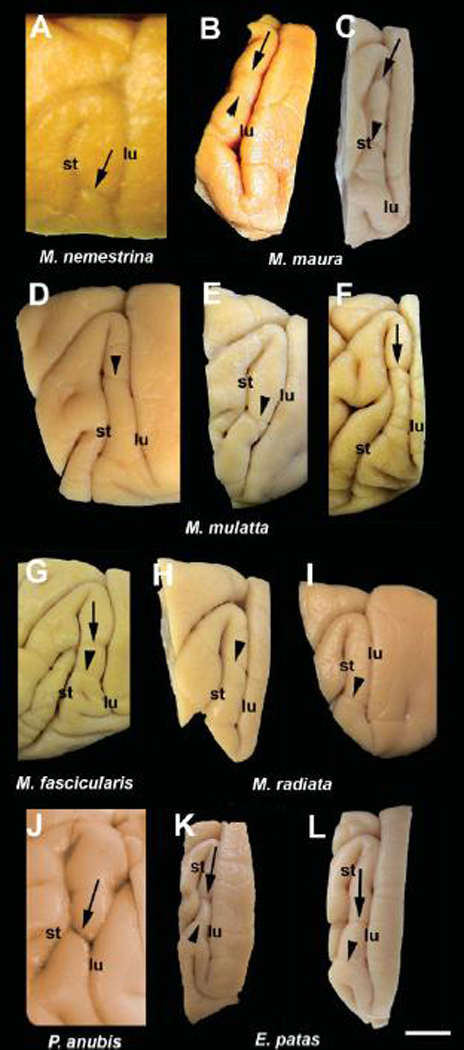
Variation in the general morphology of the prelunate gyrus and sulcus on lateral views of brain blocks from several monkey species. We refer to a sulcus within 2–3 mm medial to the intersection of the lateral and superior temporal sulci as the "prelunate sulcus" (arrow). Careful examination of the existence and shape of a prelunate sulcus crossing the prelunate gyrus revealed a deep indentation (arrows), a shallow sulcus or only a slight dimple on the surface or footprints of a blood vessel (arrowheads). (A) M. nemestrina, (B, C) M. maura, (D–F) M. mulatta, (G) M. fascicularis, (H, I) M. radiata, (J) P. anubis, (K, L) E. patas. Note that the sulcus is more marked in P. anubis and E. patas compared to the macaques (except in F), which show more variability in its occurrence. Panel A is a superior view of the brain and the other panels show lateral views. st, superior temporal sulcus; lu, lunate sulcus.Scale bar = 1 cm.
Fig. 3.
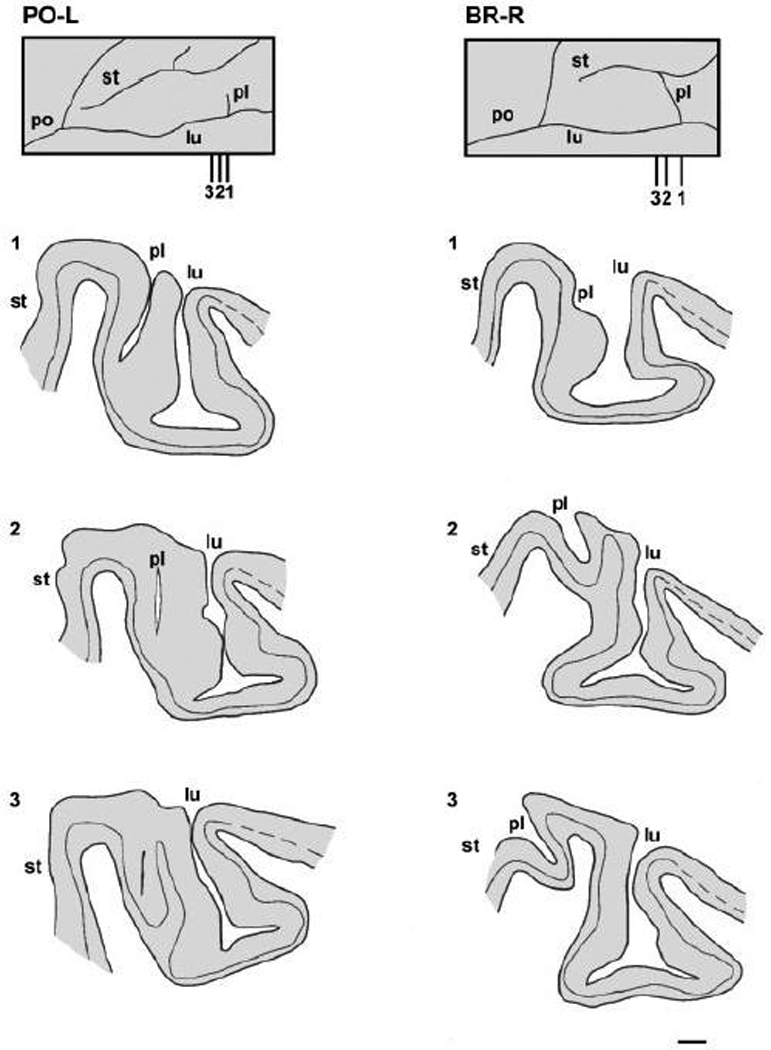
Schematic representation of the prelunate gyrus in M. nemestrina. The insets at the top of each column illustrate dorsal reconstructions of the prelunate gyrus in the left (monkey PO-L) and the right (monkey BR-R shown in Fig. 2A, see also Fig. 4) hemispheres of two animals, with the indication of three parasagittal sections (1–3) through the prelunate sulcus. The line drawings (1–3 or lateral to medial respectively) show the outlines of the cortex throughout the prelunate sulcus with the location of layer IV. The dashed lines represent the course of layer IV in the striate cortex. For case PO-L (left column), the sections are 0.5 mm apart, whereas for case BR-R (right column) sections 1 and 2 are 1.5 mm apart, and sections 2 and 3 are 1 mm apart. lu, lunate sulcus; pl, prelunate sulcus; po, parieto-occipital sulcus; st, superior temporal sulcus. Scale bar = 1 mm.
The pattern of fiber staining obtained with the Gallyas method showed changes at different mediolateral levels, with three distinguishable patterns. Figure 4 shows four sections through the prelunate gyrus of the right hemisphere of a M. nemestrina, stained with the Gallyas method. In Figure 4B, the most lateral, the staining pattern shows a broad band without crisply defined borders in layer IV, with the inner band of Baillarger denser than the outer. The representation of the vertical meridian bisects the prelunate gyrus at the level of Figure 4C, approximately at the arrow, and the staining patterns differ on either side. Anteriorly, the pattern is similar to the pattern in the first section, while posteriorly, toward the lunate sulcus there are two more sharply differentiated bands (Fig. 4C, white arrows). In Figure 4D the pattern is again more uniform across the gyrus with two sharp fiber bands. Figure 4E is just medial to the medial end of the superior temporal sulcus, and there is a dense outer band and a much less well-defined inner band.
Fig. 4.
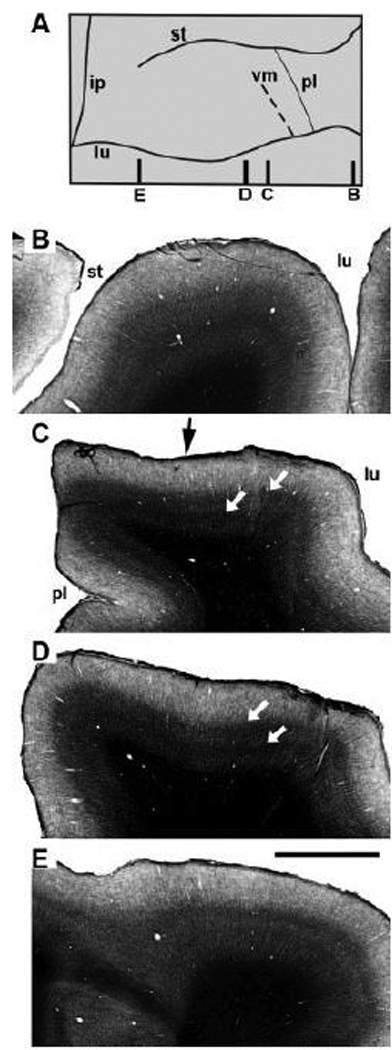
The prelunate gyrus in the right hemisphere of M. nemestrina (case BR-R, see also Fig. 3). (A) Dorsal reconstruction of the prelunate gyrus from case BR-R with the indication of four parasagittal sections throughout the prelunate gyrus (B–E). (B–E) Gallyas-stained sections illustrate a differential staining pattern throughout the prelunate gyrus at the different lateral (B) to medial (E) levels shown in A. In panel C the staining pattern is clearly different at the left and right sides of the black arrow that points to the vertical meridian representation (see also panel A, dashed line). Panel C illustrates clearly where the prelunate sulcus is buried in the anterior bank of the superior temporal sulcus. (A) Medial is to the left, lateral to the right, (B–E) Anterior is to the left, posterior to the right. ip, intraparietal sulcus; lu, lunate sulcus; pl, prelunate sulcus; st, superior temporal sulcus; vm, vertical meridian representation. Scale bar = 2 mm.
Macaca maura
In all of the specimens examined, two indentations were visible in the middle part of the prelunate gyrus of the Moor’s macaque (Fig. 2B–C). They were always located dorsally to the point where the lateral and superior temporal sulci joined. The dorsal indentation was usually more marked and more comparable to a true sulcus (Fig. 2C), as seen in M. nemestrina, whereas the ventral one was rather shallow (Fig. 2B).
Macaca mulatta
In most of the rhesus monkey hemispheres the prelunate gyrus appeared as in published atlases. However, in some hemispheres (10/39) different variations were seen. Figure 5A shows a surface view of the brain of one animal in which a shallow sulcus or dimple crosses the gyrus centered at about the level of the intersection of the lateral and superior temporal sulci. This is lateral to the "prelunate sulcus" seen in M. nemestrina (Fig 2A, Fig 3, and Fig 4). Figure 5B–D shows this sulcus on photomicrographs of parasagittal sections stained with cresyl violet. In this case, the sulcus was present in only one hemisphere. Figure 5E–H illustrates a case in which there was a deep sulcus bisecting the gyrus, at a level lateral to the intersection of the lateral and superior temporal sulci. Figure 5E is a section about 4 mm medial to the lateral edge of the brain where the prelunate gyrus has its typical appearance. About 800 µm more medially (Fig. 5F), the sulcus appeared and continued, throughout the sections shown in Figure 5G and 5H. This case was symmetrical with a similar sulcus in the other hemisphere. Figure 5I–L shows yet a different pattern, with a small sulcus in the middle of the gyrus at a level close to the medial end of the superior temporal sulcus. In addition, a very shallow dip in the prelunate gyrus at a more medial level, medial to the intersection of the lateral and superior temporal sulci was observed in one case (not shown).
Fig. 5.
The prelunate gyrus in M. mulatta, case JU-L (A–D), case HE-L (E–H) and case KO-R (I–L) illustrating sulcal variations. (A) Photograph of a dorsal view of the prelunate sulcus (arrow) crossing the prelunate gyrus of case JU-L. (B–D) Three consecutive parasagittal Nissl-stained sections through the prelunate gyrus illustrating the presence of a shallow prelunate sulcus (arrow). (E) Parasagittal Nissl-stained section showing the crown of the prelunate gyrus of case HE-L. (F, G) The prelunate sulcus is very deep (arrow). (H) The prelunate sulcus is no longer visible on the cortical surface but still reflected at the level of layer IV. (I–L) Four parasagittal Nissl-stained sections from case KO-R showing a shallow sulcus medially on the prelunate gyrus (arrow). (A) Medial is to right, lateral to the left, (B–L) posterior is to the right, anterior to the left, (B, E, I) top panels showing the most lateral sections from all cases respectively. lu, lunate sulcus; st, superior temporal sulcus. Scale bar = B–D = 2 mm, E–L = 4 mm.
Other variations in sulcal morphology were observed. For example, Figure 2D–F shows photographs of three hemispheres of different rhesus monkeys. In Figure 2D, the lateral sulcus terminates medially without intersecting the superior temporal sulcus. There were two indentations, one lateral and one medial to the level of the termination of the lateral sulcus. In another rhesus brain, shown in Figure 2E, there was an indentation ventrally in the prelunate gyrus, at the level where in this case the lateral sulcus terminated, in this case, without intersecting the superior temporal sulcus. Also, the rhesus monkey in Figure 2E shows a deeper indentation anteriorly than posteriorly where it becomes a dimple. Finally, Figure 2F shows a case in which the lateral sulcus ends without curving to join the superior temporal sulcus and there is a clear shallow sulcus well dorsal to the level of the end of the lateral sulcus.
Macaca fascicularis
In general, the appearance of the brains of the long-tailed macaque is identical to the brain of the rhesus monkey. Most of the hemispheres (22/25) examined resembled the typical appearance of the prelunate gyrus seen in the rhesus monkey (Fig. 2D–F). In one case there was a sulcus dorsally on the gyrus, together with a shallow indentation (Fig. 2G).
Macaca radiata and Macaca arctoides
The prelunate gyrus of the bonnet macaque showed no clear sulcus. Only slight dimples due to the presence of a crossing blood vessel were identified in the middle part of the gyrus (Fig. 2H) as well as more ventrally (Fig. 2I). The brain of one stump-tailed macaque was available. No sulcus was seen in this species (not shown).
Other cercopithecines and colobines
In the olive baboon, the prelunate gyrus was characterized by a deep, well-visible sulcus (Fig. 2J). The appearance of the occipital cortex and the prelunate gyrus in the patas monkey is quite different from what is seen in macaques. The prelunate gyrus is much narrower in E. patas (Fig. 2K, L), and in one case was partly obscured by the overlying striate cortex. A marked prelunate sulcus was present in all examined cases at a mid level in the prelunate gyrus, and one or more indentations made by crossing vessels occurred more laterally (Fig. 2K, L). A sulcus comparable to that seen in Erythrocebus was observed in the golden monkey, the grivet, the mandrill, and in the Colobus angolensis and T. françoisi specimens (not shown).
Overview of the Cytoarchitecture in the Prelunate Gyrus
A number of differences in the cytoarchitecture of the prelunate gyrus were seen among four species, M. maura (Fig. 6A–E), M. mulatta (Fig. 6F–J), M. radiata (Fig. 7A–D), and E. patas (Fig. 7E–H). In the Moor’s macaque, a dorsal and ventral indentation were present along the long axis of the prelunate gyrus as illustrated in Figure 6A, 6C and 6E, whereas in the rhesus monkey (Fig. 6F), the bonnet macaque (Fig. 7A), and the patas monkey (Fig. 7E), only one indentation was found medially in the prelunate gyrus. The indentation identified in the rhesus monkey is located at a very lateral location in the prelunate gyrus as shown in Figure 6F (see also Fig. 2E), compared to the location of the prelunate sulcus in other monkeys. Generally, in the bonnet macaque no clear sulcus was found, except in one specimen where there was a very shallow dip due to the presence of a blood vessel (Fig. 7A,C, see also Fig. 2H). In contrast, the deeper indentation in the prelunate gyrus of the patas monkey reflected the presence of a prelunate sulcus (Fig. 7E,G).
Fig. 6.
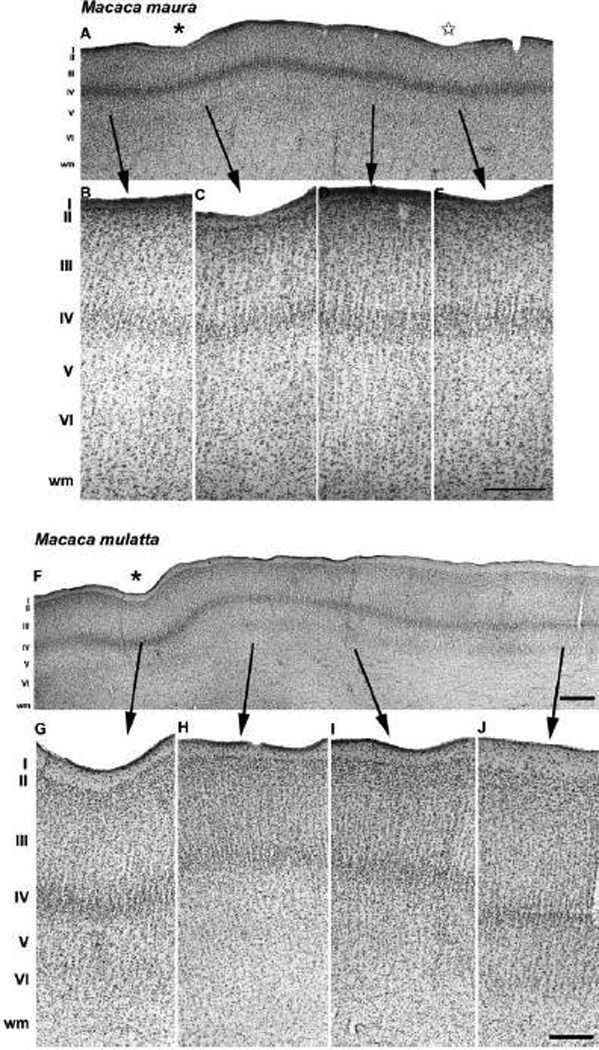
Cytoarchitecture of the prelunate gyrus in M. maura (A–E) and M. mulatta (F–J). (A) A Nissl-stained section cut parallel to the long axis of the prelunate gyrus of the Moor’s monkey clearly demonstrates the presence of a sulcus (asterisk in A, see also Fig. 2B), and a dimple (star in A). (B–E) High-power photomicrographs of panel A showing the laminar organization pattern along the prelunate gyrus. (F) A Nissl-stained section cut parallel to the long axis of the prelunate gyrus in the rhesus monkey illustrates one deep indentation ventrally in the prelunate gyrus (asterisk in G, see also Fig. 2E). The laminar cytoarchitecture of the prelunate gyrus in the rhesus macaque is outlined in panels G–J. Lateral is to the left, medial to the right. Arrows link the position of higher magnification panels to the overview in A. The scale bar on E = 500 µm (A) and 120 µm (B–E); the scale bar on F = 500 µm; the scale bar on J = 150 µm (G–J).
Fig. 7.
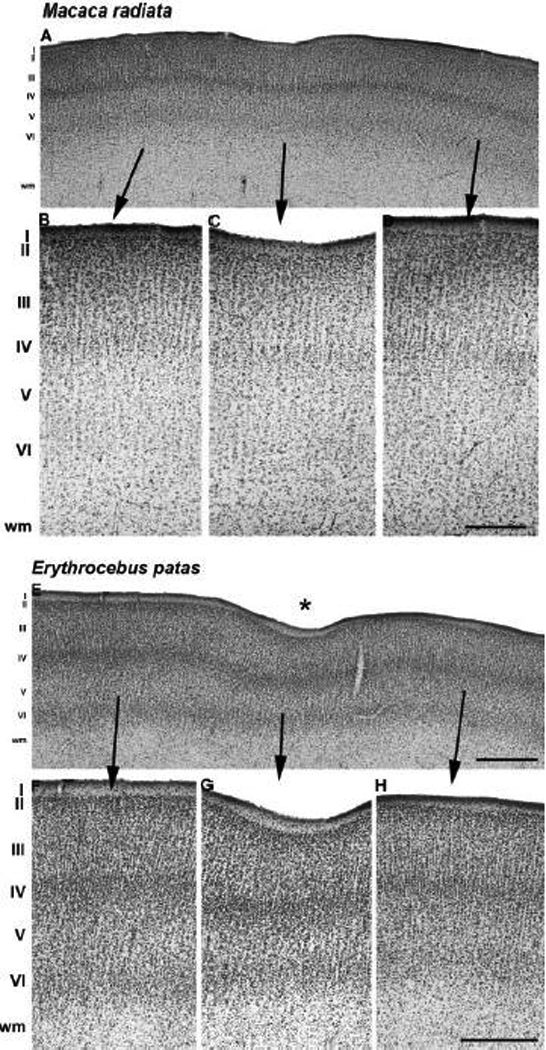
Cytoarchitecture of the prelunate gyrus in M. radiata (A–D) and E. patas (E–H). (A) Overview of a Nissl-stained section cut parallel to the long axis of the prelunate gyrus in the bonnet monkey (see Fig. 2H) illustrates a very shallow dimple in the cortical surface due to the imprint of a blood vessel (C). High-power photomicrographs ventral (B) and dorsal (D) to the dimple reveal the laminar architecture along the prelunate gyrus. (E) Overview of a Nissl-stained section cut parallel to the long axis of the prelunate gyrus in the patas monkey (see Fig. 2K) showing a deep indentation corresponding to the prelunate sulcus (G; asterisk in E). Panels F and H differ in cell packing and columnar structure compared to the laminar patterns in the three macaque species (Fig 6A–E, 6F–J, Fig 7A–D). Lateral is to the left, medial to the right. Arrows link the position of higher magnification panels to the overview in A. The scale bar on D = 500 µm (A) and 130 µm (B–D); the scale bar on E = 500 µm; the scale bar on H = 200 µm (F–H).
All low-magnification overviews of Nissl-stained sections of the prelunate gyrus in four species, M. maura (Fig. 6A), M. mulatta (Fig. 6F), M. radiata (Fig. 7A), and E. patas (Fig. 7E), clearly demonstrated that the laminar organization throughout the cortical thickness of the prelunate gyrus follows the curving pattern parallel to the depth of the dimple in these species. Furthermore, while the laminar cytoarchitecture along the prelunate gyrus was essentially similar in the three macaques species (Fig 6B–E, G–J, and Fig 7B–D), the laminar pattern in the patas monkey showed subtle changes towards the medial side of the prelunate gyrus (Fig. 7F–H). In Nissl-stained sections of E. patas, all cortical layers can be clearly delineated and layers III, IV and V become narrower dorsal to the prelunate sulcus (Fig. 7H) in comparison to its ventral aspect (Fig. 7F). Not only the thickness of the layers, but also the cellular organization along the prelunate gyrus differs between the patas monkey and the three macaque species. In Nissl stains of E. patas (Fig. 7F–H), the supra- and infragranular layers consist of more densely packed cells, which are distinctly structured in a columnar way, a pattern not readily apparent in any of the 3 macaques. However, based on Nissl-stained materials, the cytoarchitectural features of distinct cortical visual areas within the prelunate gyrus could not be reliably identified or delineated in these species.
SMI-32 Immunohistochemistry
Overview
We also analyzed SMI-32 immunostaining patterns along the prelunate gyrus in three different macaque species and in the patas monkey. Because neurofilament protein-immunoreactive neurons have been shown to vary substantially in their density, intensity, and laminar distribution among areas of the macaque visual cortex (Hof and Morrison, 1995), we felt these data would be helpful in clarifying the relation between variations in sulcal patterns and the borders of functional areas. Overall, the laminar distribution of neurofilament protein followed a characteristic pattern along the prelunate gyrus in each of the four species. Independent of staining intensity, the majority of labeled pyramidal neurons was observed in layers III and V, and there was a striking absence of neurofilament protein-immunoreactive cells in layers I and IV. Layer VI contained a less extensive population of lightly labeled smaller pyramidal cells. Interestingly, along the prelunate gyrus of all four monkey species, the regional differences in neurofilament protein immunostaining profiles were mostly prominent in layers II and superficial III (i.e., the upper one-third of layer III, referred as IIIa in Hof and Morrison, 1995). At least two prelunate regions could be distinguished clearly based on SMI-32 immunoreactivity patterns that corresponded to areas V4, ventrally, and DP, dorsally. These two visual areas, V4 and DP, are characterized by a specific and well-described SMI-32 staining pattern (Hof and Morrison, 1995). Briefly, the most striking feature of area V4 is the presence in layer II of a high number of SMI-32-immunoreactive neurons, whereas area DP is characterized by low numbers of large, intensely immunoreactive pyramidal cells in layers III and lower immunostaining intensity in layers V–VI. Below, we describe the specific neurofilament protein staining patterns in the anterior-posterior extent of the entire prelunate gyrus in four macaque species and in the patas monkey and show evidence for a novel intermediate cortical domain between areas V4 and DP that was not previously reported.
Macaca maura
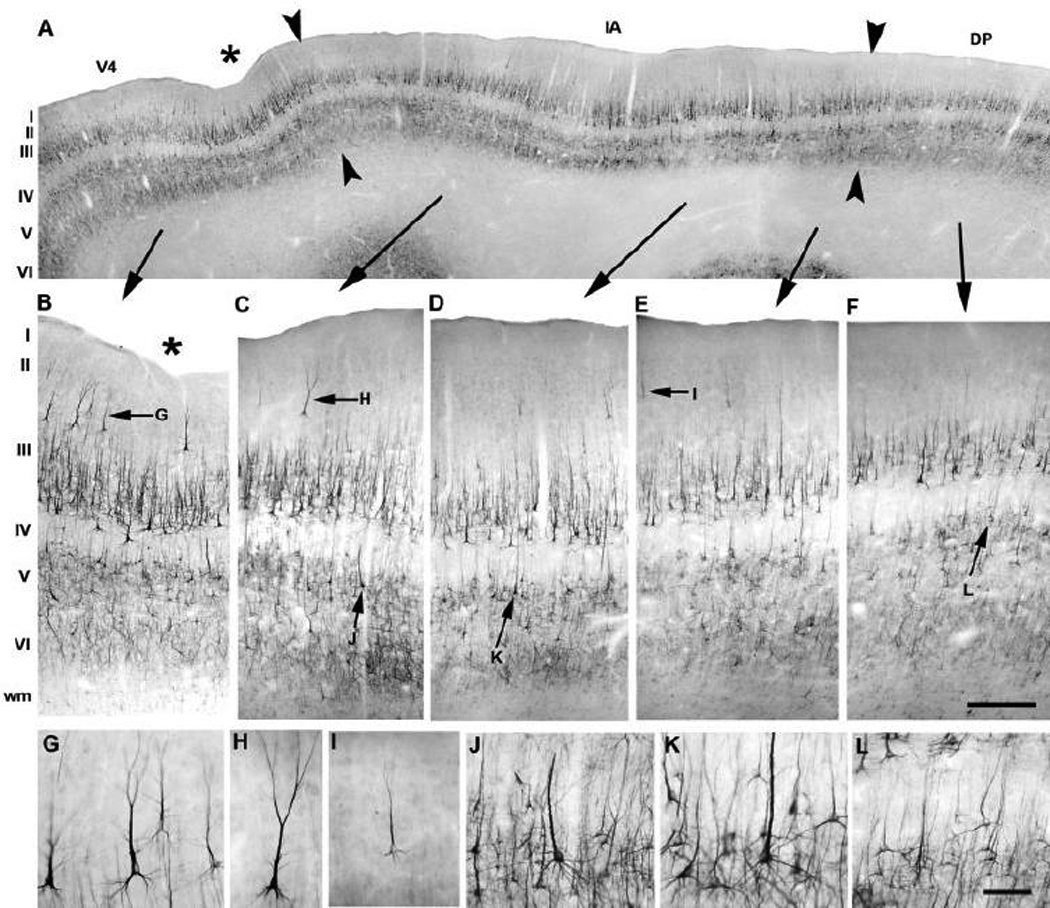
The regional and laminar differences in distribution of SMI-32 immunoreactivity along the cortical surface of the prelunate gyrus of the Moor’s macaque are shown in Figure 8. Two indentations, a ventral one and more dorsal one, were observed in this species (Fig. 8A, D, F; see Fig. 2B and the Nissl-stained section in Fig. 6). A bilaminar pattern of SMI-32 immunostaining was observed, with medium to large sized pyramidal cells immunoreactive for neurofilament protein in the deeper part of layer III and in layer V (Fig. 8A), whereas layer VI was characterized by a dense meshwork of immunoreactive processes and small neurons that were discernable from the background (Fig. 8B–G). Differences among area V4 (Fig. 8B), a novel intermediate area (IA) not described in Hof and Morrison (1995) (Fig. 8C–E), and area DP (Fig. 8F–G) were especially conspicuous in layer II and layer IIIa. In layers II and IIIa, darkly labeled cells were clearly present (Fig. 8B, J), whereas only scattered and lightly immunoreactive neurons with longer apical dendrites (Fig. 8H, I) were found throughout layer II between areas V4 and more dorsally DP in M. maura (Fig. 8C–E). In contrast, in layer II of area DP there was no SMI-32 immunoreactivity (Fig. 8G). Although the staining pattern remained basically the same throughout layer III along the entire gyrus (Fig. 8B–G), an increase in staining intensity and density of immunoreactive pyramidal cells was observed from V4 to DP. It was higher dorsally in area DP (Fig. 8F, G, K) compared to ventrally in V4 (Fig. 8B, J), and the intermediate area (Fig. 8C–E). Layer V in DP (Fig. 8C–E) contained the most intensely stained and largest pyramidal cells with an extensive apical dendrite coursing through the upper layers and an abundant basal arborization pattern (Fig. 8L, M). Another difference between areas V4, DP, and the intermediate area was the staining pattern of upper layer V (i.e., the outer third of layer V, refered to as Va in Hof and Morrison, 1995). Layer V of areas V4 and DP did not contain large and intensely stained cells, but was characterized by lightly labeled and small to medium size SMI-32-immunoreactive pyramidal neurons (Fig. 8N). In contrast, layer V of the intermediate area between V4 and DP contained scattered, large and intensely stained pyramidal cells with an extensive apical dendrite, penetrating the upper layers, and an abundant basal arborization (Fig. 8L, M). From these differences in SMI-32 immunoreactivity we are able to distinguish three visual areas and their boundaries that corresponded to area V4 ventrally (Fig. 8B), area DP dorsally (Fig. 8F, G), and a novel transition area in between them (Fig. 8A, C–E), possibly equivalent to the field PM described physiologically by Maguire and Baizer (1984) and Youakim et al. (2001).
Fig. 8.
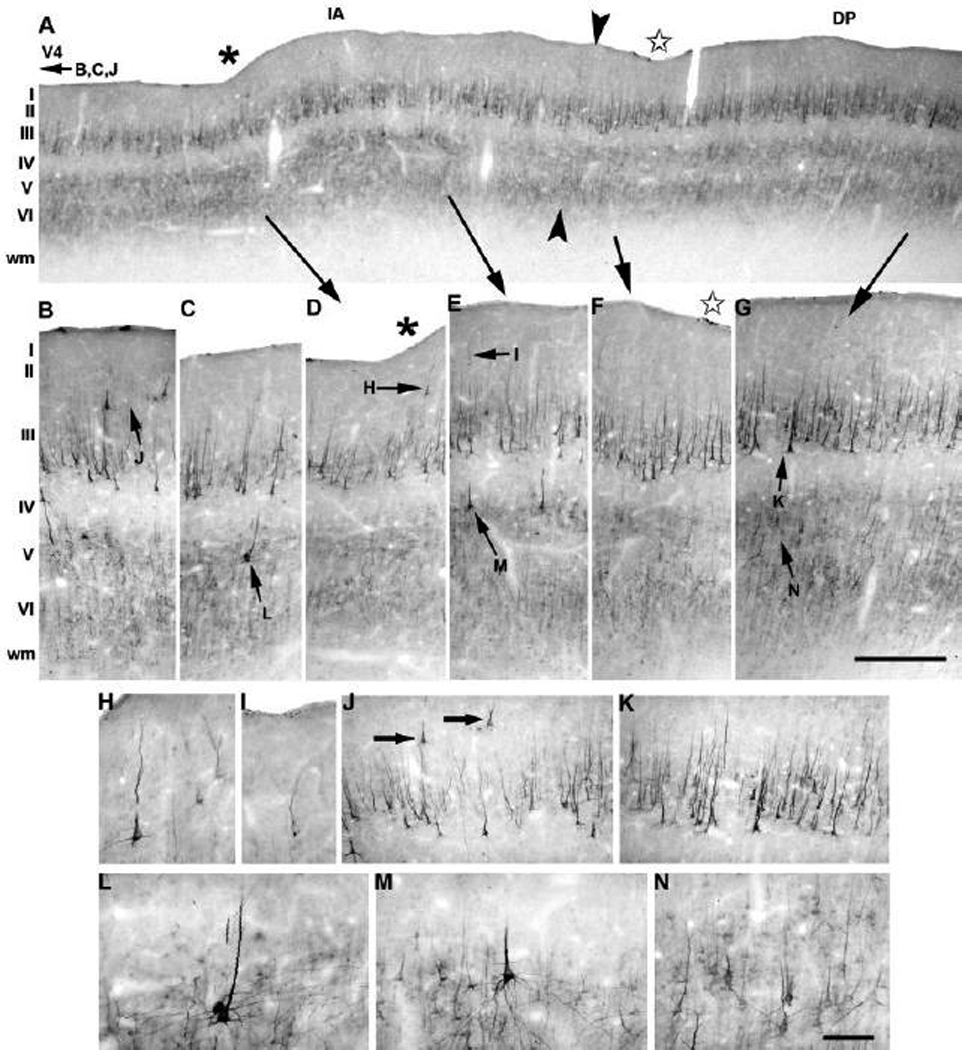
Expression of neurofilament protein along the prelunate gyrus in M. maura. (A) Immunoreactive pyramidal neurons are mainly found in layers II, III, and V. Arrowheads indicate the boundary between the intermediate area on the left and area DP on the right side. (B, J) Area V4 is specifically characterized by layer II SMI-32-immunoreactive pyramidal neurons. The ventral sulcus (A, D, asterisk) is located within the intermediate area (IA; A, C–E), which mainly contains SMI-32-immunoreactive neurons in layers II (H, I), III (J) and V (L, M). A star in A and F marks a dorsal indentation in area DP (A, F–G). In area DP, large, intensely labeled neurons are present in layer III (G, K), whereas lightly labeled SMI-32-immunoreactive cells populate layer V and VI (G, N). Lateral is to the left, medial to the right. The higher magnification panels are indicated by arrows, and corresponding letters, pointing to their locations in the overview or at intermediate power; this convention is valid for Figures 8–11. IA, intermediate area. The scale bar on G = 900 µm (A) and 120 µm (B–G); the scale bar on N = 60 µm (H–K) and 30 µm (L–N).
Macaca mulatta
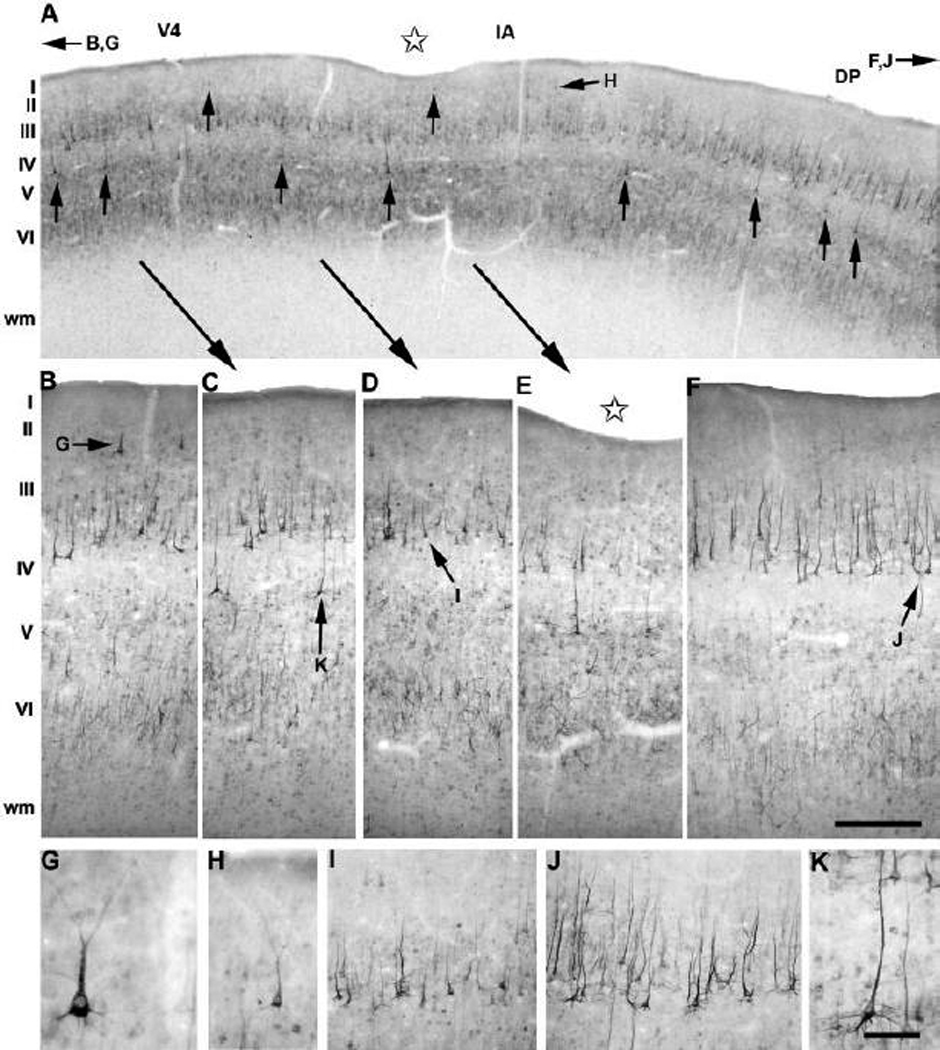
The immunocytochemical patterns for SMI-32 in the prelunate gyrus of the rhesus monkey was generally comparable to that of the Moor’s macaque, except that staining intensity was higher in the rhesus monkey (Fig. 9A). SMI-32 immunoreactivity also revealed differences in regional and laminar patterns throughout the prelunate gyrus, particularly in layers II and IIIa. The ventral part of the prelunate gyrus in this case was characterized by the presence of a deep indentation (Fig. 9A–B).
Fig. 9.
Regional and laminar distribution profile of SMI-32 immunoreactivity along the prelunate gyrus in M. mulatta. The overview panel (A, arrowheads) illustrates the borders of area V4 (B), the intermediate area (C–E) and area DP (F). The location of the sulcus in area V4 (A, B, asterisk) is more ventral compared to the location of the indentations in other macaque species, and it was more marked anteriorly than posteriorly (see also Fig 2B, 2E, 2H, Fig 8A and Fig 10A). For comparison, the apparent number and staining intensity of neurofilament protein-immunoreactive neurons in layer II drastically changes from area V4 (B, G), towards the intermediate area (C–E, H–I) and into area DP (F). Differences in the staining profile of SMI-32-immunoreactive layer V cells along the prelunate gyrus are illustrated in detail between the intermediate area (J, K) and area DP (L). Lateral is to the left, medial to the right. The scale bar on F = 500 µm (A) and 130 µm (B–F); the scale bar on L = 30 µm (G–L).
As described previously in rhesus monkey (Hof and Morrison, 1995), the striking feature of area V4 was the high number of darkly labeled cells with bifurcating apical dendrites and their clustered distribution in layers II-IIIa (Fig. 9A, B, G). In layer IIIb, SMI-32 immunoreactivity was confined to medium and large pyramidal cells with long apical dendrites, and in layer V to small and medium-sized neurons that were less intensely stained than the darkly stained layer III cells. These features demarcated the medial border of area V4 (Fig. 9A–B). In the adjacent region, dorsal to area V4 and corresponding to the intermediate area, layers II-III and V–VI, the features of cells and dendrites were comparable to those in area V4, except that neurons in this region were less densely packed and showed a lower staining intensity (Fig. 9C–E). SMI-32 immunoreactivity in layers II-IIIa was clearly present in this intermediate area (Fig. 9H–I), but only a few stained cells were apparent (Fig. 9A, C–E) compared to the layer II-IIIa pattern of area V4. Furthermore, the upper layers showed a gradual decrease in staining intensity and somal size of SMI-32-immunoreactive pyramidal cells throughout the prelunate gyrus (Fig. 9C–E, H, I). Small immunoreactive neurons and an extensive dendritic pattern were observed in layers V and VI, and layer V in the intermediate region contained darkly labeled pyramidal cells with a long apical dendrite reaching the upper layers (Fig. 9C–E, J–K). In adjacent area DP, two homogenous bands of moderate neuropil labelling were clearly visible in supra- and infragranular layers (Fig. 9A, F). Inter-regional differences were found in layers II-IIIa and V in comparison to area V4 and the intermediate area between DP and V4. There was no SMI-32 immunoreactivity in layers II-IIIa (Fig. 9F). Layers IIIb, V and VI exhibited a comparable expression profile of neurofilament protein as that seen in the transition area except for a lower cell density and the absence of large, intensely labelled pyramidal cells in layer V of DP (Fig. 9F, L). As in the Moor’s macaque, these patterns of SMI-32 immunoreactivity permitted the delineation of the architectural boundaries of the intermediate area between areas V4 and DP in the prelunate gyrus of the rhesus monkey (Fig. 9A).
Macaca radiata
SMI-32 immunoreactivity patterns in the prelunate gyrus of the bonnet macaque were strikingly similar to those in the Moor’s monkey (Fig. 10; for example compare the staining patterns of area V4 between the two species, Fig 8B and Fig 10B). The layer II-IIIa immunoreactive neurons of area V4 were also characterized by darkly stained perikarya and thick apical dendrites (Fig. 10G). Likewise, SMI-32 immunostaining was confined to medium-size pyramidal neurons and to dendritic processes in layers III, V and VI. The medial border of V4 showed the typical progressive decrease in SMI-32 immunoreactivity in layers II-IIIa (Fig. 10A, C–E, H) together with the appearance of large and strongly stained layer V pyramidal neurons in the intermediate area medially (Fig. 10A, C–E, K). Many of the strongly stained layer V pyramidal cells had an ascending apical dendrite terminating in the middle thir of layer III (Fig. 10A, C, E, K). Only a shallow dimple located in the intermediate area was present in the bonnet specimen shown in Figure 10.
Fig. 10.
Expression of neurofilament protein in the prelunate gyrus of M. radiata. (A) Low-power photomicrograph of the cortical surface along the axis of the prelunate gyrus showing the SMI-32 immunoreactivity pattern in the intermediate area around a very shallow dimple (see also Fig. 2H). Higher-power photomicrographs of the regional differences for SMI-32 immunoreactivity illustrating the borders between the three visual areas, area V4 (B, G), the intermediate area (C–E, H, K), and area DP (F), which are mainly defined by differences in layer II and V neurofilament protein-immunoreactive pyramidal neurons (see also panel A). Similarly, a differential staining profile of pyramidal cells and their apical dendrites is also clearly visible in layer III of the intermediate area (C–E, I) and area DP (F, J). Note that only layer V of the intermediate area contains darkly labeled large pyramidal neurons with apical dendrites crossing the upper layers (A, C–E, K). Lateral is to the left, medial to the right. The scale bar on F = 500 µm (A) and 130 µm (B–D); the scale bar on K = 500 µm; the scale bar on H = 200 µm (F–H).
Differences in neurofilament protein staining related to specific laminar and cellular features demarcated the intermediate area from area DP in the bonnet macaque (Fig. 10C–E, F). Layer IIIb of area DP exhibited a higher number of immunoreactive neurons with long apical dendrites reaching the upper layers (Fig. 10J), which showed a stronger immunoreactivity for SMI-32 compared to layer IIIb labeled neurons in the intermediate area (Fig. 10I). Another remarkable difference of area DP from the intermediate area was the lack of the typical intensely labeled large pyramidal neurons in layers II-IIIa and V (Fig. 10F). Altogether, the parcellation of the bonnet macaque’s prelunate gyrus was generally comparable to that in the Moor’s macaque (Fig. 8) and the rhesus monkey (Fig. 9).
Erythrocebus patas
The immunostaining pattern for SMI-32 in the prelunate gyrus of the patas monkey is shown in Figure 11. Patas monkeys displayed a distinct pattern of SMI-32 immunostaining in comparison to the expression profile of neurofilament protein observed in the three macaque species, M. maura (Fig. 8), M. mulatta (Fig. 9) and M. radiata (Fig. 10).
Fig. 11.
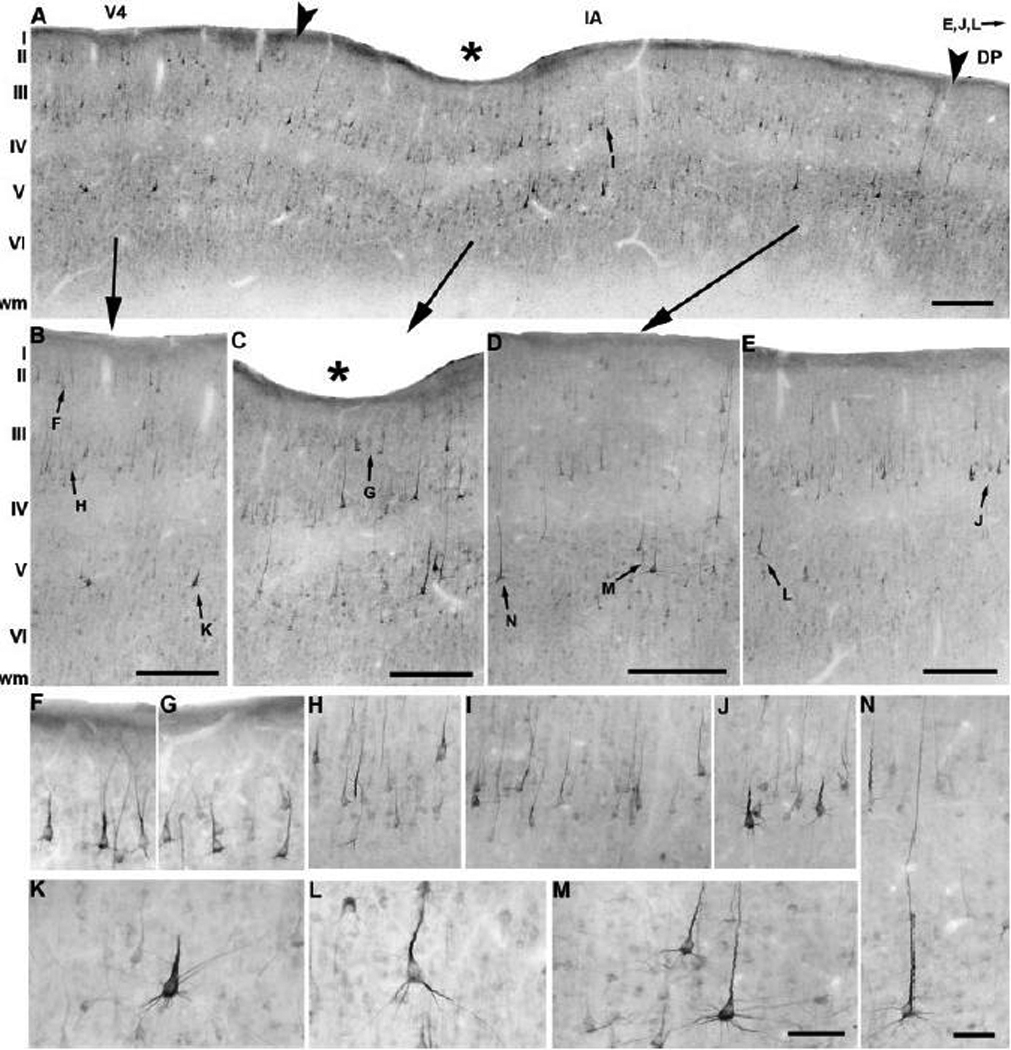
Neurofilament protein immunoreactivity in the prelunate gyrus of E. patas. (A) Generally, layers II, III, and V throughout the prelunate gyrus are moderately populated with SMI-32-immunoreactive pyramidal neurons. SMI-32 labeling shows variation in the laminar and cellular distribution patterns, revealing the borders between area V4 (B), the intermediate area (C–D) and area DP (E; see arrowheads). Immunoreactive neurons are prominent in layer II of area V4 (F), but a gradual decrease in the number of layer II cells occurs in the intermediate area (C–D, G), whereas area DP contains no immunoreactivity in layer II (E). Layer III is quite homogeneously stained for SMI-32 across area V4 (H), the intermediate area (I), and area DP (J). Intensely labeled layer V pyramidal cells with very long apical dendrites penetrating into layer II (N; another such neurons is visible on the right side of panel D), clearly demarcate the intermediate area (M) from abutting areas V4 (K) and DP (L). Asterisks indicate the deep indentation referred to as the prelunate sulcus located in the intermediate area (A, C, see also Fig. 2K). Lateral is to the left, medial to the right. The scale bar on A = 500 µm; the scale bars on B, C, D, E 200 µm; the scale bar on N = 40 µm (F–J, N); the scale bar on M = 40 µm (K–M).
Area V4 was characterized yet again by the presence of SMI-32-immunoreactive pyramidal neurons in layers II-III and V–VI. Interestingly, darkly labeled neurons were confined to layer II (Fig. 11A, B, F), but not to layer IIIa as was observed in the macaque species (Fig 8B, Fig 9B, Fig 10B). In the deeper part of layer V, strong SMI-32 immunoreactivity was seen in large pyramidal cells with a thick apical and a few basal dendrites (Fig. 11B, K). The intermediate area also showed a unique SMI-32 staining profile and could be recognized from its neighboring areas V4 and DP (Fig. 11A, C–D). Remarkably, a substantial population of large, intensely immunoreactive pyramidal neurons was present throughout the upper layer II of the intermediate area (Fig. 11A, C–D, G). No gradual decrease was noted in the apparent number, the staining intensity or the size of layer II cells towards area DP in the medial part of the prelunate gyrus (Fig. 11A, C–E), in contrast to the neurofilament protein characteristic profiles in the corresponding layer of the three macaque species. Lightly and darkly labeled pyramidal cells were obvious in layers III (Fig. 11A, C–D, I) and V (Fig. 11A, C, M–N). Moderately labelled SMI-32-immunopositive neurons displaying long apical dendrites penetrating layer II and in some cases reaching layer I were seen in the entire thickness of layer V in contrast to the macaques where these cells only occurred in layer Va (Fig. 11D, N). These neurons had a more extensive apical dendritic trunk than SMI-32-immunoreactive pyramidal cells in layer Va of other species, in addition to showing differences in staining intensity (for example, compare with the bonnet macaque in Fig. 10). SMI-32 immunostaining in layer VI was very light. The boundary between area DP and the intermediate area was located where the neuronal density and staining intensity increased in layer III (Fig. 11J) and decreased in layer V (Fig. 11E). No darkly labelled cells were seen in layer V of area DP, but lightly stained pyramidal cells with apical dendrites running into layer III were present (Fig. 11L). Layer VI was comparable to that in the intermediate area. In the prelunate gyrus of the patas monkey, we have observed clear, inter-regional differences in SMI-32 immunostaining among areas V4, DP and the intermediate area, that differ from the patterns observed in the macaques, particularly in upper layer II and layer V.
Posterior aspect of the prelunate gyrus
Posteriorly on the crown of the prelunate gyrus, the architectonic division of the three visual areas, i.e. area V4, the intermediate area, and area DP, could be easily visualized using SMI-32 immunoreactivity (Fig. 12) in comparison to the more rostral sections shown in Figure 8–Figure 11 for all monkeys. Due to the combination of the cutting angle and the effect of the gyrification of the brain, the cells were cut at a different angle compared to the staining profile seen in Figure 8–Figure 11, generating shorter apical dendrites of immunoreactive neurons, especially visible in the most prominent layers II, III and V. The positions of the boundaries of the three visual areas in every species were nevertheless consistent with these from the more anterior sections in all four monkey species. Interestingly, the location of the indentation in the prelunate gyrus is clearly present in the intermediate area or near its border with area V4. Figure 13 shows a gross morphology overview of the prelunate gyrus and its sulcus on the brain of a M. nemestrina, as well as surface renderings of the borders of areas V4, IA, and DP, inferred from SMI-32 staining patterns shown in Figure 8–Figure 12, from the four species in which immunohistochemistry was performed. This mapping demonstrates that the intermediate area cover in fact a considerable amount of cortical surface and might represent a distinct field as suggested earlier (Maguire and Baizer, 1984; Youakim et al., 2001).
Fig. 12.
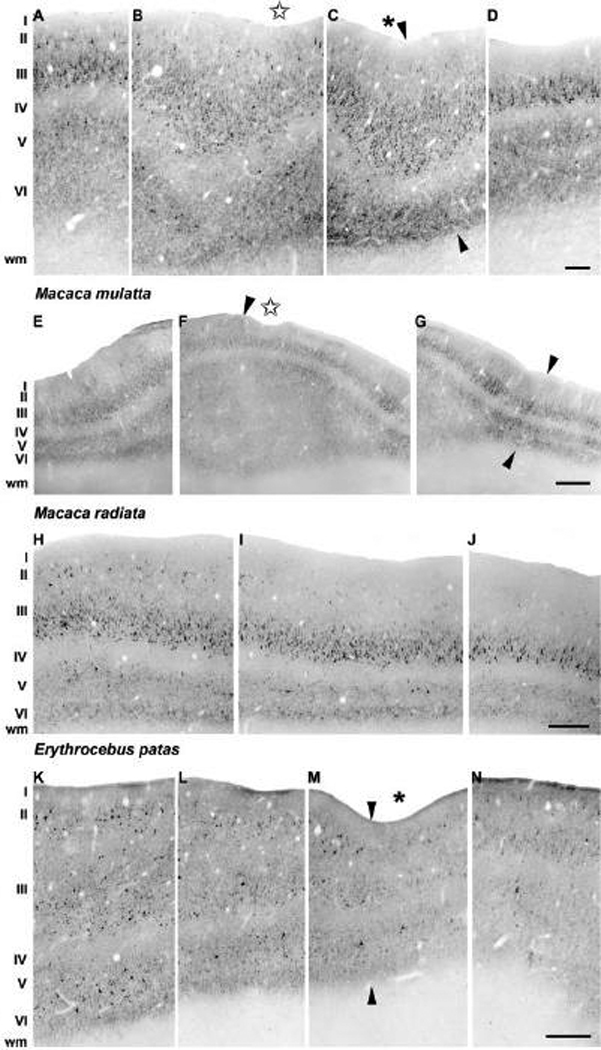
Overview of the expression profile of neurofilament protein in posterior sections of the prelunate gyrus in M. maura (A–D), M. mulatta (E–G), M. radiata (H–J), E. patas (K–N). SMI-32 immunoreactivity clearly illustrates the differential staining patterns along the prelunate gyrus and the SMI-32-immunoreactive patterns in layers II, III and V resemble the characteristic profiles from the anterior sections in the prelunate gyrus from all species (Fig 8–Fig 11). Arrowheads indicate the borders between abutting areas V4 (A, E, H, K), the intermediate area (B–C, F–G, I, L–M) and area DP (D, G, J, N). An asterisk indicates the location of the prelunate sulcus, and stars indicate shallow dimples. The sulcus was more marked anteriorly than posteriorly in the rhesus monkey depicted here (see also Fig 2E and Fig 9A,B). Lateral is to the left, medial to the right. The scale bar on D = 100 µm (A–D); the scale bar on G = 300 µm (E–G); the scale bar on J = 200 µm (H–J); the scale bar on N = 200 µm (K–N).
Fig. 13.
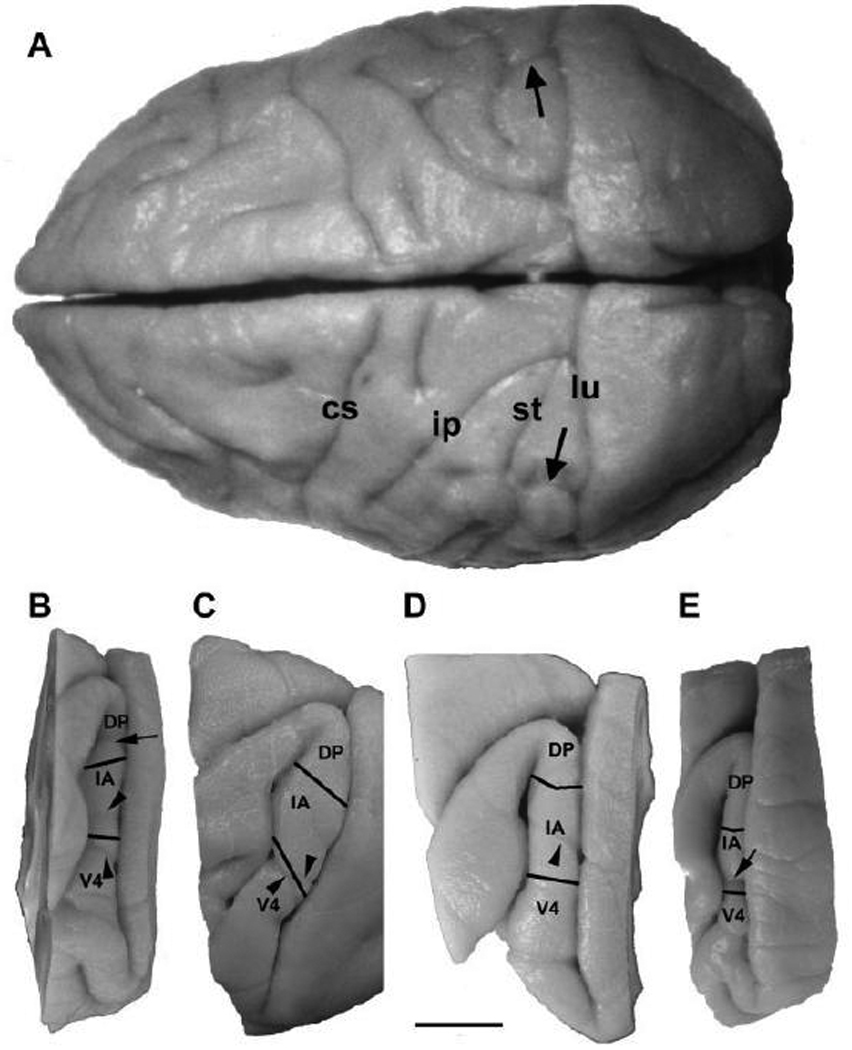
Localization of the prelunate gyrus and prelunate sulcus (arrows) on a superior view of the brain of a M. nemestrina (A). Panels B–E show lateral surface renderings of the common boundaries of areas V4, IA, and DP based on SMI-32 immunohistochemistry in M. maura (B), M. mulatta (C), M. radiata (D), and E. patas (E). Note the location of the prelunate sulcus, when present, in respect to the extent of the intermediate area and its border with area V4. cs, central sulcus; ip, intraparietal sulcus, st, superior temporal sulcus; lu, lunate sulcus. Scale bar = 1 cm for all panels.
Cladistic Analysis
Considering the distribution of the prelunate sulcus among the species available, its particular variability among macaques, and its apparent matching with the presence of a distinct chemoarchitectural domain in the prelunate cortex prompted us to perform a maximum parsimony reconstruction of ancestry of the character state in our sample (Fig. 14). The results show that the distribution of characters, namely absence, presence of a prelunate sulcus, or presence of a shallow depression, comes out very neatly when mapped onto a phylogenetic tree of cercopithecoids (Tosi et al., 2003). Based on the most parsimonious mapping of prelunate gyrus morphology, it is clear that the presence of a sulcus represents the primitive condition for the clade. The trait is present in the common ancestor of all cercopithecoids and appears to have been gradually lost following the divergence of Asian macaques from their original African ancestor around 5 millions years ago (Fig. 14). These data support our morphologic and histologic investigations and further point to differences between a “nemestrina+Sulawesi” macaque clade and all other macaque species, which appears to be consistent with available morphologic and molecular phylogenetic data (Fooden, 1976; Delson, 1980; Zhang and Shi, 1993; Morales and Melnick, 1998; Groves, 2001; Tosi et al., 2003; Raaum et al., 2005).
Fig. 14.
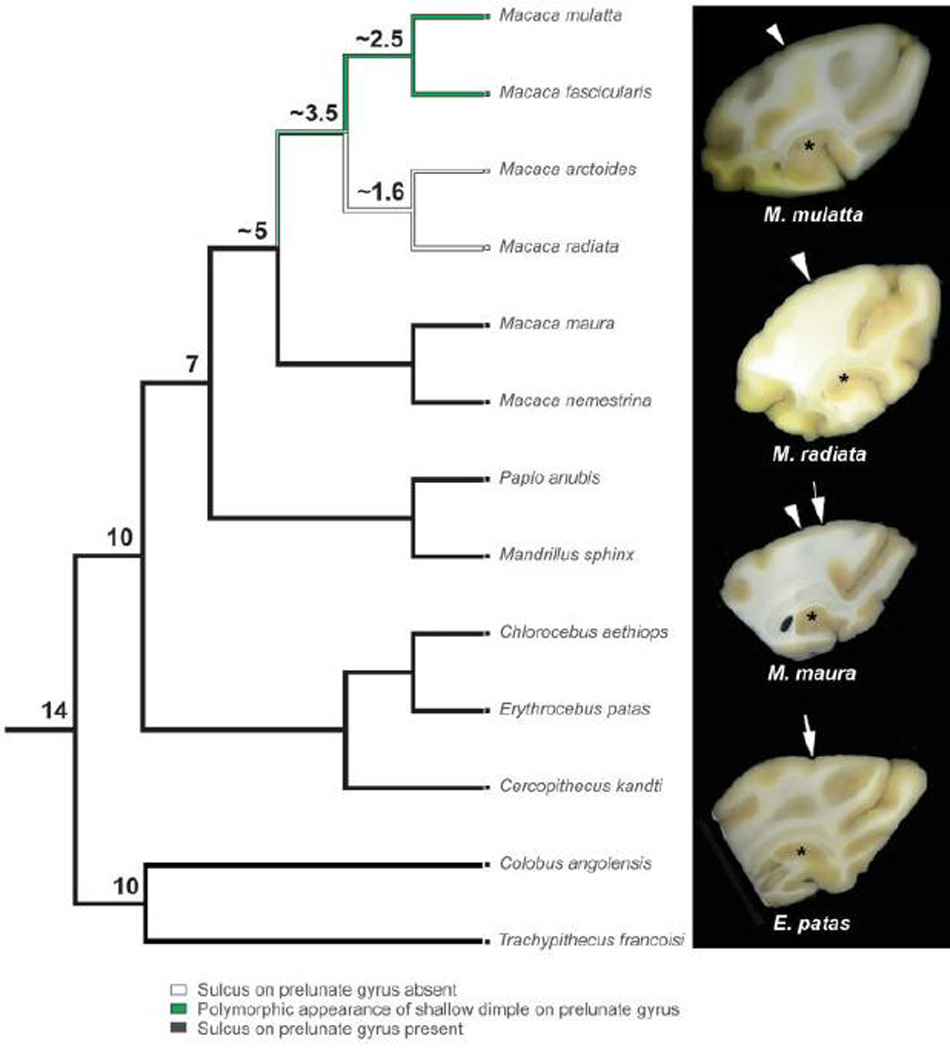
Cladistic analysis of the prelunate sulcus in the available sample. The character states were mapped onto the phylogeny of cercopithecoids provided by Tosi et al. (2003), and a maximum parsimony reconstruction was performed. The most recently diverged macaque species, like M. radiata and M. arctoides in our series lack the trait, and it is equivocal in M. mulatta and M. fascicularis. The nemestrina-Sulawesi clade, however, consistently retains the trait that is seen in all other cercopithecoids investigated. The numbers above some ancestral nodes indicate divergence from present in millions of years (Morales and Melnick, 1998; Tosi et al., 2003). The panels at right show example of the character state in the four species that were analyzed by immunohistochemistry. A true sulcus is indicated by an arrow and a shallower indentation by an arrowhead.
DISCUSSION
Summary of Findings
We have examined both the gross and the fine structure of the cortex of the prelunate gyrus in several species of Old World monkeys. We observed substantial variation of both the general anatomy and the fine structure of the prelunate gyrus within six species of the genus Macaca and among specimens of Erythrocebus, Chlorocebus, Cercopithecus, Papio, and two member of the Colobine subfamily. Thorough inspection of the prelunate gyrus in all species revealed the presence of at least one clear indentation running across the gyrus in at least some members of all macaque species, except in the bonnet and stump-tailed monkey, but also in the other less closely related animals like the patas monkey, the grivet, the golden monkey, the olive baboon, the mandrill, and the Angolan colobus and François’ langur.
In the present study, we have also found significant regional differences in the expression patterns of neurofilament protein in the prelunate gyrus of three macaque species - M. maura, M. mulatta, M. radiata - and of the patas monkey. Neurofilament protein immunostaining showed specific laminar distribution and cellular typology profiles defining three regional patterns with their architectural boundaries in the cortex along the prelunate gyrus in all four monkey species, as well as differences in staining patterns and labeled neuron distribution between the patas monkey and the macaques.
Finally, a maximum parsimony reconstruction of ancestry analysis revealed that the presence of a prelunate sulcus and the possible expansion of a specific cortical domain in area V4 are consistent with molecular phylogenetic relationships among cercopithecoids. These data suggest that the prelunate sulcus was progressively lost during the recent evolution of Asian macaques and is consistent with our morphological results.
Visuotopic and Anatomic Organization of the Prelunate Gyrus
The classical view of the organization of prestriate cortex in macaque monkey, based on cytoarchitectonics in M. mulatta is that there are two prestriate areas, 18 and 19 (Von Bonin and Bailey, 1947). Many studies since have shown the organization of prestriate cortex to be considerably more complex, with a multitude of visual areas identified by both anatomical and electrophysiological techniques (for review see Felleman and Van Essen, 1991; Kaas, 1997; Rosa, 1997). The region of interest in this study, the prelunate gyrus, was first identified as including visual area V4 on the basis of projections from areas V2 and V3 (Zeki, 1971). Subsequently a weak projection from striate cortex was also found (Zeki, 1978). The prelunate gyrus is now considered to include at least two visual areas, V4 and DP, but the total parcellation of this cortex remains uncertain (see Fig. 1 in Rosa and Tweedale, 2000; Sereno and Tootell, 2005; Stepniewska et al., 2005). There were also suggestions of a complex internal organization within V4 (Van Essen et al., 1990) but that idea has not received much support subsequently.
Another approach to the study of the organization of primate prestriate cortex comes from anatomical and electrophysiological data in the New World monkey, beginning with the pioneering studies of Allman and Kaas in the owl monkey (Allman et al., 1973; Allman and Kaas, 1974a; Allman and Kaas, 1974b; Allman and Kaas, 1975; Allman and Kaas,1976). Further studies of the organization of prestriate cortex have used the owl monkey (Kaas and Morel, 1993), the marmoset (Rosa and Tweedale, 2000; Lyon and Kaas, 2001), the cebus monkey (Fiorani et al., 1989; Piñon et al., 1998); the squirrel monkey (Cusick and Kaas, 1988); two prosimian primates, the bushbaby (Symonds and Kaas, 1978; Wall et al., 1982; Cusick et al., 1984), and the slow loris (Preuss et al., 1993), and an animal closely related to primates, the tree shrew (Lyon et al., 1998; Catania et al., 1999). In general, the brains of New World monkeys have fewer and shallower sulci and are therefore more amenable to both electrophysiological and anatomical studies than the Old World macaques in which much of the territory of interest is buried in deep sulci. Kaas and Rosa and their collaborators have argued that the basic plan of organization is comparative in New and Old World monkeys and that data from New World monkeys are useful in interpreting the pattern in macaques (Rosa, 1997; Rosa and Tweedale, 2000; Kaas and Lyon, 2001; Rosa and Tweedale, 2005). The area considered equivalent to V4 in the New World monkey is DL, the dorsolateral crescent, first described in owl monkey (Allman and Kaas 1974a). In further electrophysiological studies in the owl monkey, DL was divided into three areas, termed DLp, (posterior), DLi (intermediate) and DLa (anterior) areas (see Rosa, 1997). On the basis of anatomical connections, two divisions, a rostral (DLr) and a caudal (DLc) division were proposed (Cusick and Kaas, 1988, squirrel monkey). The division of V4/DL (terminology of Stepniewska et al., 2005) into two areas is also supported by data on connection patterns in the rhesus monkey (Stepniewska and Kaas, 1996; Stepniewska et al., 2005). Overall, the data from both New World and Old World monkeys overwhelmingly support the idea that V4/DL may be subdivided into at least two areas, with the caudal subdivision V4c or classic V4, the area on the prelunate gyrus (Stepniewska et al., 2005).
There have also been attempts to determine the numbers and borders of visual areas using myelo- and cytoarchitecture. There are two factors that impose limitations on the usefulness of these data in determining borders. One is that plane of section varies among studies and the appearance of cortex in deeply infolded regions can vary depending on plane. More importantly is the number and spacing of sections studied, as boundaries are best seen when both areas are visible on the same section.
Studies using cytochrome oxidase histochemistry have shown compartments within visual areas V1 and V2 (Horton and Hubel, 1981; Livingstone and Hubel, 1984; DeYoe and Van Essen, 1985), but have been of limited usefulness in revealing borders of higher visual areas. Myeloarchitecture was first useful in distinguishing visual areas MT and V3 (Van Essen et al., 1986). Many studies confirmed the distinctive myeloarchitecture of MT and myeloarchitectonics have been used to identify several visual areas, including V4 (Ungerleider and Desimone, 1986a; Ungerleider and Desimone, 1986b).
Our data show three different myeloarchitectonic patterns on the prelunate gyrus of M. nemestrina, interestingly with a pattern boundary corresponding to the location of the vertical meridian representation. This suggests that the myelination of this novel intermediate area differs from that of the cortex extending toward the lunate sulcus, dorsally and posteriorly. On the other hand, the cytoarchitectonic staining patterns in several macaque species and the patas monkey in the present study did not provide additional information on the cortical organization and the location of possible topographic boundaries along the prelunate gyrus. However, more reliable parcellation of cortical areas in the mammalian neocortex has been achieved using neurochemical markers, such as Cat-301 and neurofilament proteins (Hendry et al., 1984; Campbell and Morrison, 1989; De Yoe et al., 1990; Hof and Morrison, 1995; Hof et al., 1996; Van der Gucht et al., 2001, 2004; Bourne et al., 2005; Boire et al., 2005; Baldauf, 2005). Immunoreactivity to a cell surface protein using the monoclonal antibody Cat-301 (Hendry et al., 1984; Hendry et al., 1988; De Yoe et al., 1990; Van Essen et al., 1990) has been useful as a marker for neurons associated with the M–stream or “dorsal” stream of information processing in monkeys (Hendry et al., 1984; De Yoe et al., 1990). Immunoreactivity to a nonphosphorylated epitope on neurofilament proteins (Sternberger and Sternberger, 1983; Lee et al., 1988) has been used extensively to describe the architectonic parcellation of monkey and human neocortex and to determine the laminar and regional distribution of a subset of projection neurons (Campbell et al., 1991; Carmichael and Price, 1994; Hof and Morrison, 1995; Chaudhuri et al., 1996; Hof et al., 1996; Nimchinsky et al., 1996; 1997; Kobayashi and Amaral, 2000; Lewis and Van Essen, 2000; Vogt et al., 2001).
In the present study, neurofilament protein immunoreactivity proved useful in delineating cortical areas in the prelunate gyrus of three different macaque species and one patas monkey. Overall, the staining pattern for neurofilament protein along the prelunate gyrus as observed in the these species corresponded to what had been previously described for the prelunate visual areas V4 and DP in the rhesus monkey by Hof and Morrison (1995). However, significant differences from this parcellation scheme of the prelunate gyrus were observed in the present study. At the regional level, variation in SMI-32 immunoreactivity revealed three areas chemoarchitecturally, namely ventral area V4, dorsal area DP and an intermediate area in between V4 and DP, along the prelunate gyrus in the four Old World monkey species. We were able to locate reliably the medial border of V4, which is separated from area DP by a distinct intermediate area (IA in Fig 8–Fig 11), based on a characteristic pattern of SMI-32 immunolabeling in each monkey species. The present findings regarding the subdivision of the prelunate gyrus into three different regional patterns correspond with the interpretations of mapping studies (Maguire and Baizer, 1984; Youakim et al., 2001). Mapping the visuotopic organization of the prelunate gyrus in M. nemestrina had revealed an inhomogeneity in the topographic order at the crown of the prelunate gyrus and an inconsistency about the placement of the medial border of area V4 in other species (Gattass et al., 1988). Interestingly, in M. nemestrina a prelunate sulcus was consistently found crossing the prelunate gyrus. That sulcus was found within 2 mm of the visuotopic landmark, the representation of the vertical meridian. As a vertical meridian representation often marks the boundary of a visual area (Rosa, 1997; Rosa and Tweedale, 2005), it is possible that when present the prelunate sulcus represents a landmark for the location of the medial border of V4, and the intermediate area is roughly equivalent to area PM described physiologically (Maguire and Baizer, 1984; Youakim et al., 2001). However, our findings clearly point out that the structural parcellation of the prelunate gyrus is conserved among Old World monkeys and appears to be present regardless of the presence, the location, or morphology of the prelunate sulcus.
Evolutionary and Ecological Considerations
Cercopithecoid or Old World monkeys represent a complex family in Primates. Generally, they are divided into two monophyletic subfamilies, the cercopithecines (cheek-pouch monkeys) and the colobines (leaf-eating monkeys). They likely evolved first in Africa, about 25 million years ago, and the split between the two subfamilies occurred about 14 million years ago (Stewart and Disotell, 1998; Raaum et al., 2005). Among cercopithecines, the guenons diverged the earliest followed by the baboons and related species, and finally the macaques. In this study, we also had the opportunity to observe materials from two representative colobines, the Angolan colobus and François’ langur, and a larger collection of cercopithecines, including guenons, baboons, and macaques. The fact that the prelunate sulcus was present in the guenon genus that were available to us, C. kandti, as well as in the closely related E. patas and Chlorocebus aethiops, suggests that this feature may represent a primitive character state for the entire subfamily, which would be further supported by the fact that it is also present in the two colobine specimens we obtained, Colobus angolensis and T. françoisi. It would have been interesting to assess the situation in New World monkeys, the other lineage of anthropoid primates, but most (and certainly all New World species in our collection) do not have a visible lunate sulcus and prelunate gyrus.
The situation of this character state is however complicated in cercopithecines, and particularly among macaques. Macaques and baboons are closely related taxa lumped with the mangabeys, the drills, and the geladas into a tribe known as papionins (Stewart and Disotell, 1998; Disotell, 2000; Groves, 2001; Tosi et al., 2003; Raaum et al., 2005). Among them, a prelunate sulcus was observed in the olive and the yellow baboons, and in the mandrill, but the macaques exhibited a more diverse representation of this feature. The genus Macaca is remarkably diversified (Fooden, 1976; Delson, 1980; Zhang and Shi, 1993; Morales and Melnick, 1998; Groves, 2001; Tosi et al., 2003) to the point that its monophyly was debated until it was recently resolved by molecular studies (Morales and Melnick, 1998; Tosi et al., 2003). Our results show that a prelunate sulcus is present in M. maura, and M. nemestrina, only occasionally visible in M. mulatta and M. fascicularis and located more lateral or more medial than in M. maura and M. nemestrina, and absent in M. arctoides and M. radiata. Considering the fact that the prelunate sulcus is also present in Papio and Mandrillus, which diverged earlier than macaques, the distribution of the character state among macaque is interesting to view from the standpoint of molecular phylogenetics in Macaca. Following on earlier studies based on genitalia specializations that separated the genus into four species-groups (Fooden, 1976), a comparable grouping was proposed by studies of mitochondrial DNA (Zhang and Shi, 1993), of 12S and 16S mitochondrial ribosomal genes (Morales and Melnick, 1998), and the testis-specific protein Y chromosome (Tosi et al., 2003). Morales and Melnick (1998) first confirmed the monophyly of the genus and provided a phylogenic grouping in four species groups with the only African species, M. sylvanus, being the sister-clade to all the others (Asian) species. The next group is formed by M. nemestrina and the Sulawesi species (that include M. maura), the third M. fascicularis and M. arctoides, and finally a group composed of M. mulatta and all of the remaining macaque species (i.e., including M. radiata in the present study).
Of note, the distribution of character states among extant taxa accords closely with Macaca species grouping proposed by Delson (1980). In this classification, the “fascicularis group” includes M. fascicularis and M. mulatta of the present study, the “sinica group” includes M. arctoides and M. radiata; and the “silenus group” includes M. nemestrina and M. maura (Delson, 1980). Reconstruction of character states at ancestral nodes suggests that this sulcus was reduced in the last common ancestor of the “fascicularis group” and the “sinica group”, with consequent further character transformation in the “sinica group”. At the level of cortical organization, the prelunate sulcus may only allow for the representation of one of the subdivisions of the prelunate gyrus to be expanded in certain species, in most cases the intermediate area between V4 and DP described in this study, potentially conferring an advantage for specific aspects of visual information processing that are performed by area V4.
Indeed the expansion of cortical surface within a defined functional region is frequently conditioned by the formation of fissures or sulci. Such morphogenetic process in turn contributes to species-specific patterns on inter-regional connectivity and has been proposed to regulate tension along axonal paths, the strength of interconnectedness among nearby cortical domains and the economy of cortical wiring in general (Van Essen, 1997). It is also known that whereas the pattern of gyri and sulci does not necessarily correspond to cyto- or chemoarchitectural boundaries (Hof and Morrison, 1995), functional domains frequently map along gyral and sulcal features as shown in the raccoon somatosensory cortex (Welker and Seidenstein, 1959; Welker, 1990), and in the macaque monkey visual cortex (Van Essen, 1997). From an evolutionary point of view, it could be argued that differences among (related) species in the gyrification and sulcation patterns of the cortical surface is a reflection of phylogenetic variability in the density and potential strength of axonal wiring among connected cortical regions (Welker, 1990). Such patterns are in turn likely to be influenced by genetic and importantly, epigenetic factors and adaptive pressure.
The functional relevance of an expanded part of a specific visual cortical region in the context of species evolution, adaptation to the environment, cognitive abilities, and general behavior, remains difficult to assess. Nonetheless, the present observations indicate that species with a longer evolutionary history are characterized by the presence of prelunate sulcus, compared to more recent ones, and that some species, the patas monkey and papionins in particular, are characterized by a particularly marked sulcus, whereas it is shallower in other species. This may be related in the patas monkey to other visual and motor brain specializations unique to the species. Sherwood et al. (2003) demonstrated that neurons involved in specialized sensorimotor adaptations in primates, the Betz cells in the primary motor cortex and the Meynert cells in the primary visual cortex, tend to increase in size in relation to body weight, brain weight, and encephalization. Of interest, the patas monkey had unusually large Betz cells, the ratio of the somatic volume of these cells to that of the other pyramidal neurons in the same cortical region being far higher than that obtained even in hominids, that have a brain size at least four times larger. Similarly, E. patas and papionins had larger Meynert cells than all of the other species surveyed in that study (Sherwood et al., 2003). Our results show the existence in the intermediate area between areas V4 and DP of a population of SMI-32-immunoreactive neurons in layer V with extensive apical dendritic arbors reaching layers I and II, which were not encountered in other species (see Fig. 11D, N). Whereas the role and connectivity of such layer V neurons are not known, they are in a position to form corticopontine or corticotectal projections (Brodal, 1978; Glickstein et al., 1985, 1990).
Although the region considered in the present study includes, or is at least nearby to, the representation of the vertical meridian in those species for which electrophysiological mapping data exist, it is difficult to make inferences about visual organization in the additional species as no electrophysiologic data or information on visually-guided behaviors are available for most of the species included in this study. Similarly, the presence of a prelunate sulcus does not directly correspond to natural habitats or dietary patterns among the available cercopithecoid species. However, the possibility of the involvement of a domain of cortex in area V4 specialized for certain spatial visual skills is compatible with some physiologic observations. Lesions in the prelunate gyrus that include areas V4 and TEO induce deficits in spatial generalization of visual discrimination of shape and color within short distances in the hemifield in macaque monkeys (De Weerd et al., 2003). Whereas this study was performed in M. mulatta, it is possible that species living in open savannah and semi-desertic environments, like E. patas, have retained an expanded domain of area V4 around the representation of the vertical meridian. Indeed, for such species, vigilance and feature detection are essential for predator avoidance (Seyfarth et al., 1980; van Schaik et al., 1983; Janson, 1992).
In conclusion, the present data are consistent with neuroanatomic, ecological and ethological evidence for the occurrence of adaptive changes in sensorimotor processing in species characterized by specific open-arid habitats and large colony size (van Schaik et al., 1983; Janson, 1992; Sherwood et al., 2003). Our results provide some evidence for the evolution of a brain specialization in cercopithecoids, which appears to match the phylogeny of these species. These differences suggest differences in brain organization and function among macaque species. The reason for the apparent disappearance of the prelunate sulcus in macaque species that diverged later than the “nemestrina+Sulawesi” group is probably linked to changes in ecological niche and adaptive pressure, but remains to be elucidated.
ACKNOWLEDGEMENTS
We thank Dr. K. Burnat, and B. Van Ranst, S. Brussche and K. Deckers for help with the immunocytochemical experiments, and Dr. C.C. Sherwood for helpful discussion, advice on cladistics, and sharing specimens. Dr C. Bonar and the Cleveland Metroparks Zoo provided access to P. anubis and T. françoisi. The brains of one M. mulatta and one M. fascicularis were gifts of Prof. R. Vogels. Dr. D. Bender provided sections from M. mulatta and M. fascicularis brains from his collection and Dr. J.M. Erwin provided the brains from the Moor’s macaques and the patas monkeys.
Grant sponsor: National Institutes of Health; grant number: MH42130. Grant sponsor: the Whitehall Foundation (J.S.B.)
Grant sponsor: Research Fund KU Leuven; grant number: OT-05/33 (L.A., E.V.d.G.)
Grant sponsor: the James S. McDonnell Foundation; grant number: 220020078 (P.R.H.)
LITERATURE CITED
- Allman JM, Kaas JH. A crescent-shaped cortical visual area surrounding the middle temporal area (MT) in the owl monkey (Aotus trivirgatus) Brain Res. 1974a;81:199–213. doi: 10.1016/0006-8993(74)90936-6. [DOI] [PubMed] [Google Scholar]
- Allman JM, Kaas JH. The organization of the second visual area (V II) in the owl monkey: a second order transformation of the visual hemifield. Brain Res. 1974b;76:247–265. doi: 10.1016/0006-8993(74)90458-2. [DOI] [PubMed] [Google Scholar]
- Allman JM, Kaas JH. The dorsomedial cortical visual area: a third tier area in the occipital lobe of the owl monkey (Aotus trivirgatus) Brain Res. 1975;100:473–487. doi: 10.1016/0006-8993(75)90153-5. [DOI] [PubMed] [Google Scholar]
- Allman JM, Kaas JH. Representation of the visual field on the medical wall of occipital-parietal cortex in the owl monkey. Science. 1976;191:572–575. doi: 10.1126/science.814619. [DOI] [PubMed] [Google Scholar]
- Allman JM, Kaas JH, Lane RH. The middle temporal visual area (MT) in the bushbaby, Galago senegalensis. Brain Res. 1973;57:197–202. doi: 10.1016/0006-8993(73)90576-3. [DOI] [PubMed] [Google Scholar]
- Baldauf Z. SMI-32 parcellates the visual cortical areas of the marmoset. Neurosci Lett. 2005;383:109–114. doi: 10.1016/j.neulet.2005.03.055. [DOI] [PubMed] [Google Scholar]
- Beck PD, Kaas JH. Cortical connections of the dorsomedial visual area in old world macaque monkeys. J Comp Neurol. 1999;406:487–502. [PubMed] [Google Scholar]
- Blasco B, Avendaño C, Cavada C. A stereological analysis of the lateral geniculate nucleus in adult Macaca nemestrina monkeys. Vis Neurosci. 1999;16:933–941. doi: 10.1017/s0952523899165131. [DOI] [PubMed] [Google Scholar]
- Boire D, Desgent S, Matteau I, Ptito M. Regional analysis of neurofilament protein immunoreactivity in the hamster’s cortex. J Chem Neuroanat. 2005;29:193–208. doi: 10.1016/j.jchemneu.2005.01.003. [DOI] [PubMed] [Google Scholar]
- Bourne JA, Rosa MG. Hierarchical development of the primate visual cortex, as revealed by neurofilament immunoreactivity: early maturation of the middle temporal area (MT) Cereb Cortex. 2006;16:405–414. doi: 10.1093/cercor/bhi119. [DOI] [PubMed] [Google Scholar]
- Brodal P. The corticopontine projection in the rhesus monkey. Brain. 1978;101:251–283. doi: 10.1093/brain/101.2.251. [DOI] [PubMed] [Google Scholar]
- Campbell MJ, Morrison JH. Monoclonal antibody to neurofilament protein (SMI-32) labels a subpopulation of pyramidal neurons in the human and monkey neocortex. J Comp Neurol. 1989;282:191–205. doi: 10.1002/cne.902820204. [DOI] [PubMed] [Google Scholar]
- Carmichael ST, Price JL. Architectonic subdivision of the orbital and prefrontal cortex in the macaque monkey. J Comp Neurol. 1994;346:366–402. doi: 10.1002/cne.903460305. [DOI] [PubMed] [Google Scholar]
- Catania KC, Lyon DC, Mock OB, Kaas JH. Cortical organization in shrews: evidence from five species. J Comp Neurol. 1999;410:55–72. [PubMed] [Google Scholar]
- Chaudhuri A, Zangenehpour S, Matsubara JA, Cynader MS. Differential expression of neurofilament protein in the visual system of the vervet monkey. Brain Res. 1996;709:17–26. doi: 10.1016/0006-8993(95)01217-6. [DOI] [PubMed] [Google Scholar]
- Cusick CG, Gould HJ, 3rd, Kaas JH. Interhemispheric connections of visual cortex of owl monkeys (Aotus trivirgatus), marmosets (Callithrix jacchus), and galagos (Galago crassicaudatus) J Comp Neurol. 1984;230:311–336. doi: 10.1002/cne.902300302. [DOI] [PubMed] [Google Scholar]
- Cusick CG, Kaas JH. Cortical connections of area 18 and dorsolateral visual cortex in squirrel monkeys. Vis Neurosci. 1988;1:211–237. doi: 10.1017/s0952523800001486. [DOI] [PubMed] [Google Scholar]
- Delson E. Fossil macaques, phyletic relationships and a scenario of deployment. In: Lindburg DG, editor. The Macaques: Studies in Ecology, Behavior, and Evolution. Amsterdam: Van Nostrand Reinhold; 1980. pp. 10–30. [Google Scholar]
- DeYoe EA, Hockfield S, Garren H, Van Essen DC. Antibody labeling of functional subdivisions in visual cortex: Cat-301 immunoreactivity in striate and extrastriate cortex of the macaque monkey. Vis Neurosci. 1990;5:67–81. doi: 10.1017/s0952523800000080. [DOI] [PubMed] [Google Scholar]
- DeYoe EA, Van Essen DC. Segregation of efferent connections and receptive field properties in visual area V2 of the macaque. Nature. 1985;317:58–61. doi: 10.1038/317058a0. [DOI] [PubMed] [Google Scholar]
- De Weerd P, Desimone R, Ungerleider LG. Impairments in spatial generalization of visual skills after V4 and TEO lesions in macaques (Macaca mulatta) Behav Neurosci. 2003;117:1441–1447. doi: 10.1037/0735-7044.117.6.1441. [DOI] [PubMed] [Google Scholar]
- Felleman DJ, Van Essen DC. Distributed hierarchical processing in the primate cerebral cortex. Cereb Cortex. 1991;1:1–47. doi: 10.1093/cercor/1.1.1-a. [DOI] [PubMed] [Google Scholar]
- Fiorani M, Gattass R, Rosa MG, Sousa AP. Visual area MT in the Cebus monkey: location, visuotopic organization, and variability. J Comp Neurol. 1989;287:98–118. doi: 10.1002/cne.902870108. [DOI] [PubMed] [Google Scholar]
- Fize D, Vanduffel W, Nelissen K, Denys K, Chef d'Hotel C, Faugeras O, Orban GA. The retinotopic organization of primate dorsal V4 and surrounding areas: A functional magnetic resonance imaging study in awake monkeys. J Neurosci. 2003;23:7395–7406. doi: 10.1523/JNEUROSCI.23-19-07395.2003. [DOI] [PMC free article] [PubMed] [Google Scholar]
- Fooden J. Provisional classifications and key to living species of macaques (primates: Macaca) Folia Primatol. 1976;25:225–236. doi: 10.1159/000155715. [DOI] [PubMed] [Google Scholar]
- Gattass R, Sousa AP, Gross CG. Visuotopic organization and extent of V3 and V4 of the macaque. J Neurosci. 1988;8:1831–1845. doi: 10.1523/JNEUROSCI.08-06-01831.1988. [DOI] [PMC free article] [PubMed] [Google Scholar]
- Glickstein M, May J, Mercier B. Visual corticopontine and tectopontine projections in the macaque. Arch Ital Biol. 1990;128:273–293. [PubMed] [Google Scholar]
- Glickstein M, May JG, 3rd, Mercier BE. Corticopontine projection in the macaque: the distribution of labelled cortical cells after large injections of horseradish peroxidase in the pontine nuclei. J Comp Neurol. 1985;235:343–359. doi: 10.1002/cne.902350306. [DOI] [PubMed] [Google Scholar]
- Groves P. Washington DC: Smithsonian Institution Press; 2001. Primate taxonomy. [Google Scholar]
- Hendry SH, Hockfield S, Jones EG, McKay R. Monoclonal antibody that identifies subsets of neurones in the central visual system of monkey and cat. Nature. 1984;307:267–269. doi: 10.1038/307267a0. [DOI] [PubMed] [Google Scholar]
- Hendry SH, Jones EG, Hockfield S, McKay RD. Neuronal populations stained with the monoclonal antibody Cat-301 in the mammalian cerebral cortex and thalamus. J Neurosci. 1988;8:518–542. doi: 10.1523/JNEUROSCI.08-02-00518.1988. [DOI] [PMC free article] [PubMed] [Google Scholar]
- Hof PR, Morrison JH. Neurofilament protein defines regional patterns of cortical organization in the macaque monkey visual system: a quantitative immunohistochemical analysis. J Comp Neurol. 1995;352:161–186. doi: 10.1002/cne.903520202. [DOI] [PubMed] [Google Scholar]
- Hof PR, Bogaert YE, Rosenthal RE, Fiskum G. Distribution of neuronal populations containing neurofilament protein and calcium-binding proteins in the canine neocortex: regional analysis and cell typology. J Chem Neuroanat. 1996;11:81–98. doi: 10.1016/0891-0618(96)00126-3. [DOI] [PubMed] [Google Scholar]
- Horton JC, Hubel DH. Regular patchy distribution of cytochrome oxidase staining in primary visual cortex of macaque monkey. Nature. 1981;292:762–764. doi: 10.1038/292762a0. [DOI] [PubMed] [Google Scholar]
- Hubel DH, Wiesel TN. Receptive fields and functional architecture of monkey striate cortex. J Physiol. 1968;195:215–243. doi: 10.1113/jphysiol.1968.sp008455. [DOI] [PMC free article] [PubMed] [Google Scholar]
- Janson CH. Evolutionary ecology of primate social structure. In: Smith EA, Winterhalder B, editors. Evolutionary Ecology and Human Behaviour. New York: Aldine; 1992. pp. 95–130. [Google Scholar]
- Kaas J. Theories of visual cortex organization in primates. In: Rockland KS, Kaas JH, Peters A, editors. Cerebral Cortex, vol 12, Visual Cortex. New York: Plenum; 1997. pp. 91–125. [Google Scholar]
- Kaas JH, Lyon DC. Visual cortex organization in primates: theories of V3 and adjoining visual areas. Prog Brain Res. 2001;134:285–295. doi: 10.1016/s0079-6123(01)34019-0. [DOI] [PubMed] [Google Scholar]
- Kaas JH, Morel A. Connections of visual areas of the upper temporal lobe of owl monkeys: the MT crescent and dorsal and ventral subdivisions of FST. J Neurosci. 1993;13:534–546. doi: 10.1523/JNEUROSCI.13-02-00534.1993. [DOI] [PMC free article] [PubMed] [Google Scholar]
- Kobayashi Y, Amaral DG. Macaque monkey retrosplenial cortex: I. Three-dimensional and cytoarchitectonic organization. J Comp Neurol. 2000;426:339–365. doi: 10.1002/1096-9861(20001023)426:3<339::aid-cne1>3.0.co;2-8. [DOI] [PubMed] [Google Scholar]
- Lee VMY, Otvos L, Carden MJ, Hollosi M, Dietzschold B, Lazzarini RA. Identification of the major multiphosphorylation site in mammalian neurofilaments. Proc Natl Acad Sci USA. 1988;85:1998–2002. doi: 10.1073/pnas.85.6.1998. [DOI] [PMC free article] [PubMed] [Google Scholar]
- Lewis JW, Van Essen DC. Mapping of architectonic subdivisions in the macaque monkey, with emphasis on parieto-occipital cortex. J Comp Neurol. 2000;428:79–111. doi: 10.1002/1096-9861(20001204)428:1<79::aid-cne7>3.0.co;2-q. [DOI] [PubMed] [Google Scholar]
- Livingstone MS, Hubel DH. Anatomy and physiology of a color system in the primate visual cortex. J Neurosci. 1984;4:309–356. doi: 10.1523/JNEUROSCI.04-01-00309.1984. [DOI] [PMC free article] [PubMed] [Google Scholar]
- Lund JS, Wu CQ. Local circuit neurons of macaque monkey striate cortex: IV. Neurons of laminae 1–3A. J Comp Neurol. 1997;384:109–126. doi: 10.1002/(sici)1096-9861(19970721)384:1<109::aid-cne7>3.0.co;2-5. [DOI] [PubMed] [Google Scholar]
- Lyon DC, Jain N, Kaas JH. Cortical connections of striate and extrastriate visual areas in tree shrews. J Comp Neurol. 1998;401:109–128. doi: 10.1002/(sici)1096-9861(19981109)401:1<109::aid-cne7>3.0.co;2-i. [DOI] [PubMed] [Google Scholar]
- Lyon DC, Kaas JH. Connectional and architectonic evidence for dorsal and ventral V3, and dorsomedial area in marmoset monkeys. J Neurosci. 2001;21:249–261. doi: 10.1523/JNEUROSCI.21-01-00249.2001. [DOI] [PMC free article] [PubMed] [Google Scholar]
- Maddison WP, Maddison DR. Mesquite: a modular system for evolutionary analysis. 2005 Version 1.06. http://mesquiteproject.org.
- Maguire WM, Baizer JS. Visuotopic organization of the prelunate gyrus in rhesus monkey. J Neurosci. 1984;4:1690–1704. doi: 10.1523/JNEUROSCI.04-07-01690.1984. [DOI] [PMC free article] [PubMed] [Google Scholar]
- Morales JC, Melnick DJ. Phylogenetic relationships of the macaques (Cercopithecidae: Macaca), as revealed by high resolution restriction site mapping of mitochondrial ribosomal genes. J Hum Evol. 1998;34:1–23. doi: 10.1006/jhev.1997.0171. [DOI] [PubMed] [Google Scholar]
- Nimchinsky EA, Hof PR, Young WG, Morrison JH. Neurochemical, morphological, and laminar characterization of cortical projection neurons in the cingulate motor areas of the macaque monkey. J Comp Neurol. 1996;374:136–160. doi: 10.1002/(SICI)1096-9861(19961007)374:1<136::AID-CNE10>3.0.CO;2-S. [DOI] [PubMed] [Google Scholar]
- Nimchinsky EA, Vogt BA, Morrison JH, Hof PR. Neurofilament and calcium-binding proteins in the human cingulate cortex. J Comp Neurol. 1997;384:597–620. doi: 10.1002/(sici)1096-9861(19970811)384:4<597::aid-cne8>3.0.co;2-y. [DOI] [PubMed] [Google Scholar]
- Olavarria JF, DeYoe EA, Knierim JJ, Fox JM, van Essen DC. Neural responses to visual texture patterns in middle temporal area of the macaque monkey. J Neurophysiol. 1992;68:164–181. doi: 10.1152/jn.1992.68.1.164. [DOI] [PubMed] [Google Scholar]
- Paxinos G, Huang XF, Toga AW. San Diego: Academic Press; 2000. The rhesus monkey brain in stereotaxic coordinates. [Google Scholar]
- Piñon MC, Gattass R, Sousa AP. Area V4 in Cebus monkey: extent and visuotopic organization. Cereb Cortex. 1998;8:685–701. doi: 10.1093/cercor/8.8.685. [DOI] [PubMed] [Google Scholar]
- Preuss TM, Beck PD, Kaas JH. Areal, modular, and connectional organization of visual cortex in a prosimian primate, the slow loris (Nycticebus coucang) Brain Behav Evol. 1993;42:321–335. doi: 10.1159/000114169. [DOI] [PubMed] [Google Scholar]
- Raaum RL, Sterner KN, Noviello CM, Stewart CB, Disotell TR. Catarrhine primate divergence dates estimated from complete mitochondrial genomes: concordance with fossil and nuclear DNA evidence. J Hum Evol. 2005;48:237–257. doi: 10.1016/j.jhevol.2004.11.007. [DOI] [PubMed] [Google Scholar]
- Rosa M. Visuotopic organization of primate extrastriate cortex. In: Rockland K, Kaas JH, Peters A, editors. Cerebral Cortex, vol 12, Visual Cortex. New York: Plenum; 1997. pp. 127–203. [Google Scholar]
- Rosa MG, Tweedale R. Visual areas in lateral and ventral extrastriate cortices of the marmoset monkey. J Comp Neurol. 2000;422:621–651. doi: 10.1002/1096-9861(20000710)422:4<621::aid-cne10>3.0.co;2-e. [DOI] [PubMed] [Google Scholar]
- Rosa MG, Tweedale R. The dorsomedial visual areas in New World and Old World monkeys: homology and function. Eur J Neurosci. 2001;13:421–427. doi: 10.1046/j.0953-816x.2000.01414.x. [DOI] [PubMed] [Google Scholar]
- Rosa MG, Tweedale R. Brain maps, great and small: lessons from comparative studies of primate visual cortical organization. Philos Trans R Soc Lond Ser B. 2005;360:665–691. doi: 10.1098/rstb.2005.1626. [DOI] [PMC free article] [PubMed] [Google Scholar]
- Sereno MI, Tootell RB. From monkeys to humans: what do we now know about brain homologies. Curr Opin Neurobiol. 2005;15:135–144. doi: 10.1016/j.conb.2005.03.014. [DOI] [PubMed] [Google Scholar]
- Seyfarth RM, Cheney DL, Marler P. Monkey responses to three different alarm calls: evidence of predator classification and semantic communication. Science. 1980;210:801–803. doi: 10.1126/science.7433999. [DOI] [PubMed] [Google Scholar]
- Sherwood CC, Lee PWH, Rivara CB, Holloway RL, Gilissen EPE, Simmons RMT, Hakeem A, Allman JM, Erwin JM, Hof PR. Evolution of specialized pyramidal neurons in primate visual and motor cortex. Brain Behav Evol. 2003;61:28–44. doi: 10.1159/000068879. [DOI] [PubMed] [Google Scholar]
- Shu S, Ju G, Fan L. The glucose oxidase-DAB-nickel method in peroxidase histochemistry of the nervous system. Neurosci Lett. 1988;84:169–171. doi: 10.1016/0304-3940(88)90346-1. [DOI] [PubMed] [Google Scholar]
- Stepniewska I, Collins CE, Kaas JH. Reappraisal of DL/V4 boundaries based on connectivity patterns of dorsolateral visual cortex in macaques. Cereb Cortex. 2005;15:809–822. doi: 10.1093/cercor/bhh182. [DOI] [PubMed] [Google Scholar]
- Stepniewska I, Kaas JH. Topographic patterns of V2 cortical connections in macaque monkeys. J Comp Neurol. 1996;371:129–152. doi: 10.1002/(SICI)1096-9861(19960715)371:1<129::AID-CNE8>3.0.CO;2-5. [DOI] [PubMed] [Google Scholar]
- Sternberger LA, Sternberger NH. Monoclonal antibodies distinguish phosphorylated and nonphosphorylated forms of neurofilaments in situ. Proc Natl Acad Sci USA. 1983;80:6126–6130. doi: 10.1073/pnas.80.19.6126. [DOI] [PMC free article] [PubMed] [Google Scholar]
- Stewart CB, Disotell TR. Primate evolution - in and out of Africa. Curr Biol. 1998;8:R582–R588. doi: 10.1016/s0960-9822(07)00367-3. [DOI] [PubMed] [Google Scholar]
- Symonds LL, Kaas JH. Connections of striate cortex in the prosimian, Galago senegalensis. J Comp Neurol. 1978;181:477–512. doi: 10.1002/cne.901810304. [DOI] [PubMed] [Google Scholar]
- Takeuchi Y, Sano Y. Immunohistochemical demonstration of serotonin nerve fibers in the neocortex of the monkey (Macaca fuscata) Anat Embryol. 1983;166:155–168. doi: 10.1007/BF00305080. [DOI] [PubMed] [Google Scholar]
- Tosi AJ, Disotell TR, Morales JC, Melnick DJ. Cercopithecine Y–chromosome data provide a test of competing morphological evolutionary hypotheses. Mol Phylogenet Evol. 2003;27:510–521. doi: 10.1016/s1055-7903(03)00024-1. [DOI] [PubMed] [Google Scholar]
- Ungerleider LG, Desimone R. Cortical connections of visual area MT in the macaque. J Comp Neurol. 1986a;248:190–222. doi: 10.1002/cne.902480204. [DOI] [PubMed] [Google Scholar]
- Ungerleider LG, Desimone R. Projections to the superior temporal sulcus from the central and peripheral field representations of V1 and V2. J Comp Neurol. 1986b;248:147–163. doi: 10.1002/cne.902480202. [DOI] [PubMed] [Google Scholar]
- Van der Gucht E, Vandesande F, Arckens L. Neurofilament protein: a selective marker for the architectonic parcellation of the visual cortex in adult cat brain. J Comp Neurol. 2001;441:345–368. doi: 10.1002/cne.1416. [DOI] [PubMed] [Google Scholar]
- Van der Gucht E, Burnat K, Arckens L. Program No. 300.7, Abstract Viewer/Itinerary Planner. Washington, DC: Society for Neuroscience; 2004. Characteristic expression of neurofilament protein defines six cortical areas and several subcortical divisions in mouse visual system. [Google Scholar]
- Van Essen DC. A tension-based theory of morphogenesis and compact wiring in the central nervous system. Nature. 1997;385:313–318. doi: 10.1038/385313a0. [DOI] [PubMed] [Google Scholar]
- Van Essen DC, Felleman DJ, DeYoe EA, Olavarria J, Knierim J. Modular and hierarchical organization of extrastriate visual cortex in the macaque monkey. Cold Spring Harb Symp Quant Biol. 1990;55:679–696. doi: 10.1101/sqb.1990.055.01.064. [DOI] [PubMed] [Google Scholar]
- Van Essen DC, Newsome WT, Maunsell JH, Bixby JL. The projections from striate cortex (V1) to areas V2 and V3 in the macaque monkey: asymmetries, areal boundaries, and patchy connections. J Comp Neurol. 1986;244:451–480. doi: 10.1002/cne.902440405. [DOI] [PubMed] [Google Scholar]
- Van Schaik CP, van Noordwijk MA, Warsono B, Sutriono E. Party size and early detection of predators in Sumatran forest primates. Primates. 1983;24:211–221. [Google Scholar]
- Vogt BA, Vogt LJ, Perl DP, Hof PR. Cytoarchitecture of human caudomedial cingulate, retrosplenial, and caudal parahippocampal cortices. J Comp Neurol. 2001;438:353–376. doi: 10.1002/cne.1320. [DOI] [PubMed] [Google Scholar]
- Von Bonin G, Bailey P. Urbana: Universtiy of Illinois Press; 1947. The neocortex of Macaca mulatta. [Google Scholar]
- Wall JT, Symonds LL, Kaas JH. Cortical and subcortical projections of the middle temporal area (MT) and adjacent cortex in galagos. J Comp Neurol. 1982;211:193–214. doi: 10.1002/cne.902110208. [DOI] [PubMed] [Google Scholar]
- Welker W. Why does cerebral cortex fissure and fold? A review of determinants of gyri and sulci. In: Jones EG, Peters A, editors. Cerebral Cortex, vol. 8B, Comparative Structure and Evolution of Cerebral Cortex. New York: Part II. Plenum; 1990. pp. 3–136. [Google Scholar]
- Welker WI, Seidenstein S. Somatic sensory representation in the cerebral cortex of the racoon (Procyon lotor) J Comp Neurol. 1959;111:469–501. doi: 10.1002/cne.901110306. [DOI] [PubMed] [Google Scholar]
- Youakim M, Bender DB, Baizer JS. Vertical meridian representation on the prelunate gyrus in area V4 of macaque. Brain Res Bull. 2001;56:93–100. doi: 10.1016/s0361-9230(01)00608-6. [DOI] [PubMed] [Google Scholar]
- Zeki SM. Cortical projections from two prestriate areas in the monkey. Brain Res. 1971;34:19–35. doi: 10.1016/0006-8993(71)90348-9. [DOI] [PubMed] [Google Scholar]
- Zeki SM. The cortical projections of foveal striate cortex in the rhesus monkey. J Physiol. 1978;277:227–244. doi: 10.1113/jphysiol.1978.sp012270. [DOI] [PMC free article] [PubMed] [Google Scholar]
- Zhang YP, Shi LM. Phylogenetic relationships of macaques as inferred from restriction endonuclease analysis of mitochondrial DNA. Folia Primatol. 1993;60:7–17. doi: 10.1159/000156671. [DOI] [PubMed] [Google Scholar]