

Abstract
Multiple reaction monitoring mass spectrometry (MRM-MS) is a targeted analysis method that has been increasingly viewed as an avenue to explore proteomes with unprecedented sensitivity and throughput. We have developed a software tool, called MaRiMba, to automate the creation of explicitly defined MRM transition lists required to program triple quadrupole mass spectrometers in such analyses. MaRiMba creates MRM transition lists from downloaded or custom-built spectral libraries, restricts output to specified proteins or peptides, and filters based on precursor peptide and product ion properties. MaRiMba can also create MRM lists containing corresponding transitions for isotopically heavy peptides, for which the precursor and product ions are adjusted according to user specifications. This open-source application is operated through a graphical user interface incorporated into the Trans-Proteomic Pipeline, and it outputs the final MRM list to a text file for upload to MS instruments. To illustrate the use of MaRiMba, we used the tool to design and execute an MRM-MS experiment in which we targeted the proteins of a well-defined and previously published standard mixture.
Keywords: multiple reaction monitoring (MRM), selective reaction monitoring (SRM), MRM transition, transition list, spectral library, mass spectrometry, targeted proteomics
Introduction
Multiple reaction monitoring (MRM) is a targeted method of mass spectrometry (MS) that can be used for the detection and quantification of specific molecules in a complex mixture. Because of its high sensitivity and capacity for high-throughput screening, MRM-MS is seen as an increasingly useful method for biomarker verification, especially due to the financial and time constraints that limit traditional validation by immunoassay.1 MRM-MS has already been proven as a successful method for targeting various types of analytes, including small molecules in the pharmaceutical industry,2–4 drug metabolites in the clinical setting,5,6 and phosphopeptides.7 Recent applications in proteomics have measured concentrations of various analytes in complex mixtures such as human serum with limits of detection reported in the nanogram per milliliter (ng/mL) or subnanogram per milliliter (subng/mL) range.8,9
As a type of tandem mass spectrometry (MS/MS), MRM-MS employs tandem quadrupoles, typically using an electrospray ionization-coupled triple quadrupole mass spectrometer, to select for specified transitions from precursor to product ions. More specifically, a given precursor peptide ion is selected, based on its mass-to-charge ratio (m/z), by the first mass filter, Q1, and fragmented by collision-induced dissociation in Q2. The resulting fragments, or product ions, are then transferred through the second mass filter, Q3, which selectively detects one or several fragment ions at specified mass-to-charge ratios. Because of the high selectivity of MRM-MS and the long dwell time afforded by the nonscanning nature of the method, it is capable of considerable sensitivity and multiplexing; new instrument operation software incorporating scheduling algorithms are capable of performing experiments with in excess of 1000 transitions.9,10
The paired mass filters of the tandem quadrupoles are programmed by inputting a list of precursor-product transitions for targeting. These lists are typically created via manual evaluation of CID spectra for input into a spreadsheet, making the process tedious and time-consuming, especially when the investigator desires to customize the list to meet specific experimental criteria. To address this inefficiency, we sought to develop a software tool for creating targeted MRM transition lists, tailored to the user’s experimental needs, directly from a collection of acquired MS/MS spectra. We specified that the program allow (1) MRM list creation based on spectral libraries, either created by the user or derived from large databases, such as the NIST or PeptideAtlas spectral libraries; (2) inclusion of only user-defined proteins or peptides; (3) the ability to choose precursor peptides and/or product ions based on user-defined input parameters, such as isoelectric point (pI) or charge state; (4) exclusion of peptides assigned to more than one protein in the given proteome; (5) calculation of a theoretical retention time for each peptide in order to facilitate scheduling; and (6) addition of transitions corresponding to heavy peptides to allow for isotopic labeling strategies. We have achieved these goals in an application called MaRiMba, which is built based on extensions to the spectral library program SpectraST.11,12 We have incorporated this software into the Trans-Proteomic Pipeline (TPP),13 which is available for free download at http://tools.proteomecenter.org/wiki/index.php?title=Software:TPP-MaRiMba.
Although MaRiMba is not the first software solution to the problem of MRM list creation, it is distinct from existing tools, even those released most recently. For example, TIQAM14 (released in early 2008) generates potential transitions in silico and requires an intermediate MRM-MS experiment to determine which are suitable for MRM. MaRiMba, on the other hand, employs an algorithmic scoring system to choose transitions with characteristics that are generally amenable to MRM, thus, maximizing the usefulness of the MRM list, even prior to validation. Additionally, MRMaid15 (released in late 2008) also uses an algorithmic approach to determine suitable candidates, but only provides MRM transitions for a single protein at a time, requiring the output from multiple executions of the program to be concatenated together to achieve a multiprotein transition list. In contrast, MaRiMba can accommodate any number of proteins in a single execution and single transition list which provides much more information about each of the targeted peptides. Finally, both TIQAM and MRMaid rely upon the mining of data repositories (PeptideAtlas in the case of TIQAM and GAPP in the case of MRMaid) for the selection of putative targets, while only MaRiMba can generate MRM lists from either public spectral libraries or spectral libraries created directly from the user’s own data.
Materials and Methods
MaRiMba Software. Overview
MaRiMba is a Perl application with a graphical user interface (GUI) integrated into the TPP software suite,13 which is fully compatible with the Windows operating system. The functionality of MaRiMba is largely based on a C++ program called SpectraST (also available through the TPP; see refs 11 and 12), which was created for the primary purposes of searching and creating libraries of peptide spectra previously obtained from MS/MS experiments. MaRiMba employs only a subset of the capabilities of SpectraST, but contains additional features added to produce a tool dedicated solely to the creation of MRM transition lists.
The main MaRiMba GUI, pictured in Figure 1, presents the user with options for MRM transition list creation and customization. These options and the underlying functionality of MaRiMba can be divided into 10 categories: (1) selecting a spectral library on which to base the MRM list, (2) remapping the spectral library to a user-provided protein database, (3) restricting the spectral library to user-specified proteins or peptides of interest, (4) selecting the precursor peptide and product ion properties required for the transition list, (5) processing the spectral library using SpectraST, (6) building a putative MRM transition list from the processed spectral library, (7) filtering the MRM list based on the user-defined peptide and product ion properties, (8) calculating a theoretical retention time for each peptide, (9) optionally incorporating transitions corresponding to heavy peptides introduced by isotopic labeling strategies, and (10) outputting the MRM list to a text file convenient for use. Of these functions, four of the first six are performed using calls to SpectraST, while all others are achieved through scripts unique to MaRiMba. Each of the functions is described below.
Figure 1.
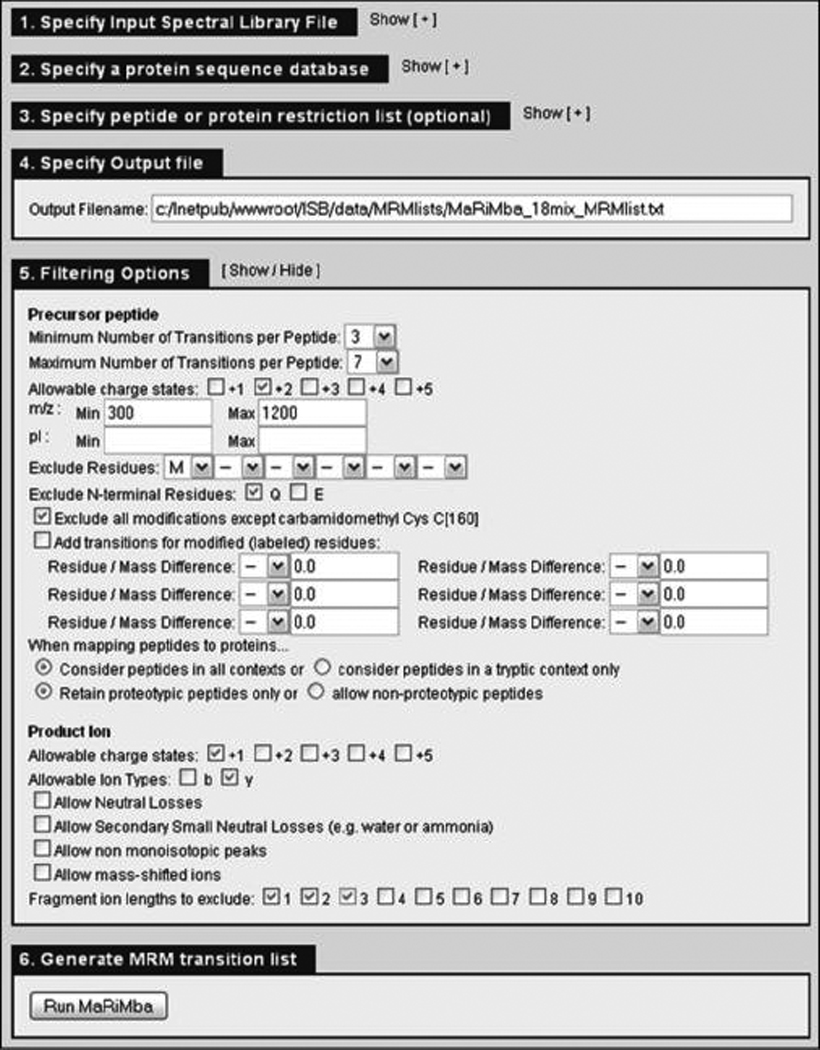
Main MaRiMba GUI. The first three input sections have been hidden for ease of viewing; when visible, these sections each allow the user to browse to the desired files. The pictured input parameters represent those used in the MRM-MS experiment in which we targeted the proteins of the ISB standard mixture.
Selection of a Base Spectral Library
MaRiMba first requires the user to choose the spectral library on which to base the MRM list. This is done by browsing to the library of interest, which can be any downloaded or custom-built spectral library in the .splib format. If the former is desired, the user can download comprehensive spectral libraries from PeptideAtlas, which distributes SpectraST-compatible libraries for common NIST databases (http://www.peptideatlas.org/speclib/). If the latter is preferred, the user can create a spectral library from his/her own shotgun-MS data using SpectraST (see refs 11 and 12), which is available in the TPP software suite within which MaRiMba is packaged. SpectraST can also be used to create a .splib spectral library from a NIST (.msp)-formatted library, which the user can then use as input to MaRiMba. It is important to note that most spectral libraries are built from spectra obtained from ion trap mass spectrometers, not the triple quadrupole instruments used to perform MRM experiments. While the agreement between fragmentation patterns from these two instruments is not certain, initial examination reveals that the most intense y-ion transitions for a given peptide are generally conserved between spectra from the two mass spectrometers (manuscript under review).
Refreshing the Spectral Library Protein Mappings
The second required user input is a protein database corresponding to the organism(s) included in the spectral library. This database represents the entity against which both protein identifiers and peptide-protein uniqueness are determined. Specifically, MaRiMba calls SpectraST to remap all library entries to the proteins in this database using a Commentz-Walter keyword searching algorithm, creating a new “refreshed” spectral library with this mapping information. By default, all unmapped peptides are removed from the spectral library. MaRiMba also allows the user to decide how the mapping is performed in two aspects. First, the user must choose if peptides should be considered in a tryptic context only or in all contexts. For example, if a peptide appears in one protein in a tryptic manner and another protein in a nontryptic manner, the peptide will be mapped to only the first protein if tryptic context is required, while it will be mapped to both proteins if all contexts are considered. Second, the user must choose whether to retain only proteotypic peptides (i.e., peptides that map to exactly one protein) or to allow nonproteotypic peptides as well. Proteotypic peptides are generally preferable for MRM, since they unequivocally indicate the presence of their originating proteins. The option to allow nonproteotypic peptides is included because, in some cases, peptides that are considered multimapped by MaRiMba may still be useful. For example, a peptide that occurs in more than one separately listed protein isoform will be considered multimapped and will be filtered out, unless the user chooses to allow nonproteotypic peptides.
Restriction to User-Specified Proteins or Peptides
MaRiMba affords the user the option of providing a text file of proteins (in the form of protein identifiers) or peptides (in the form of sequences) to which the MRM list should be restricted, a task that is executed by SpectraST. This option allows the user to effectively query a spectral library based on a biological feature by providing a list of proteins or peptides known to correspond to that feature. Such lists can be easily obtained by querying online protein databases. An example of such a query for ribosomal yeast proteins and the resulting MaRiMba-generated transition list is given in Supplemental File 1.
Selection of Transition Properties
Once the source files of the MRM transition list have been designated, the user chooses the filtering options to be applied to the list. These options are selected in the GUI via various input types, including radio buttons, text boxes, and drop-down menus. While not exhaustive, these options, listed in Table 1, include all criteria that we anticipate to be commonly needed by the user. The filtering capabilities of MaRiMba can be augmented when needs from the proteomics community become better defined. The current version of MaRiMba, however, allows the typical user to customize MRM lists in a fast and fully automated fashion.
Table 1.
Filtering Options Available in MaRiMba
| Precursor Peptide Options |
| pI range |
| m/z range |
| Charge state |
| Minimum transitions per peptide |
| Maximum transitions per peptide |
| Disallowable amino acids |
| Exclude N-terminal Q and/or E |
| Exclude modifications except C160 [y/n] |
| Retain proteotypic peptides only [y/n] |
| Product Ion Options |
| Ion type [y and/or b] |
| Charge state |
| Product ion lengths to exclude |
| Allow neutral loss peaks [y/n] |
| Allow small secondary neutral losses [y/n] |
| Allow nonmonoisotopic peaks [y/n] |
| Allow mass-shifted ions [y/n] |
Library Processing via SpectraST
MaRiMba calls upon SpectraST to perform the front-end spectral library processes necessary for subsequent MRM list creation. Specifically, SpectraST is used to create a consensus spectral library from the remapped and possibly protein- or peptide-restricted input library and to subsequently apply a quality filter to remove misidentified or low-quality spectra. MaRiMba then utilizes the filtering options available in SpectraST to perform a cursory filtering of the spectral library. In particular, this functionality is used to automatically limit the spectral library-and therefore the ensuing MRM list–to peptides that contain two tryptic termini and no missed cleavages. In addition, the user-defined specifications of a precursor m/z range and of any disallowable amino acids (e.g., methionine) are carried out in this step.
Library-Based MRM List Creation
MaRiMba creates an initial list of potential MRM transitions using calls to SpectraST’s MRM list creation function, which uses an algorithmic scoring system to rank, in order of quality, the potential transitions for each consensus spectrum in the library. This scoring system, defined in Table 2, awards points to transitions that possess qualities that are amenable to MRM analysis. SpectraST then reduces each spectrum to the top user-specified number of transitions, which are used to populate the MRM list.
Table 2.
The Scoring System Used to Select Transitions from a Spectral Library To Create an MRM List
| criterion | score |
|---|---|
| Not a nonmonoisotopic or slight mass-shifted ion | +100 000 000 |
| Not a precursor or nonbackbone loss | +10 000 000 |
| product m/z not within 5 m/z units of precursor m/z | |
| Transition is in top 20 most intense OR | +1 000 000 |
| intensity is at least 20% of base intensity | |
| Not a neutral loss | +100 000 |
| Is a y-ion | +10 000 |
| Not due to a cleavage less than 3 amino acids from a terminus | +1000 |
| Heavier than precursor m/z by at least 20 m/z units | +100 |
| Observed in more than the minimum number of replicate spectra | +10 |
| Intensity does not vary among reps by more than 20% | +1 |
The scoring system utilized by MaRiMba via SpectraST was developed based on empirical and theoretical knowledge of MS/MS spectra and MRM targeting. The algorithm consists of nine criteria that are each separated by a log difference in score, which effectively ranks the transitions in order of their suitability for MRM. These nine criteria and their justifications for selection are described below.
Not a nonmonoisotopic or slight mass-shifted ion (+100 000 000). In MRM, it is best to target only one isotopic state of a fragment ion in order to utilize the instrument scan time efficiently, so this criterion is used to strictly exclude nonmonoisotopic states from consideration. Similarly, mass-shifted ions make undesirable targets, as they are peaks that are close in m/z to the monoisotopic fragment, but do not match exactly at the expected higher isotopic states due to centroiding artifacts. Again, to ensure the same fragment ion is not targeted more than once, these peaks are highly selected against.
Not a precursor or nonbackbone loss and product m/z not within 5 m/z units of precursor m/z (+10 000 000). Both the precursor ion itself and neutral losses (e.g., p-H2O) from the precursor are uninformative ions that frequently appear in spectra with high intensity; if they are not filtered out at this early stage by a strong penalty, they will likely be selected by the algorithm based on their intensities. Similarly, a spectrum is typically busy near the precursor m/z, due to noise and other coeluting peptides, making this region undesirable for targeting.
Transition is in top 20 most intense or intensity is at least 20% of base intensity (+1 000 000). This is a generally well-accepted criterion for transition selection, as intense peaks are always desirable (provided they are informative, hence the first two criteria). By using a dual criterion, one based on peak rank and one based on the intensity, we accommodate fragmentation patterns of different intensity profiles. For instance, if the spectrum has a dominant peak, then the peak rank criterion will be more suitable; if the fragment intensity distribution is more homogeneous, then it is sensible to admit any sufficiently intense peaks, rather than insisting on only the top 20 fragments.
Not a neutral loss (+100 000) Similar to the first criterion, it is not desirable to target the same backbone fragment point twice (e.g., y6 and y6–18, a neutral loss of 18 Da from y6). However, neutral loss peaks are not penalized as heavily as nonmonoisotopic peaks, because the neutral loss does sometimes carry information about the peptide. For instance, in some cases, one might observe a significant neutral loss fragment that is more intense than the intact b-type or y-type fragment itself. This often suggests a special underlying chemistry of the peptide and therefore could be quite discriminating.
Is a y-ion (+10 000). This criterion is based on the observation that b-type ions are usually less prominent in triple quadrupole spectra than in ion trap spectra, while y-type ions are better conserved across platforms. This is likely due to the differing peptide fragmentation mechanisms employed by the two instruments. In the case of the triple quadrupole, the collisional excitation used for fragmentation causes facile bx → bx−1 fragmentation that reduces b-ion signal compared to that of an ion trap, while y-ions are stabilized through proton sequestration by the carboxy terminal basic residue side chains.16,17 We are therefore inclined to discount b-ions and select for the more stable y-ions, even if the b-ions are intense in the ion trap spectra.
Not due to a cleavage less than 3 amino acids from a terminus (+1000). With this criterion, we prioritize our candidates by selecting against ions that result from cleavages close to the termini due to the lack of specificity of such fragments to a single peptide. For example, the y1 ion is exactly at (p-K) or (p-R) for tryptic peptides, which means the peak will appear in all spectra for precursors with the same basic residue on the C-terminus. Even the y2 ion is not a very useful target, because the second-to-last amino acid can only be 1 of 20 possibilities. This criterion therefore selects for targets that will be more discriminating.
Heavier than precursor m/z by at least 20 m/z units (+100). This criterion represents a minor consideration based on the observation that a mass spectrum is usually less noisy above the precursor m/z value. Transitions here are less likely to be confounded by nonspecific fragments occurring at the same m/z by coincidence, making them more desirable targets for MRM.
Observed in more than the minimum number of replicate spectra (+10). This criterion selects for transitions that were more widely observed across the spectral replicates used to generate the consensus library spectrum. Specifically, transitions are rewarded if observed in over 90% of the replicate spectra.
Intensity does not vary among reps by more than 20% (+1). This last criterion enhances for peaks that do not vary in intensity across spectral replicates, as variation could be indicative of irreproducibility. The intensity variation is recorded in the consensus spectrum when the multiple replicates are averaged.
These nine scoring criteria represent our current understanding of MRM target selection. While not applicable to all MRM experiments, this scoring system is intended to select the highest-quality transitions for the types of MRM experiments that are currently typical in the proteomics field.
Filtration Based on Precursor Peptide and Product Ion Properties
The preliminary MRM list is subjected to a MaRiMba-specific script that implements the majority of the filtering options (all but those already accomplished by SpectraST), as defined by user-specified input criteria. These options, which are listed in full in Table 1, include the exclusion of N-terminal glutamine and/or glutamic acid, which can form pyroglutamic acid; the exclusion of neutral loss peaks and small secondary neutral losses, such as water and ammonia; and the exclusion of mass-shifted peaks, which are close to, but do not match exactly, a given neighboring fragment.
Calculation of Theoretical Retention Time
MaRiMba calculates a predicted retention time for each peptide that can be used to schedule transitions in a time-segmented MRM run. This is achieved by employing algorithm 3.0 of the Sequence Specific Retention Calculator (SSRCalculator),18–21 which predicts the retention time of a given peptide based on its hydrophobicity, a parameter that is determined by the amino acid content of the peptide. This generic value is typically adjusted for the specific local system using a linear regression determined by a set of standard peptides.
Incorporation of Isotopic Modifications
MaRiMba provides the user the option of adding transitions to the MRM list that have been modified to account for m/z changes that would be expected in an experiment employing an isotopic labeling strategy such as SILAC.22 If this option is enabled, the user selects each residue and/or terminus to be modified, followed by the mass that is to be added to the given residue. MaRiMba will automatically adjust the m/z values for every precursor-product pair based on this user input and will add these transitions to the MRM list, such that the final output will contain two variations, one heavy and one light, of each transition. This output allows the experimenter to program a triple quadrupole instrument for simultaneous screening of heavy and light peptides in a single analysis, despite the fact that the heavy peptides may not appear in a spectral library. MaRiMba also maintains an indexing system that assigns each heavy-light transition pair a unique number and designates each transition as heavy or light. This indexing system matches the input requirements of the MRM analysis tool MRMer,10 allowing for easy quantitative analysis of heavy-to-light ratios.
Output
The output from MaRiMba is an MRM transition list in the format of a tab-delimited text file that contains only the precursor-product transitions meeting all of the user-defined criteria, with each row representing a single transition (Table 3). The number of columns included in the output depends on whether the option to incorporate isotopic modifications is selected. If the option is not enabled, the MaRiMba-generated MRM list contains 18 columns of information for each precursor-product transition: protein identifier(s), number of protein mappings, precursor peptide sequence (including modifications), stripped precursor peptide sequence (excluding modifications), intensity, precursor peptide (Q1) m/z, product ion (Q3) m/z, predicted retention time, product ion (fragment) type, N-terminal residue of the amide bond broken to produce the product ion, C-terminal residue of the amide bond broken to produce the product ion, precursor peptide charge state (Q1 Z), product ion charge state (Q3 Z), theoretical pI (as calculated by SpectraST), greatest number of spectrum replicates taken from a single MS analysis in the designated library when building the consensus library, total number of spectrum replicates used when building the consensus library (up to 100), the full transition annotation (which contains all possible corresponding fragments), and a URL for a Webpage that illustrates the location of the peptide in the sequence of each mapped protein. If the isotopic modification option is enabled, the MaRiMba output contains two additional columns to facilitate the execution of experiments incorporating isotopic labeling. These columns are (1) modification, which reads either “H” or “L” for heavy or light, respectively; and (2) modification index, which contains the unique index number for each heavy-light transition pair. An example of such an output file is provided in Supplemental Table 1.
Table 3.
Example MaRiMba Output (a.txt file), When the Isotopic Labeling Option Is Not Selecteda
| protein | num prots |
mod_peptide | peptide_seq | intensity | Q1 m/z | Q3 m/z | SSR calc RT | fragme nt type |
N- term AA |
C- term AA |
Q1 Z | Q3 Z | pI | single sample max reps |
total num reps |
all fragments |
peptide URL |
|---|---|---|---|---|---|---|---|---|---|---|---|---|---|---|---|---|---|
| P46406 | 1 | VGVNGFGR | VGVNGFGR | 4058 | 403.22 | 436.23 | 16.25 | y4 | N | G | 2 | 1 | 9.71 | 5 | 32 | y4/0.04 | http://… |
| P46406 | 1 | VGVNGFGR | VGVNGFGR | 10000 | 403.22 | 550.27 | 16.25 | y5 | V | N | 2 | 1 | 9.71 | 5 | 32 | y5/1.00 | http://… |
| P46406 | 1 | VGVNGFGR | VGVNGFGR | 3089 | 403.22 | 649.34 | 16.25 | y6 | G | V | 2 | 1 | 9.71 | 5 | 32 | y6/0.98, b7 + 18/0.99 |
http://… |
| P46406 | 1 | VGVNGFGR | VGVNGFGR | 2367 | 403.22 | 706.37 | 16.25 | y7 | V | G | 2 | 1 | 9.71 | 5 | 32 | y7/0.97 | http://… |
| P62739 | 1 | AGFAGDDAPR | AGFAGDDAPR | 1563 | 488.73 | 458.24 | 14.07 | y4 | D | D | 2 | 1 | 4.20 | 3 | 18 | y4/0.03 | http://… |
| P62739 | 1 | AGFAGDDAPR | AGFAGDDAPR | 1743 | 488.73 | 573.26 | 14.07 | y5 | G | D | 2 | 1 | 4.20 | 3 | 18 | y5/0.06 | http://… |
| P62739 | 1 | AGFAGDDAPR | AGFAGDDAPR | 10000 | 488.73 | 630.28 | 14.07 | y6 | A | G | 2 | 1 | 4.20 | 3 | 18 | y6/0.03 | http://… |
| P62739 | 1 | AGFAGDDAPR | AGFAGDDAPR | 4485 | 488.73 | 701.33 | 14.07 | y7 | F | A | 2 | 1 | 4.20 | 3 | 18 | y7/−0.02 | http://… |
| P62739 | 1 | AGFAGDDAPR | AGFAGDDAPR | 302 | 488.73 | 848.39 | 14.07 | y8 | G | F | 2 | 1 | 4.20 | 3 | 18 | y8/−0.07 | http://… |
| P00722 | 1 | LSGQTIEVTSEYLFR | LSGQTIEVTSEYLFR | 2847 | 871.95 | 598.33 | 34.34 | y4 | E | Y | 2 | 1 | 4.53 | 3 | 21 | y4/0.02 | http://… |
| P00722 | 1 | LSGQTIEVTSEYLFR | LSGQTIEVTSEYLFR | 3610 | 871.95 | 814.41 | 34.34 | y6 | T | S | 2 | 1 | 4.53 | 3 | 21 | y6/−0.02 | http://… |
| P00722 | 1 | LSGQTIEVTSEYLFR | LSGQTIEVTSEYLFR | 7339 | 871.95 | 915.46 | 34.34 | y7 | V | T | 2 | 1 | 4.53 | 3 | 21 | y7/−0.01 | http://… |
| P00722 | 1 | LSGQTIEVTSEYLFR | LSGQTIEVTSEYLFR | 3831 | 871.95 | 1014.53 | 34.34 | y8 | E | V | 2 | 1 | 4.53 | 3 | 21 | y8/−0.02 | http://… |
| P00722 | 1 | LSGQTIEVTSEYLFR | LSGQTIEVTSEYLFR | 10000 | 871.95 | 1143.57 | 34.34 | y9 | I | E | 2 | 1 | 4.53 | 3 | 21 | y9/−0.06 | http://… |
| P00722 | 1 | LSGQTIEVTSEYLFR | LSGQTIEVTSEYLFR | 2285 | 871.95 | 1256.65 | 34.34 | y10 | T | I | 2 | 1 | 4.53 | 3 | 21 | y10/−0.06 | http://… |
| P00722 | 1 | LSGQTIEVTSEYLFR | LSGQTIEVTSEYLFR | 1771 | 871.95 | 1357.70 | 34.34 | y11 | Q | T | 2 | 1 | 4.53 | 3 | 21 | y11/−0.10 | http://… |
The column headers have been modified slightly for sizing purposes. The full MaRiMba-generated MRM list from which this excerpt was taken, and the list used for the standard protein analysis, is provided in Supplemental Table 3.
Although most MS instruments require only three of the output columns (precursor peptide m/z, product ion m/z, and retention time), all 18 (or 20) are retained by MaRiMba to provide users with the option of further managing the transitions in spreadsheet-format. Using this MaRiMba output file to program an MRM-MS experiment is as simple as copying the required columns into the vendor-specific method building software for the triple quadrupole being used.
MaRiMba Implementation for Pilot Analysis of ISB Standard Protein Mixture. 18 Mix Sample Preparation
A mixture of 18 proteins (Supplemental Table 2) was prepared as described.23 Briefly, 1 nmol of each protein was dissolved in 20 mM, pH 8.0, ammonium bicarbonate with 0.05% SDS added to a final concentration of 1 µM, reduced with 2.5 mM TCEP at 50 °C for 30 min, and alkylated for 1 h with 10 mM iodoacetamide. The proteins were then digested by overnight incubation at 37 °C with sequencing-grade trypsin (Promega, Madison, WI) at a 1:40 (w/w) ratio. Samples were dried in a Speed Vac and cleaned up using a Waters (Milford, MA) Oasis MCX cartridge per the manufacturer’s instruction. The final eluate was evaporated and resuspended in 1 mL of 0.1% formic acid, 1% acetonitrile (ACN), in HPLC-grade water (VWR, West Chester, PA).
Mouse Lung Lysate Preparation
A pathogen-free male BALB-C mouse was used in this experiment, which was performed in accordance with IACUC-approved protocols. Before death, mice were anesthetized by an ip injection of Avertin followed by cervical dislocation. Lung was harvested in its entirety, snap frozen in liquid nitrogen, and stored at −80°C. Lung tissue was homogenized using a Biospec Products Mini-Beadbeater-16 (Bartlesville, OK) according to the manufacturer’s protocol. Lung was suspended in denaturing buffer containing 8 M urea, 400 mM ammonium bicarbonate, and 0.1% SDS. Lysate was reduced, alkylated, and digested to peptides as described above. Following evaporative centrifugation, samples were cleaned using an MCX cartridge as described above. Shotgun proteomic analysis was performed using a Thermo Scientific LTQ as described.23
Spectral Library Creation
A published and publicly available MS/MS data set for the ISB standard protein mixture23 (Mix 7, acquired by a Thermo Scientific LTQ Orbitrap mass spectrometer) was searched using SEQUEST (version 27) against a database containing the 18 standard proteins of interest and known contaminating proteins appended to a Hemophilus influenza decoy database (parameters file and database available upon request). The resulting peptide identifications were assigned probabilities using PeptideProphet.13 All spectra for peptides with probability ≥0.9 were included in the creation of a consensus spectral library for the peptides of the ISB standard protein mixture using SpectraST. This spectral library is available upon request.
MRMList Creation with MaRiMba
The above spectral library was entered as an input to MaRiMba, along with a protein database containing the 18 protein sequences of interest to be used for the peptide-protein remapping. For the mapping, peptides were considered in all contexts, and only proteotypic peptides were retained in the MRM list. The third and optional MaRiMba input, a list of peptides or proteins to which the MRM list should be restricted, was not utilized in this experiment, as we did not wish to focus our set of protein targets any further.
Using MaRiMba, we filtered the MRM list to retain only precursor peptides and product ions compatible with our sample preparation and proteomics workflow. The constraints applied to the precursor peptides were the following: no methionine (M), no N-terminal glutamine (Q), no modifications except for carbamidomethyl cysteine, an m/z between 300 and 1200, and a charge state of 2+. As discussed previously, MaRiMba also automatically retains only peptides with two tryptic termini and no missed cleavages. The constraints applied to the product ions were the following: y-ions only, a charge state of 1+, a length of at least four amino acids, no neutral losses, no small secondary neutral losses, no nonmonoisotopic peaks, and no mass-shifted peaks. A maximum number of 7 transitions per precursor peptide was also specified to ensure enough transitions would remain after filtering to allow for successful peptide identification, while still maintaining the list at a manageable size. Since MRM-based peptide identification hinges on the observation of coeluting transitions, a minimum number of 3 transitions per peptide was required to avoid false peptide identification. The option of incorporating transitions for isotopically labeled peptides was not used for this experiment. An excerpt of the final MRM transition list and thus an example of MaRiMba output is given in Table 3, while the full list, containing 577 transitions from 114 peptides and 15 proteins, is provided in Supplemental Table 3. Three of the 18 proteins were not included in the target list because they did not contain any peptides that both met our input criteria (e.g., no methionine, etc.) and had observed transitions in the spectral library on which the transition list was based.
Mass Spectrometry
Three columns of the MaRiMba output file, precursor m/z, product m/z, and retention time, were used as input for a script (provided by Waters) to upload instruction parameters into a Waters Quattro Premier triple quadrupole mass spectrometer. In addition to these input parameters, columns for cone voltage (CV) and collision energy (CE) were also uploaded, with CV constant at 36 V and CE calculated as CE = 0.034 · (m/zprecursor) + 1.314. MaRiMba does not contain automatic CV and CE calculators because both parameters are instrument-dependent, while MaRiMba is designed to be platform-independent.
Data were acquired on a Waters Quattro Premier triple quadrupole coupled with a Waters nanoAcquity UltraPerformance LC (UPLC) pump fitted with a Waters Symmetry 5 µm particle diameter C18 180 µm × 20 mm trap column and a 1.7 µm particle BEH130 C18 100 µm × 100 mm analytical column. After loading and washing for 5 min with 0.1% formic acid (buffer A), peptides were eluted using a linear gradient of 1–35% 0.1% formic acid, 100% I (buffer B) over 30 min at a flow rate of 300 nL/ min. For the MRM experiment, the MS instrument was operated in the positive ion mode. MS source conditions were evaluated for best response under positive mode nanoESI conditions by infusing a standard solution on a regular basis. MS source parameters were as follows: capillary voltage, 2.9 kV; cone voltage, 36 V; source temperature, 90 °C; cone gas flow rate, 40 L/h at 4 psi. Nitrogen (99.998% purity, Airgas, Seattle, WA) and argon (99.999% purity, Airgas, Seattle, WA) were used as cone and collision gases, respectively.
The transitions (see Supplemental Table 3) were split into two MS runs (one with 277 targets and the other with 300 targets), each of which was time-segmented by expected retention time to facilitate scheduling. This retention time was calculated from a linear regression based on the relationship between the SSRCalc values and observed retention times for a set of standard peptides. A total of 32 time segments, the maximum number allowed by the instrument software, were used in order to minimize the number of transitions being targeted at any given time and thereby maximize the number of data points acquired over each transition elution curve. Each time segment contained 8–10 transitions and used a retention window of ±1 min. This window size (2 min total) was chosen to accommodate the elution peak of any given peptide (typically ~30 s) and provide some cushion to allow for slight drift in chromatography. With this particular transition list and these scheduling parameters, each time segment covered approximately 6 min of the 30-min gradient, or 20%. The dwell time for each transition was 10 ms with a 5-ms interscan delay, a 5-ms interchannel delay, and a scan width of 0 Da. A total of 2.0 µL was loaded for the analysis, corresponding to approximately 1 µg of protein. Data acquisition was carried out by Masslynx V4.1 software.
Data Analysis
The raw data files were converted to the mzXML format using Wolf-MRM (http://tools.proteomecenter.org/software/wolf-mrm/wolf-mrm.zip) and evaluated using the MRM analysis software MRMer10 (http://proteomics.fhcrc.org/CPL/MRMer.html). Specifically, this program was used to visualize and calculate the area-under-the-curve (AUC) of each elution curve of the targeted transitions and to evaluate their presence or absence in the analysis. A transition was considered to be observed when its elution curve was distinct from background noise, a decision made both objectively by AUC value and subjectively by visualization. The presence of a peptide was then confirmed by the observation of the full elution peaks of three or more coeluting transitions corresponding to that peptide, as this was the minimum number of transitions targeted per peptide. Since all targeted peptides were proteotypic, a protein was considered to be present in the sample by the observation of at least one corresponding peptide.
Results and Discussion
We sought to demonstrate the utility of MaRiMba by performing a targeted analysis of a defined protein mixture. MaRiMba was instructed to generate an MRM transition list for the 18 proteins of the ISB standard protein mix (see Supplemental Table 2) using a spectral library created from our own published and publicly available data. MaRiMba reduced the MRM list to proteotypic, doubly charged, tryptic peptides that were unmodified (except for carbamidomethyl cysteine), without methionine or N-terminal glutamine, and had an m/z between 300 and 1200. Product ions were specified to be only singly charged y-type ions having a length of at least four amino acids; all neutral losses, nonmonoisotopic peaks, and mass-shifted peaks were excluded. A minimum number of 3 transitions per peptide was required to avoid false peptide identification. A portion of this MRM list is shown in Table 3, and the full list is included in Supplemental Table 3. Using this list and the methods described above, we detected 522 of 577 targeted transitions (90.5%), corresponding to 103 of 114 targeted peptides (90.4%) and 15 of 15 targeted proteins (100%). These results are summarized in Figure 2. The instrument data files, which can be viewed in MRMer, are available upon request in native or mzXML format. As an example of the results, the MRMer plot of the detected transitions for precursor peptide APGLTQALNTK (charge state 2+) from the Escherichia coli protein alkaline phosphatase is provided in Figure 3. We followed up with a subsequent analysis targeting only the 11 missed peptides, 10 of which were not seen at all and 1 of which had an elution peak that was cut off by the time segment border, using an expanded list of precursor-product pairs and no transition scheduling. In this analysis, we identified 6 of the 11 peptides missed in the initial analysis when predicted retention times fell outside or at the edge of our specified window (data not shown). The other five targeted peptides were not seen in either analysis. With these two analyses combined, we identified a total of 547 transitions (94.8%), 109 peptides (95.6%), and 15 proteins (100%).
Figure 2.
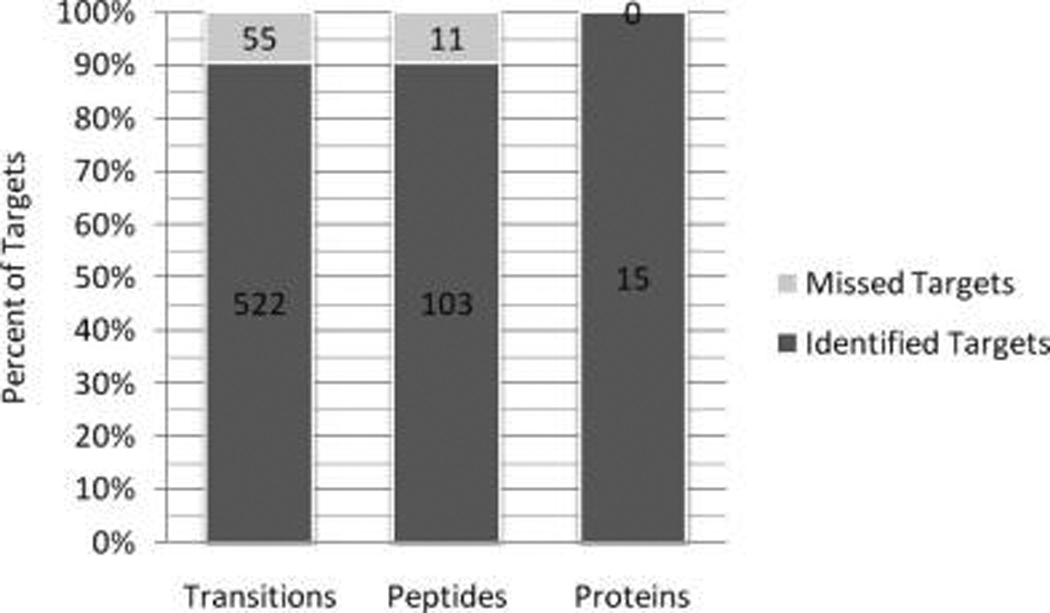
Results of the pilot MRM analysis of the ISB standard protein mixture. MaRiMba was used to generate the list of MRM transitions targeted in the analysis, which contained a total of 577 transitions, corresponding to 114 peptides from 15 proteins.
Figure 3.
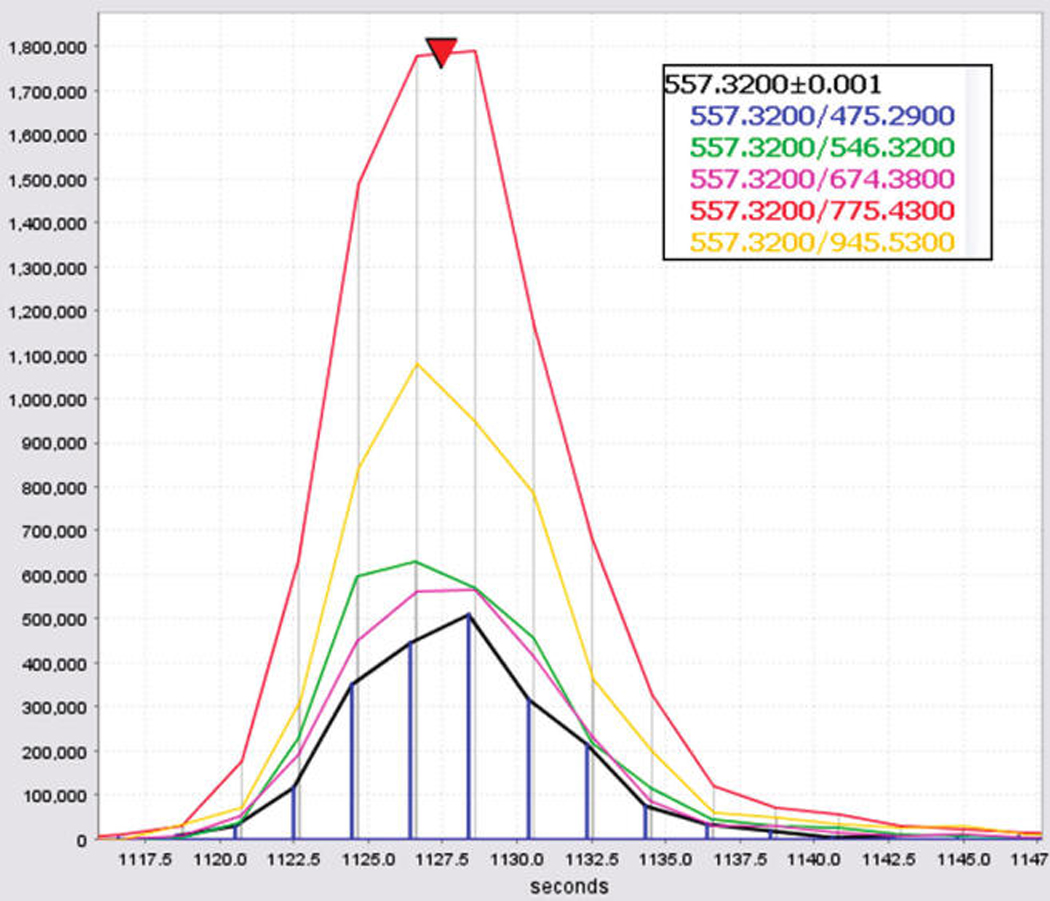
Plot generated in MRMer containing the intensity-versus-retention time curves for all detected transitions corresponding to the peptide APGLTQALNTK, charge state 2+ (m/z 557.32), from the E. coli protein alkaline phosphatase. For this peptide, all five targeted transitions were detected, allowing for a confident identification of the peptide.
To ensure that the MaRiMba-generated transitions were still informative in a complex background, we performed a supplemental experiment in which we targeted the same list of transitions in a sample containing or standard proteins mix spiked into a mouse lung lysate at the same concentration used above. This lung lysate yielded 1384 high probability (p > 0.9) peptide identifications in an independent shotgun MS analysis (Thermo LTQ), confirming that the sample was indeed complex. Following the experimental procedure as above, we identified a total of 526 transitions (91.2%), 104 peptides (91.2%), and 15 proteins (100%). These target rates are very close to those achieved in the null background, validating the usefulness of MaRiMba for biologically relevant experiments in complex samples.
The results achieved in our analysis illustrate the high target rates attainable in even a pilot MRM analysis without extensive instrument or experimental optimization and without intermediate validation of the targeted transitions. These results verify the capability of MaRiMba to generate lists of MRM transitions that are indeed targetable and thereby confirm its ability to serve as an effective tool for MRM transition list assembly. Furthermore, if the user desires a fully validated transition list, he/she can simply remove the missed targets from the initial analysis and use the remaining targets (e.g., the 522 confirmed transitions here) to program a final experiment. Although such a validation step is not necessary for all experiments, as demonstrated here, it would be beneficial for any quantitative analysis in order to maximize the instrument scan time available for the informative transitions.
Although high target rates were achieved in this analysis, the targets that were not identified provide further insight regarding the capabilities and limitations of MaRiMba. The most striking observation is that the 55 transitions that were missed in the analysis all corresponded to the same 11 peptides. In other words, the misses did not correspond to individual transitions from random peptides, but instead to all transitions from only a few peptides. This suggests that the transitions chosen by MaRiMba are effective and implies that the problem instead lies with the peptides themselves. This problem can likely be attributed to one of three possible causes: (1) the peptides were missed due to inaccurate chromatographic scheduling (which was the case for six of our original misses), (2) the peptides were incompatible with triple quadrupole analysis due to poor fragmentation, or (3) the peptides were poorly ionized on our triple quadrupole or ionized to a charge state other than 2+. Since both chromatographic scheduling and instrument compatibility depend on the physical and chemical properties of the peptide, the root of the issue in both cases is that some peptides behave atypically due to these unique properties.
To produce MRM target lists with even higher success rates therefore requires the prediction of which peptides will elute, ionize, and fragment in a reproducible manner, a problem that is currently under investigation. For example, a recently released algorithm by Fusaro et al. begins to tackle this challenge by predicting the probability with which a given peptide will respond to electrospray ionization with an intense MS1 signal.24 Once full peptide prediction guidelines have been established by the proteomics community, such rules could be incorporated into MaRiMba to enhance its assay development capabilities. For now, however, MaRiMba is intended as a transition list assembly tool only, and could actually aid investigators in the peptide prediction problem due to its ability to rapidly generate transition lists tailored to specific peptide criteria.
As for the issue of retention time prediction, we included SSRCalculator (SSRCalc) values in the MaRiMba output since estimated retention times are crucial for performing scheduled MRM experiments at a high level of throughput. We chose the SSRCalc algorithm in particular because of its general acceptance and widespread use in the proteomics field. Furthermore, as shown above, SSRCalc values can easily be adjusted for specific local operation using linear regression. A graphical description of the correlation between our corrected theoretical retention times and the observed retention times is provided in the Supplemental Figure 1. As shown in this plot, we observed reasonably good correlation, with a slope close to 1 and an R2 value of 0.92. Since we did not perform a rigorous analysis to optimize the relationship, however, it is likely that the retention time prediction for our chromatography system could be improved upon with larger data sets and more sophisticated modeling. While the method of correcting SSRCalc values for one’s local system should be generalizable, the exact regression used will depend on the given resins and LC system, and can even vary over time. Each user is advised to devise his/her own correction routine.
Finally, the transition scoring system employed by MaRiMba represents our initial attempt to incorporate theoretically and empirically derived criteria into the transition selection process and is validated experimentally by the standard protein mixture analysis described here. We recognize, however, that these criteria may not be optimal for all circumstances. Given the infancy of this approach, it will likely take some time before a consensus regarding transition selection rules can be reached in the community. While a systematic, experimental, and multidimensional optimization of all involved parameters would be ideal, it is a substantial undertaking in terms of both time and resources that would only delay the release of MaRiMba to the community. Given the open-source nature of the software, the user is empowered and encouraged to modify these criteria as he/she sees fit. To do so simply requires the C++-literate user to download the SpectraST source code (see http://tools.proteomecenter.org/wiki/index.php?title=Software:TPP), edit the well-documented SpectraSTPeakList::reduce function as desired, and recompile. We reiterate, however, that the present transition scoring system represents our current knowledge of MRM targeting and is effective for typical MRM experiments.
On its own, MaRiMba represents a useful tool for creating targeted MRM lists, as the user can select for proteins or peptides of interest from database spectral libraries and filter lists based on precursor peptide and product ion properties. The utility of MaRiMba is enhanced, however, by the use of SpectraST to create additional spectral libraries on which to base the MRM lists. The combined use of SpectraST and MaRiMba constitutes a powerful means for experimental design, as three distinct paradigms can be adopted. First, an investigator can use SpectraST to build his/her own spectral library from searched shotgun-MS data. This allows the user to generate a custom library containing exclusively the spectra required to meet the needs of an experiment. Second, the investigator can use SpectraST to supplement existing database spectral libraries with his/her own experimental data, thereby enhancing the effectiveness of the libraries. Lastly, the investigator can simply use one of the comprehensive downloadable libraries, such as those from NIST, and forego shotgun proteomic analysis altogether, permitting the user to dramatically expedite the experiment. With any of these three paradigms, the user can further mold the experiment using the protein/peptide selection, peptide/ion filtering, and isotopic modification options in MaRiMba.
The flexibility of MaRiMba will allow the expansion of the field of systems biology. With this powerful tool, the user can devise targeted experiments to broadly interrogate biological pathways, follow proteins present in cellular compartments, or examine peptides from a single protein. The large spectral libraries available allow immediate use for any of these experimental designs. In addition, for an experimenter focusing on a collection of purified proteins, a brief set of shotgun analyses could quickly generate expanded protein coverage of the protein set of interest. The addition of these peptides to one’s “personal” library could then substantially enhance the ability to follow this subproteome in subsequent targeted analyses.
Conclusion
We have developed a software application, MaRiMba, to enhance and streamline the process of creating targeted MRM transition lists, a task that, until now, has been lengthy and cumbersome. To our knowledge, MaRiMba is the first publicly available tool dedicated to MRM list creation from any spectral library, be it database-derived or custom-built from the user’s own data. Although the utility of MaRiMba is extensive, we have demonstrated its successful application to a particular MRM-MS experiment, in which we targeted proteins of a standard mixture, to verify the functionality and illustrate the use of MaRiMba.
MaRiMba was designed to provide users with the ability to fully customize MRM lists to meet their experimental needs, while still retaining ease and automation of the process. The current version of MaRiMba meets this goal almost completely, as it includes all MRM list creation and filtering options that we expect the typical user to need, as well as those for which we anticipate a desire from the proteomics community in the near future. Further capabilities can easily be added to later versions of MaRiMba to meet the developing demand from the field. The only known constraint in MaRiMba preventing it from being entirely generalized is its assumption of trypsin as the enzyme of protein digestion. Since the large majority of proteomics experiments are conducted using trypsin, however, this limitation should not affect most users.
MaRiMba affords users the ability to design more specific MRM transition lists and with greater speed than ever before. MaRiMba therefore has the ability to dramatically enhance and expedite the workflow of MRM-MS experiments and expand the ability of proteomics to contribute to systems biology. This will not only benefit the field of proteomics in general, but will also serve as a step toward a more efficient biomarker discovery pipeline.
Supplementary Material
Acknowledgment
This work has been funded by the NIH grants R21 CA126216 and P50 GM076547/Center for Systems Biology (to D.B.M) and in part with federal funds from the National Heart, Lung, and Blood Institute, National Institutes of Health, under contract number N01-HV-28179 (to R.A.).
Footnotes
Supporting Information Available: Supplemental Table 1, example output from MaRiMba when the option to include transitions for isotopically labeled peptides is enabled; Supplemental Table 2, list of the 18 proteins constituting the ISB standard protein mixture; Supplemental Table 3, the full MRM transition list created in MaRiMba and used to target the standard proteins; Supplemental Figure 1, a plot of our observed peptide retention times versus their corresponding corrected theoretical values; and Supplemental File 1, an example query of the UniProt online database for yeast ribosomal proteins and the resulting MaRiMba-generated MRM transition list. This material is available free of charge via the Internet at http://pubs.acs.org.
References
- 1.Anderson L, Hunter CL. Quantitative mass spectrometric multiple reaction monitoring assays for major plasma proteins. Mol. Cell. Proteomics. 2006;5(4):573–588. doi: 10.1074/mcp.M500331-MCP200. [DOI] [PubMed] [Google Scholar]
- 2.Kostiainen R, Kotiaho T, Kuuranne T, Auriola S. Liquid chromatography/atmospheric pressure ionization-mass spectrometry in drug metabolism studies. J. Mass Spectrom. 2003;38(4):357–372. doi: 10.1002/jms.481. [DOI] [PubMed] [Google Scholar]
- 3.Sannino A, Bolzoni L, Bandini M. Application of liquid chromatography with electrospray tandem mass spectrometry to the determination of a new generation of pesticides in processed fruits and vegetables. J. Chromatogr., A. 2004;1036(2):161–169. doi: 10.1016/j.chroma.2004.02.078. [DOI] [PubMed] [Google Scholar]
- 4.Tai SS, Bunk DM, White Et, Welch MJ. Development and evaluation of a reference measurement procedure for the determination of total 3,3′,5-triiodothyronine in human serum using isotope-dilution liquid chromatography-tandem mass spectrometry. Anal. Chem. 2004;76(17):5092–5096. doi: 10.1021/ac049516h. [DOI] [PubMed] [Google Scholar]
- 5.Lee MS, Kerns EH. LC/MS applications in drug development. Mass Spectrom. Rev. 1999;18(3–4):187–279. doi: 10.1002/(SICI)1098-2787(1999)18:3/4<187::AID-MAS2>3.0.CO;2-K. [DOI] [PubMed] [Google Scholar]
- 6.Tiller PR, Cunniff J, Land AP, Schwartz J, Jardine I, Wakefield M, Lopez L, Newton JF, Burton RD, Folk BM, Buhrman DL, Price P, Wu D. Drug quantitation on a benchtop liquid chromatography-tandem mass spectrometry system. J. Chromatogr., A. 1997;771(1–2):119–125. doi: 10.1016/s0021-9673(97)00147-7. [DOI] [PubMed] [Google Scholar]
- 7.Wolf-Yadlin A, Hautaniemi S, Lauffenburger DA, White FM. Multiple reaction monitoring for robust quantitative proteomic analysis of cellular signaling networks. Proc. Natl. Acad. Sci. U.S.A. 2007;104(14):5860–5865. doi: 10.1073/pnas.0608638104. [DOI] [PMC free article] [PubMed] [Google Scholar]
- 8.Keshishian H, Addona T, Burgess M, Kuhn E, Carr SA. Quantitative, multiplexed assays for low abundance proteins in plasma by targeted mass spectrometry and stable isotope dilution. Mol. Cell. Proteomics. 2007;6(12):2212–2229. doi: 10.1074/mcp.M700354-MCP200. [DOI] [PMC free article] [PubMed] [Google Scholar]
- 9.Stahl-Zeng J, Lange V, Ossola R, Eckhardt K, Krek W, Aebersold R, Domon B. High sensitivity detection of plasma proteins by multiple reaction monitoring of N-glycosites. Mol. Cell. Proteomics. 2007;6(10):1809–1817. doi: 10.1074/mcp.M700132-MCP200. [DOI] [PubMed] [Google Scholar]
- 10.Martin DB, Holzman T, May D, Peterson A, Eastham A, Eng J, McIntosh M. MRMer: An interactive open-source and cross-platform system for data extraction and visualization of multiple reaction monitoring experiments. Mol. Cell. Proteomics. 2008;7(11):2270–2278. doi: 10.1074/mcp.M700504-MCP200. [DOI] [PMC free article] [PubMed] [Google Scholar]
- 11.Lam H, Deutsch EW, Eddes JS, Eng JK, King N, Stein SE, Aebersold R. Development and validation of a spectral library searching method for peptide identification from MS/MS. Proteomics. 2007;7(5):655–667. doi: 10.1002/pmic.200600625. [DOI] [PubMed] [Google Scholar]
- 12.Lam H, Deutsch EW, Eddes JS, Eng JK, Stein SE, Aebersold R. Building consensus spectral libraries for peptide identification in proteomics. Nat Methods. 2008;5(10):873–875. doi: 10.1038/nmeth.1254. [DOI] [PMC free article] [PubMed] [Google Scholar]
- 13.Keller A, Eng J, Zhang N, Li XJ, Aebersold R. A uniform proteomics MS/MS analysis platform utilizing open XML file formats. Mol. Syst. Biol. 2005;1:2005. doi: 10.1038/msb4100024. 0017. [DOI] [PMC free article] [PubMed] [Google Scholar]
- 14.Lange V, Malmstrom JA, Didion J, King NL, Johansson BP, Schafer J, Rameseder J, Wong CH, Deutsch EW, Brusniak MY, Buhlmann P, Bjorck L, Domon B, Aebersold R. Targeted quantitative analysis of Streptococcus pyogenes virulence factors by multiple reaction monitoring. Mol. Cell. Proteomics. 2008;7(8):1489–1500. doi: 10.1074/mcp.M800032-MCP200. [DOI] [PMC free article] [PubMed] [Google Scholar]
- 15.Mead JA, Bianco L, Ottone V, Barton C, Kay RG, Lilley KS, Bond NJ, Bessant C. MRMaid: the web-based tool for designing multiple reaction monitoring (MRM) transitions. Mol. Cell. Proteomics. 2009;8(4):696–705. doi: 10.1074/mcp.M800192-MCP200. [DOI] [PMC free article] [PubMed] [Google Scholar]
- 16.Paizs B, Suhai S. Fragmentation pathways of protonated peptides. Mass Spectrom. Rev. 2005;24(4):508–548. doi: 10.1002/mas.20024. [DOI] [PubMed] [Google Scholar]
- 17.Vachet RW, Ray KL, Glish GL. Origin of product ions in the MS/MS spectra of peptides in a quadrupole ion trap. J. Am. Soc. Mass Spectrom. 1998;9(4):341–434. doi: 10.1016/S1044-0305(98)00008-7. [DOI] [PubMed] [Google Scholar]
- 18.Krokhin OV, Craig R, Spicer V, Ens W, Standing KG, Beavis RC, Wilkins JA. An improved model for prediction of retention times of tryptic peptides in ion pair reversed-phase HPLC: its application to protein peptide mapping by off-line HPLC-MALDI MS. Mol. Cell. Proteomics. 2004;3(9):908–919. doi: 10.1074/mcp.M400031-MCP200. [DOI] [PubMed] [Google Scholar]
- 19.Krokhin OV. Sequence-specific retention calculator. Algorithm for peptide retention prediction in ion-pair RP-HPLC: application to 300- and 100-Å pore size C18 sorbents. Anal. Chem. 2006;78(22):7785–7795. doi: 10.1021/ac060777w. [DOI] [PubMed] [Google Scholar]
- 20.Krokhin OV, Ying S, Cortens JP, Ghosh D, Spicer V, Ens W, Standing KG, Beavis RC, Wilkins JA. Use of peptide retention time prediction for protein identification by off-line reversed-phase HPLC-MALDI MS/MS. Anal. Chem. 2006;78(17):6265–6269. doi: 10.1021/ac060251b. [DOI] [PubMed] [Google Scholar]
- 21.Spicer V, Yamchuk A, Cortens J, Sousa S, Ens W, Standing KG, Wilkins JA, Krokhin OV. Sequence-specific retention calculator. A family of peptide retention time prediction algorithms in reversed-phase HPLC: applicability to various chromatographic conditions and columns. Anal. Chem. 2007;79(22):8762–8768. doi: 10.1021/ac071474k. [DOI] [PubMed] [Google Scholar]
- 22.Horth P, Miller CA, Preckel T, Wenz C. Efficient fractionation and improved protein identification by peptide OFFGEL electrophoresis. Mol. Cell. Proteomics. 2006;5(10):1968–1974. doi: 10.1074/mcp.T600037-MCP200. [DOI] [PubMed] [Google Scholar]
- 23.Klimek J, Eddes JS, Hohmann L, Jackson J, Peterson A, Letarte S, Gafken PR, Katz JE, Mallick P, Lee H, Schmidt A, Ossola R, Eng JK, Aebersold R, Martin DB. The standard protein mix database: a diverse data set to assist in the production of improved Peptide and protein identification software tools. J. Proteome Res. 2008;7(1):96–103. doi: 10.1021/pr070244j. [DOI] [PMC free article] [PubMed] [Google Scholar]
- 24.Fusaro VA, Mani DR, Mesirov JP, Carr SA. Prediction of high-responding peptides for targeted protein assays by mass spectrometry. Nat. Biotechnol. 2009;27(2):190–198. doi: 10.1038/nbt.1524. [DOI] [PMC free article] [PubMed] [Google Scholar]
Associated Data
This section collects any data citations, data availability statements, or supplementary materials included in this article.