Abstract
The nuclear receptors encompass a group of regulatory proteins involved in a number of physiological processes. The estrogen receptors (ERs), of which one alpha and one beta form exist in mammals function as transcription factors in response to 17β-estradiol (E2). In zebrafish there are three gene products of estrogen receptors and they are denoted esr1 (ERalpha), esr2a (ERbeta2) and esr2b (ERbeta1). Total RNA of zebrafish early life stages (<3, 6, 12, 24, 48, 72, 96 and 120 hours post fertilization) and of adult fish (liver, intestine, eye, heart, brain, ovary, testis, gill, swim bladder and kidney) were isolated following in vivo exposures. Using specific primers for each of the three zebrafish ERs the expression levels were quantified using real time PCR methodology. It was shown that in absence of exposure all three estrogen receptors were expressed in adult fish. The levels of expression of two of these three ER genes, the esr1 and esr2a were altered in organs such as liver, intestine, brain and testis in response to ligand (E2, diethylstilbestrol or 4-nonylphenol). During embryogenesis two of the three receptor genes, esr1 and esr2b were expressed, and in presence of ligand the mRNA levels of these two genes increased. The conclusions are i) estrogen receptor genes are expressed during early development ii) altered expression of esr genes in response to ligand is dependent on the cellular context; iii) the estrogenic ligand 4-nonylphenol, a manufactured compound commonly found in sewage of water treatment plants, acts as an agonist of the estrogen receptor during development and has both agonist and antagonist properties in tissues of adult fish. This knowledge of esr gene function in development and in adult life will help to understand mechanisms of interfering mimicking endocrine chemicals in vivo.
Introduction
The cDNAs coding for the alpha and beta forms of the receptor proteins that bind to 17β-estradiol (E2) were isolated and cloned in the 1980ies and in the 1990ies [1]–[5]. ERalpha and ERbeta belong to the large family of nuclear receptors and they function as transcription factors following binding to their ligands [6]. The diverse cellular functions of the two receptors have been characterized in cell lines and with mouse ER knock out technology [7]–[10]. The sequence conservation between the human ERs and the corresponding receptors in other species is high, in particular within the domains of DNA binding (DBD) and ligand binding (LBD).
In contrast to mammalian species many of the fish species harbor three estrogen receptor genes, one alpha and two beta types [11], [12]. In zebrafish these receptor genes are designated esr1 (ERalpha), esr2b (ERbeta1) and esr2a (ERbeta2) and it has been shown that the ligand 17β-estradiol binds to all three receptors with similar affinities as to the corresponding mammalian receptors [13], [14]. These ERs also have capacity to bind a large number of synthetic ligands [13], [15] with affinities similar to that of the natural ligand or for some ligands a thousand fold less than that for 17β-estradiol. Some synthetic estrogens have been detected in river waters [16] and at least one of these ligands, the nonylphenol (4-NP) is frequently found in sewage of water treatment plants [17] of the industrial world.
In an aim to evaluate ER expression and regulation in the zebrafish system we used E2 and two synthetic ligands, diethylstilbestrol (DES) and 4-NP to establish a model in which we determined the levels of receptors in absence of ligand or following exposure to these ligands. The zebrafish ERalpha gene autoregulates itself in liver after exposure to hormone [18] and we therefore wanted to delineate the expression of esr1, and the two beta subtypes of the estrogen receptor genes as possible targets of estrogenic ligands. This was done in embryos, in early larvae and in organs of adult zebrafish. To compare possible variations of the expression levels in organs of adult fish, RNAs of individual sibling fish were isolated and tested.
We show that the onset of esr1, esr2b and esr2a expression differs during embryogenesis. During development two out of three ERs, the esr1 and the esr2b are well expressed while esr2a represents high levels before, and low levels beyond midblastula transition (MBT). In adult fish all three ERs are expressed in the organs tested except for the very low levels detected in ovaries. The effects on ER expression as a result from exposures of natural or synthetic ligands are discussed.
Materials and Methods
Ethics statement
All experiments are pursued according to the national guidelines and have been approved of by the local ethical committee Stockholms södra djurförsöksetiska nämnd (S-200-06 and S-1-10).
Zebrafish maintenance
Adult zebrafish were maintained in 15 L aquaria at 28°C (Schwartz) supplied continuously with reverse osmosis water under 14 h of light and 10 h of dark cycle. Zebrafish embryos were raised, maintained and staged as previously described by Kimmel et al [19]. Staging of embryos is denoted as hours post fertilization (hpf).
Embryos and tissues
Tissues from untreated adult males and females (Tűbingen strain, 12 to 18 months old) including brain, eye, gill, heart, liver, intestine, swim bladder, kidney, testis and ovary were dissected out and pooled by tissue type for RNA extraction. All tissues were stored at −80°C for subsequent RNA extraction. Embryos (untreated) were collected after spawning and allowed to develop in a Petri dish at 28°C. Embryos of different stages (<3, 6, 12, 24, 48, 72, 96 and 120 hpf) were collected, quickly frozen on dry ice and stored at −80°C until analyzed.
17β-estradiol (E2), 4-nonylphenol (4-NP) and diethylstilbestrol (DES) were purchased from Sigma. A 1 mM stock solution of E2, DES or 4-NP in 100% ethanol was diluted in embryo medium (5 mM NaCl, 0.17 mM KCl, 0.33 mM CaCl2, 0.33 mM MgSO4) to obtain 1 µM and 100 nM concentrations of E2, 4-NP and DES. Three to five adult fish (female and male) were exposed to 1 µM of ligand or vehicle (0.1% ethanol) for 48 h. After exposures, tissues were collected from individual organs, quickly frozen on dry ice and stored at −80°C. A clutch of zebrafish embryos, usually 200–300 embryos from a single pair of adult fish was divided and transferred into two Petri dishes, one containing the ligand and the other containing control embryos. Embryos were exposed to E2 (100 nM and 1 µM), DES (100 nM) or 4-NP (1 µM). Exposure of embryos was initiated one hour post fertilization and kept until day five at 28 degrees Celsius. Embryo media containing ligand were exchanged every second day. At different time points embryos were collected for RNA extractions.
RNA extraction and cDNA synthesis
Total RNA from isolated organs of adult fish and from pooled embryos were extracted using Trizol reagent (Invitrogen) and RNeasy Mini Kit columns (Qiagen GmbH, Germany) according to the manufacturer's instructions. RNA concentrations were measured in a spectrophotometer and RNA integrity was analyzed by gel electrophoresis. Total RNA (1 µg) was treated with DNase I (amplification grade, Invitrogen) to remove DNA contaminations prior to cDNA synthesis carried out using Superscript II reverse transcriptase (Invitrogen). In the real-time PCR assays template cDNAs were diluted ten times.
Real time PCR
Real-time PCR was pursued using Power SYBR Green master mix (Applied Biosystems) and amplified using an ABI Prism 7500 Sequence detector (Applied Biosystems). Primers specific for esr1 (NM_152959), esr2b (AAH86848), ensa (NM_001045184), sarcosine (NM_198979), fig alpha (AY302567) and zpc (NM_131696) and β-actin (NM_131031) were designed using Primer Express software and the primer sequence for esr2a (AAH44349) was adapted as described [20]. The primer sets used are: esr1, F- 5′-CAGGACCAGCCCGATTCC-3′ and R- 5′-TTAGGGTACATGGGTGAGAGTTTG-3′; esr2b, F-5′-CGCTCGGCATGGACAAC-3′, R- 5′-CCCATGCGGTGGAGAGTAAT-3′; esr2a, F-5′-CTCACAGCACGGACCCTAAAC-3′, R- 5′-GGTTGTCCATCCTCCCGAAAC-3′; β-actin, F-5′-TGCCCCTCGTGCTGTTTT-3′, R- 5′-TCTGTCCCATGCCAACCAT-3′; ensa, F- 5′-TGGTGACCGGAGACCACAT-3, R- 5′-GCTGGTGAGGATGGTGTTTTTC-3′; sarcosine, F- 5′-GGAGATGCGCTACGCTTCAG-3′, R- 5′-GGCATCCTGGCAGCATTC-3′; fig alpha, F- 5′-CCCCGTTCACGTCAATATCG-3′, R- 5′-TGCGAGCTGTCGCCTCTT-3′; zpc, F- 5′-GGATGCCTTTAGGTTTCACAAGTT-3′, R- 5′-CCCGATTCTTAGCACTCACAGA-3′. Primer specificity was confirmed by standard curve analysis and β-actin expression was used to normalize expression of the three estrogen receptors. RNA from a zebrafish liver cell line (ZFL) was used as a calibrator in experiments using non-exposed adult fish. The stage before zygotic transcription (<3hpf) was used as a calibrator for the embryo experiments. Each experiment was carried out at least three times in triplicates.
Statistical analysis
Numeric data from the expression experiments were analyzed in triplicates. Dispersion of the numbers and the symmetric distribution were analyzed using Student's t-test. Unpaired Student's t-test was used for the experiments in which ERs were activated with ligands. Probability of <0.05 was considered statistically significant. All graphs were plotted using the software GraphPad Prism 5.
Bioinformatics analysis
Using the Clustal X program alignments of estrogen receptor beta LBDs of mouse, human and five fish species was pursued. Pairwise sequence comparisons of ERbeta subtypes were calculated. The accession numbers of ERbeta sequences of different species are: AAH86848 (zebrafish, Danio rerio, DrERβ1); AAH44349 (zebrafish, DrERβ2); AAD26921 (goldfish, Carassius auratus, CaERβ1); AAF35170 (goldfish, CaERβ2); ENSTRUT00000016675, pufferfish, Fugu rubripes, FrERβ1); ENSTRUT00000035144, pufferfish, FrERβ2); AAG16711, Atlantic croaker, Micropogonias undulates, MuERβ); AAG16712, Atlantic croaker, MuERγ); ENSORLG00000018012, medaka, Oryzias latipes OlERβ1); ENSORLT00000022182, medaka, OlERβ2); CAAO3949, house mouse, Mus musculus, MmERβ); NP_001428, human, Homo sapiens, HsERβ).
Results
esr1 and esr2 isofoms expressed in embryos and in adult zebrafish
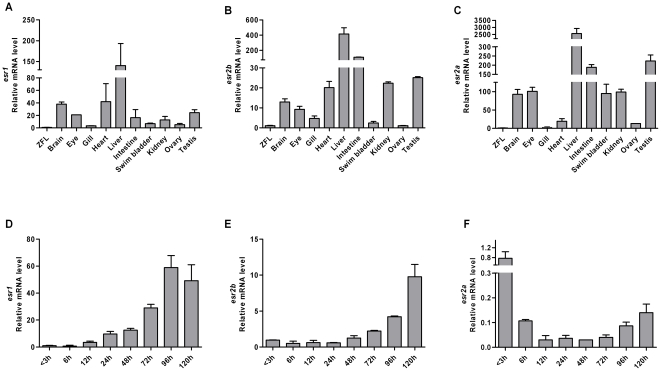
The real-time PCR methodology is a powerful tool to establish mRNA expression levels of specific molecules in organs and we used this methodology to evaluate the levels of the three estrogen receptors, esr1, esr2a and esr2b in zebrafish. Control experiments were pursued from early life stages to compare the stability of three reference genes in the real time PCR assays. The results showed that among the three control genes the beta-actin gene showed the most stable threshold values during the developmental stages (Figure S1). In adult fish the beta-actin Ct values was determined in liver, gut, eye, brain, testis and ovary in female and male adult fish. The expression of the beta-actin control gene showed Ct values in tissues between 17.3 and 23.4 in male fish and between 17.8 and 25.2 in female fish. The Ct values for control genes should be as stable as possible [21] and except for a higher Ct value in liver tissue the other tissues showed small variations under the conditions used (Figure S2). The expression of the estrogen receptor transcripts in the real time PCR showed that in absence of exposures and in a pool of five organs of female or male zebrafish, the esr transcripts were abundantly expressed albeit at different levels (Figure 1A–C). As expected, and shown by others, a high expression of esr1 was detected in liver [11], [14], [18] but expression of esr1 was also detected in organs such as brain, eye, heart and testis when compared to a zebrafish control liver cell line (Figure 1A). The two ERbeta transcripts, esr2b and esr2a were highly expressed in liver as well as in several of the other organs (Figure 1B–C). In brain the expression levels of esr2b represented approximately 3% of the expression levels found in liver. In testis, kidney and heart the amount of esr2b represented approximately 5% and in intestine approximately 25% of that found in liver (Figure 1B). Eye, gill, swim bladder and ovary showed very low levels of esr2b mRNA compared to the other organs (Figure 1B). The expression levels of esr2a in intestine and in testis were approximately 10% of the levels found in liver; the expression in brain, eye, swim bladder and kidney represented 5% and the esr2a expression in gill, heart and ovary showed lower expression levels (Figure 1C). ERbeta has been implicated in inflammatory disease [22] and the high expression levels of ERbeta genes in the intestine could suggest that the intestine may have an ERbeta related immunological role.
Figure 1. Expression levels of zebrafish estrogen receptors in organs, in embryos and in early larvae.
The expression levels of esr genes are shown. (A) esr1 expression in organs; (B) esr2b expression in organs; (C) esr2a expression in organs; (D) esr1 expression in embryos and early larvae; (E) esr2b expression in embryos and early larvae; (F) esr2a expression in embryos and early larvae. Data are represented as mean ± SD of three independent experiments.
In comparison to the esr1 mRNA in liver the expression levels were high in brain and testis (20–30% of the content in liver) whereas the expression levels of esr1 in eye, gill, intestine, swim bladder, kidney and ovary were lower (Figure 1A). In ovary all three ERs showed a very low level of expression. To test the quality of the ovary mRNA we used primers specific for the germ cell transcription factor (fig alpha) [23] and for the egg envelope protein (zpc) [24] in real time assays. The results showed high expression of fig alpha and zpc in this organ (Figure S3) which strongly indicated that the mRNA utilized had not undergone degradation.
To determine the ER expression during the embryonic stages we collected eight stages, i.e. one stage prior to midblastula transition (MBT at 3 hpf), five stages during embryogenesis (6, 12, 24, 48 and 72 hpf) and two additional stages of early larvae (96 and 120 hpf). Using the primers that were previously utilized to detect mRNA content in adult tissue we showed the unique expression patterns of each ER gene type (Figure 1D–F). Onset of esr1 expression occurred at the stage of zygotic control and accumulated from 12 hpf and in the following three stages (Figure 1D). The expression of esr2b also accumulated during development but with an onset of expression occurring 24 h later than that of esr1 (Figure 1E). Both esr1 and esr2b were expressed at the early larval stage (96 and 120 hpf). Expression of esr2a differed from the other two ERs and was decreased at 6 hpf, persisted at low levels at the stages of development and appeared again after hatching and showed expression at the early larval stages, 96 and 120 hpf (Figure 1F). The expression of all three ER subtypes was detected before MBT thus indicating their maternal origin [12], [20].
Ligand dose response in embryos and in adult zebrafish
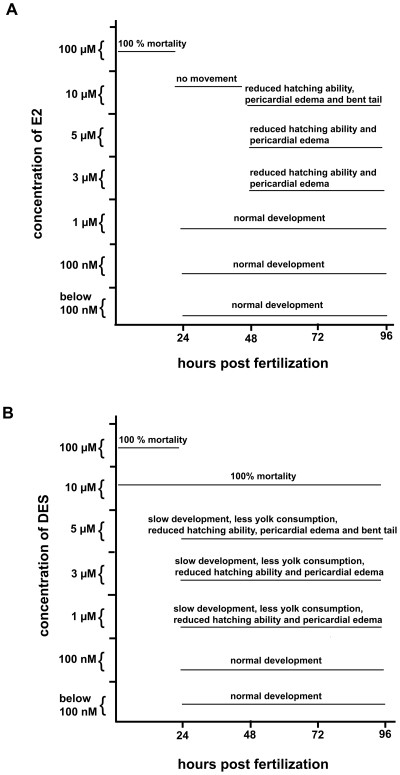
A regulatory role of the ER ligand, 17β-estradiol (E2) on target genes in mammalian cells has previously been described [25] and it has been shown that the esr1 gene has a capacity to autoregulate itself in cells of liver origin both in mammals and in fish [18], [25]. We used three ligands in the real time assays, the natural ligand 17β-estradiol and the two synthetic ligands, diethylstilbestrol (DES) and nonylphenol (4-NP). The two latter ligands mimic the natural ligand in their capacity to induce ER target genes. In order to investigate the dose of the ligand causing an effect on the esr1 expression level we pursued a dose response experiment using the three ligands. To determine the dose of ligand for the experiments, we used the concentrations 0, 0.1, 1, 10 nM, 0.1, 1, 3, 5, 10 and 100 µM for exposures. The parameters tested were a high survival rate and no apparent morphological traits of the embryos. The results showed that embryos and early larvae survived at the concentration 10 µM and 5 µM of E2 and DES respectively (Figure 2). The morphology of the embryos/early larvae was normal at exposure of 1 µM E2 (Fig. 2A) and at 100 nM DES (Fig. 2B) but effects such as heart edema and impaired hatching ability were seen at higher concentrations. In embryos the lowest concentration for an aberrant developmental phenotype caused by exposure to 4-NP (after 48 h) was 5 µM [26]. Lethality following in vivo exposure of adult fish for 48 h was tested on three female and three male fish at concentrations 1, 2, 5 and 10 µM of ligand. The fish survived at the concentration 2 µM E2. At 5 µM E2 all three female fish survived but all male fish died. A similar exposure experiment using DES and 4-NP showed that all fish died if exposed to 5 µM of ligand, whereas all fish survived at 2 µM (not shown). Concentrations in between 2 and 5 µM were not tested. In the following exposure experiments we used 1 µM and 100 nM of ligand.
Figure 2. Effects of natural or synthetic ligand concentrations in early-life stages.
The ligand dependent effects of different concentrations of E2 (A) or DES (B) during embryogenesis and early larval stages are shown. Following exposure of 7 hpf embryos the mortality rate and the visible phenotypes were monitored. Concentration of the ligands is plotted against the stage of development.
Ligands increase ER expression in embryos and in early larvae
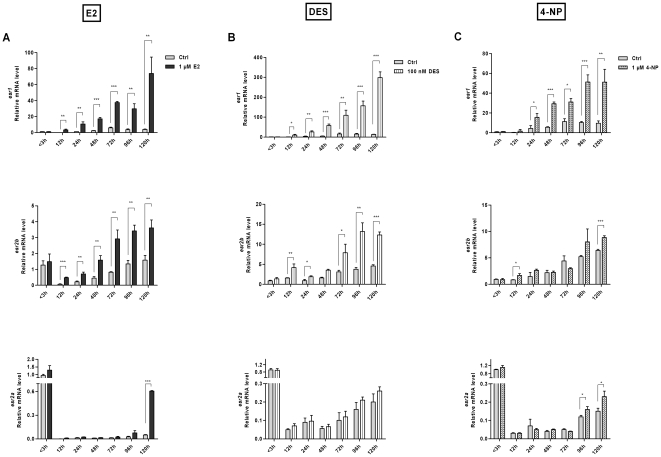
Estrogen effects on the expression levels of ERs in zebrafish early life have not been well characterized and except for esr2a expression levels [20], and esr expression at stages preceding 48 hpf, [27] there is sparse information on the quantitative expression levels of ER subtypes during development and in the early larvae. To investigate a possible regulatory role of the natural ligand in zebrafish embryos, we exposed the embryos one-hour post fertilization to E2 or vehicle (0.1% ethanol). Exposed embryos showed esr1 mRNA expression during development and in the stages of early larvae (Figure 3A). At the lower concentration (100 nM) the strong agonist ligand, DES yielded a similar result on esr1 (Figure 3B). An increased expression of esr1 was also detected following 4-NP exposures (Figure 3C). These data clearly show sensitivity of the expression levels of the esr1 gene in presence to the natural and of synthetic ligands.
Figure 3. Effects of natural or synthetic ligands on esr expression levels in early-life stages.
Expression levels of esr genes in embryos and early larvae in absence (ctrl) and presence of ligand. Embryos were exposed to E2 (1 µM), DES (100 nM), 4-NP (1 µM) or solvent control (0.1% ethanol) one-hour post fertilization until processed for qPCR. Transcript levels after treatment with E2 (A), DES (B) or 4-NP (C) are shown. Data are represented as mean ± SD of three independent experiments. Statistical significance was measured by Students's t test and asterisks (* p<0.05; ** p<0.01; ***p<0.001) indicate significant differences between the control and ligand treated groups for each developmental stage.
Since esr1 expression was increased in presence of E2, DES and 4-NP during early stages, we reasoned that also the gene products of ERbeta might respond to these ligands. As shown in Figure 3A, the expression of esr2b, but not esr2a was affected by E2 at the stages between 12 and 72 hpf. At the two larval stages (96 and 120 hpf) however, an increase could be detected of both beta gene products in presence of E2 (Figure 3A). As DES had a stronger effect in the dose response study and also has a higher binding affinity for ERs [15], [28] we used the lower concentration of DES (100 nM) in the exposures of the zygotes. Figure 3B and 3C show an induction of esr2b by DES; in a similar set up, no significant effect was detected after exposure to 4-NP. As both DES and 4-NP were potent inducers of esr1 the low expression of esr2b following the exposures was not due to lower uptake of the ligand. The low esr2a mRNA levels during development were not altered by any of the ligands. At the early larval stages an induction of the esr2a expression was detected following exposure of ligand. Our results show a clear difference in expression levels between the two beta gene products in response to ligand exposures at the early life stages.
Ligands modulate expression levels of ERs in liver, brain and gonads of female and male fish
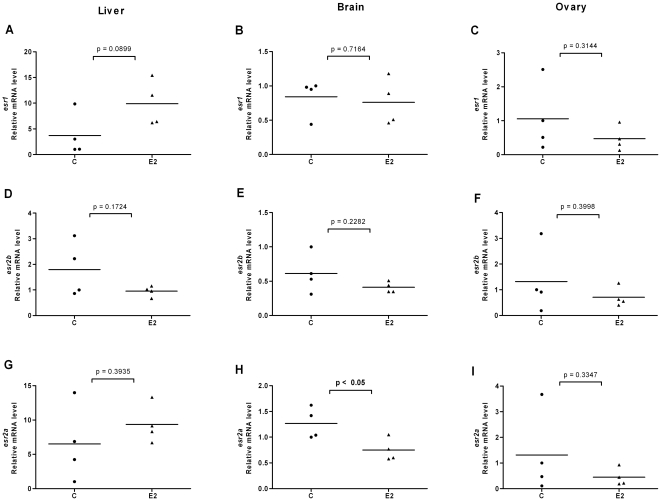
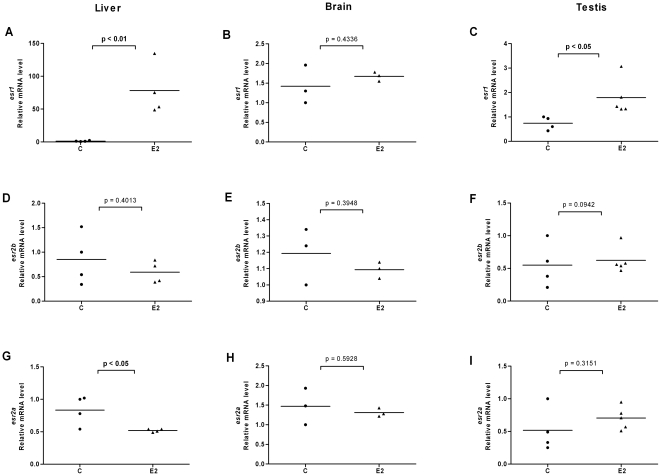
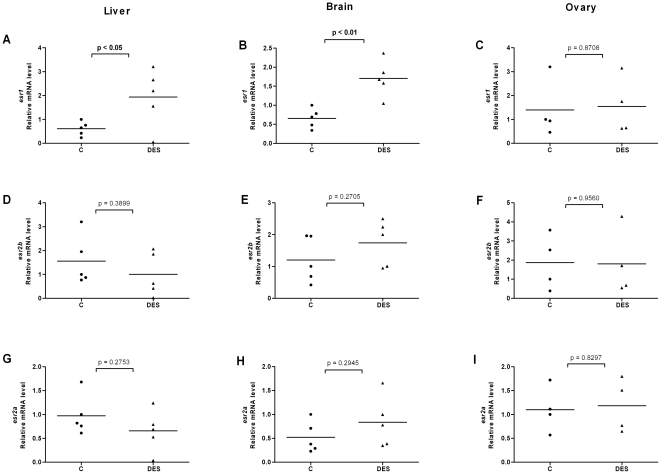
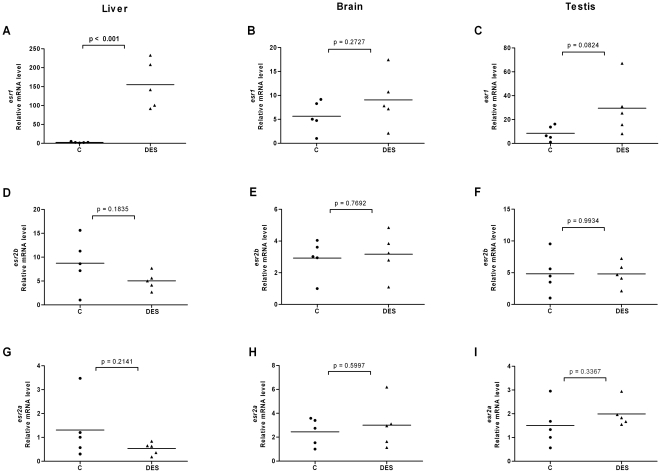
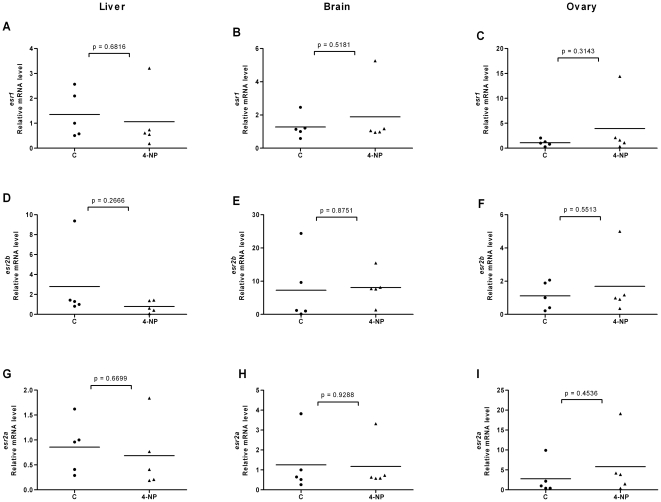
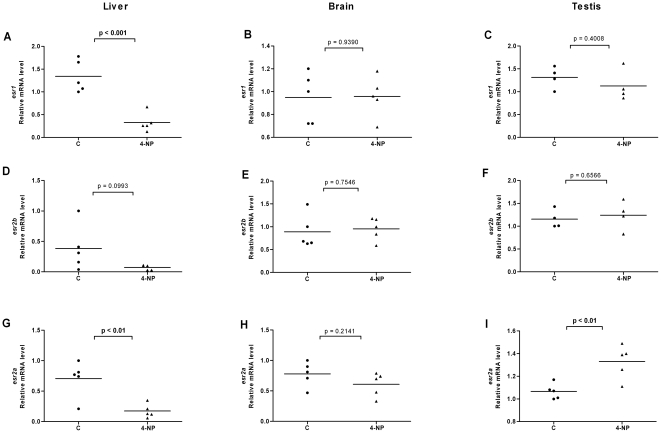
In order to investigate the effects of ligands on ER expression in tissues of adult zebrafish and in particular in tissues involved in estrogen metabolism and signaling, we exposed fish to E2, DES or 4-NP. We isolated organs of individual female and male fish, isolated the mRNA and compared the ER expression levels in each individual organ. We utilized the same esr2 specific primers that were earlier used for real time PCR on target cDNAs derived from stages of development and of early larvae. The results for esr expression levels in liver, brain, ovary and testis are shown in Figure 4, Figure 5, Figure 6, Figure 7, Figure 8 and Figure 9. Exposure to E2 of female or male fish increased the expression of esr1 in liver and in testis but not in brain or ovary (Figures 4A–C, 5A–C). Furthermore, in male fish we found increased levels of esr1 in eye and intestine following E2 exposure (not shown). Exposure to DES showed similar results as with E2 i.e. esr1 expression was increased in liver, but, in addition, increased expression levels of esr1 were seen in brain of female fish (Figures 6A–B, 7A). In contrast to E2 and DES, 4-NP strongly decreased esr1 expression in liver which is in agreement with the decrease in liver reported for three other fish species [29] [30] [31].
Figure 4. Effects of 17β-estradiol on esr expression in liver, brain and ovary of female fish.
Expression levels of esr1 (A–C), esr2b (D–F) and esr2a (G–I) in liver, brain and ovary of female zebrafish following exposure to E2 (1 µM). Ethanol (0.1%) was used as solvent control and adult females were exposed to E2 or solvent control for 48 h and mRNA levels of esr1, esr2b and esr2a were quantified. After normalization with beta-actin the expression levels of individual fish of both groups are shown. The mean value is indicated by a line.
Figure 5. Effects of 17β-estradiol on esr expression in liver, brain and testis of male fish.
Expression levels of esr1 (A–C), esr2b (D–F) and esr2a (G–I) in liver, brain and testis of male zebrafish following exposure to E2 (1 µM). Normalization and mean values were calculated as in figure 4.
Figure 6. Effects of diethylstilbestrol on esr expression in liver, brain and ovary of female fish.
Expression levels of esr1 (A–C), esr2b (D–F) and esr2a (G–I) in liver, brain and ovary of female fish following exposure to DES (1 µM).
Figure 7. Effects of diethylstilbestrol on esr expression in liver, brain and testis of male fish.
Expression levels of esr1 (A–C), esr2b (D–F) and esr2a (G–I) in liver, brain and testis of male fish following exposure to DES (1 µM).
Figure 8. Effects of 4-nonylphenol on esr expression in liver, brain and ovary of female fish.
Expression levels of esr1 (A–C), esr2b (D–F) and esr2a (G–I) in liver, brain and ovary following exposure to 4-NP (1 µM).
Figure 9. Effects of 4-nonylphenol on esr expression in liver, brain and testis of male fish.
Expression levels of esr1 (A–C), esr2b (D–F) and esr2a (G–I) in liver, brain and testis following exposure to 4-NP (1 µM).
Changes in the expression of esr2b could not be detected in the tissues tested in female or male zebrafish. However expression of esr2a showed ligand specific changes in some tissues. In female fish the natural ligand but not the synthetic ligands had effects on transcript levels and increased esr2a expression in liver and decreased esr2a expression in brain (Figure 4G–H). The expression levels of esr2a following E2 exposure decreased in liver of male fish. The exposure to 4-NP, but not DES, resulted in a significant decrease of esr2a expression in liver of male fish (Figure 7G, 9G). In testis exposure to 4-NP, but not E2 or DES significantly increased the expression levels of esr2a (Figure 5I, 7I, 9I). Similar data was recorded in testis from another zebrafish strain (AB strain) following in vivo exposure to 4-NP (not shown).
In eye or intestine of female or male fish, esr2a expression did not change following exposure to 4-NP (not shown).
In brain of rats there are genes reported to be targets of 4-NP [32] and we identified in the databank two orthologues of these genes, sarcosine and ensa of zebrafish. To test these two orthologues in our zebrafish system, we designed primers specific to the zebrafish sarcosine and ensa genes, and used these primers on cDNA derived from brain of male zebrafish exposed to 4-NP. 4-NP had a stimulatory effect on sarcosine expression and a slightly repressive effect on the ensa gene in brain although with low significance (Figure S4). This might indicate a similar response to 4-NP in brain of rat and zebrafish.
The sequence conservation of the esr2a and esr2b
Only one ERbeta gene has been identified in mammalian species. In the teleost lineage several genes including ERbeta (but not ERalpha) have undergone gene duplication [33], [34] generating two genes in many fish species including zebrafish. We hypothesized that the human ERbeta structurally may have similarities to one of the two ERbeta proteins in zebrafish. We used bioinformatics to align one of the conserved domains, the ligand binding domain (LBD) of ERbeta in human and in mouse to the corresponding regions of esr2b and esr2a in zebrafish and in four other fish species that harbor two types of ERbeta. The results showed that i) the LBDs of mammalian ERbeta are approximately 70% homologous to esr2a and esr2b and ii) in this region the homology between the two ERbeta peptides in zebrafish is 76% (Table 1). The differences in the primary sequence of ERbeta LBD (not shown) do not indicate that human ERbeta is more closely related to specifically any one of the two subtypes in zebrafish.
Table 1. Amino acid conservation in the ERbeta ligand binding domains.
| Hs ERβ | Mm ERβ | Mu ERβ | Mu ERγ | Ca ERβ1 | Ca ERβ2 | Ol ERβ2 | Ol ERβ1 | Fr ERβ2 | Fr ERβ1 | Dr ERβ2 | Dr ERβ1 | |
| Dr ERβ1 | 72% | 71% | 82% | 73% | 74% | 95% | 72% | 100% | 74% | 79% | 76% | 100% |
| Dr ERβ2 | 71% | 69% | 77% | 86% | 93% | 76% | 89% | 76% | 87% | 75% | 100% | 76% |
Calculations of the homologies in the ligand binding domains. Zebrafish and four other fish species were compared with the corresponding regions in human and mouse. Dr, zebrafish; Ca, goldfish; Fr, pufferfish; Mu, Atlantic croaker; Ol, medaka; Mm, house mouse; Hs, human.
Discussion
In this study we measured mRNA levels of the genes encoding the estrogen receptors in zebrafish. Expression levels of esr2a during developmental stages 3–72 hpf have previously been reported [20] and here we show expression levels of all three receptors in adult tissues, in embryos and in early larvae. Genes such as vitellogenin [35], aroB [36] and esr1 [18] have previously been reported as target genes of ER in zebrafish and here we show data that indicate that esr2a and esr2b genes are direct or indirect targets of ER ligands.
Ligands alter the esr gene expression in vivo
It has previously been reported that the esr1 promoter functions as an E2 induced target in liver tissue of fish [18]. In mammalian species a vast number of genes have been identified that respond to ER in presence of ligand [25] but in fish only a limited number of such genes have been identified i.e. vitellogenins [37], aromatase [31], [38] and esr1 [18]. The zebrafish has become a suitable model system for assessing synthetic ligands that function as disrupters of the endocrine system.
The two ERbeta genes in zebrafish have different levels of expression depending on tissue context. The existence of two ERbeta genes in zebrafish (and in a number of other fish species) is an example of gene duplication and which put focus on possible functional differences between esr2a and esr2b. The two ERbeta genes are conserved but their primary sequences are not identical (Table 1). There are examples of other paralogue genes in zebrafish showing differences in expression patterns [39]–[41] and with possible differences in function. In other model systems it has been shown that paralogues can have different functions, for instance in case of the maturation switch of globin genes [42]. The low expression level of the zebrafish esr2a gene in control and exposed embryos (Figure 1F) indicates that the two ERbeta proteins may have diverse functions during development. ER expression has been shown during early life stages in specific cell types of pectoral fin buds, in cells of the hatching gland, in brain cells and in neuromasts [20], [43], [44]. Increased expression of esr1 and esr2b following ligand exposure for two days (Figure 3A–B) indicates that these genes are under regulatory control.
Although the PCR methodology is highly sensitive, the efficiency by which a ligand enters a particular organ following in vivo exposure may be a problem due to low penetration efficiency. For solving these issues additional methodology will be needed for the characterization of esr genes as target genes of estrogenic compounds. Another limitation with the PCR methodology is the low number of well characterized control genes. A larger number of control genes may facilitate detection of small changes in expression levels of the gene of interest. A control gene that shows stable Ct values in different tissues and/or during the developmental stages will increase the accuracy [21]. Another factor to consider is the amount of starting material in the PCR assays as this may influence the Ct values.
4-nonylphenol, an estrogen mimicking regulator?
Alkylphenol ethoxylates (APEs) have been used for 50 years in industrial manufacturing and nonylphenol is the major breakdown product of APEs. Nonylphenol, a xenoestrogen first detected in sewage of water treatment plants in 1984 [17] has been extensively studied as one of the most potent environmental chemicals (EDCs) [13], [45], [46]. There are accumulated data on negative effects of human exposure [47] and in animal models endocrine and reproductive effects of nonylphenol have been shown such as inhibited testicular growth [48], [49], lower semen volume [50] and lower fertility [51]. In zebrafish embryos it has been shown that 4-NP mediates neurotoxic effects [26] and aberrant effects on specific cell types [52].
4-NP has been shown to induce target genes in a number of arrays and in other systems. This ligand is efficient in the induction of the vitellogenin gene, one of the biomarkers that frequently has been used to detect estrogenic effects in male fish [51], [53]. In microarray systems a number of genes have been identified that are differentially expressed following exposure to 4-NP [53]; in fact the number of 4-NP induced genes exceeds that following exposure to the natural ligand in embryonic zebrafish [54]. In a mammalian array study [32] the 4-NP ligand was shown to regulate sarcosine and ensa genes, a result we were able to reproduce in brain of male zebrafish (although not with high significance; Figure S4).
There are differences in the potency by which specific ligands exert their effects in female and male fish. This difference may be explained by sex differences in the levels of circulating 17β-estradiol, which perhaps is the cause for the less distinct effects we see on esr gene expression in female fish following ligand exposure (for instance in liver, Figure 4, 5, 6, 7, 8, 9). However, following exposure of ligand the female and male fish can show opposite effects in levels of ER expression which may indicate a sexually divergent mechanism. Regulation of esr2a expression in brain of female but not male fish (Fig. 4H), and esr2a expression in testis but not in ovaries (Fig. 9I) are examples of sex specific control of ERs. Further studies to evaluate sex specific expression levels of esr genes may reveal novel aspects of ER signaling in female and male zebrafish.
A general view that environmental synthetic chemicals are acting as ‘weak estrogens’ can possibly be challenged by the potency they seem to have. 4-NP has the capacity to disrupt events in adult organs as well as during development, and these effects are detected at concentrations that are not affecting survival or the visual phenotype. Adult zebrafish and zebrafish embryos are well suited as in vivo models for studying molecular effects in individual fish that have been exposed to 4-NP.
Supporting Information
Expression of three different control genes during development. Quantitative real time PCR was performed on embryos and early larvae treated with solvent control (0.1% ethanol) and E2 (1 µM). Ct values of beta-actin (A), 18s rRNA (B) and elongation factor 1 alpha (ef1α) were calculated (C). Data represents mean Ct ± SD of three independent experiments.
(0.34 MB TIF)
Expression of beta actin in organs. Average Ct values of beta actin in different tissues of adult male and female zebrafish following solvent control and E2 exposures. Tissues from three or four adult female and male fish were collected and processed for qPCR as described in materials and methods. Mean Ct values ± SD of beta-actin in solvent control (0.1% ethanol) and E2 exposed groups are shown.
(0.03 MB DOC)
Expression of two female specific genes in ovary. Relative mRNA levels of germ cell transcription factor, fig alpha (A) and egg envelope protein, zpc (B) in organs of adult fish are represented. Data are represented as mean ± SD of three independent experiments.
(0.34 MB TIF)
Expression of two genes in male brain following 4-NP exposure. Expression of sarcosine (A) and ensa (B) in brain of adult male zebrafish following exposure of 4-NP. Brain of five adult males exposed to 4-NP or solvent control was processed for qPCR as described in materials and methods. After normalization with beta actin the expression levels of individual fish of both groups are shown. The mean value is indicated by a line.
(0.32 MB TIF)
Acknowledgments
We would like to thank Magnus Crona, Ljiljana Obrenovic and Kent Ivarsen for meticulous care of the zebrafish and for embryo production; Hui Gao for advice on statistics, Satish Srinivas Kitambi for help with the amino acid sequence alignments and Karin Dahlman-Wright for reading the manuscript.
Footnotes
Competing Interests: The authors have declared that no competing interests exist.
Funding: This project is supported by funds at Karolinska Institutet, Center of Biosciences and by The Swedish Society of Medicine. The funders had no role in study design, data collection and analysis, decision to publish, or preparation of the manuscript.
References
- 1.Green S, Walter P, Kumar V, Krust A, Bornert JM, et al. Human oestrogen receptor cDNA: sequence, expression and homology to v-erb-A. Nature. 1986;320:134–139. doi: 10.1038/320134a0. [DOI] [PubMed] [Google Scholar]
- 2.Greene GL, Gilna P, Waterfield M, Baker A, Hort Y, et al. Sequence and expression of human estrogen receptor complementary DNA. Science. 1986;231:1150–1154. doi: 10.1126/science.3753802. [DOI] [PubMed] [Google Scholar]
- 3.Kuiper GG, Enmark E, Pelto-Huikko M, Nilsson S, Gustafsson JA. Cloning of a novel receptor expressed in rat prostate and ovary. Proc Natl Acad Sci U S A. 1996;93:5925–5930. doi: 10.1073/pnas.93.12.5925. [DOI] [PMC free article] [PubMed] [Google Scholar]
- 4.Mosselman S, Polman J, Dijkema R. ER beta: identification and characterization of a novel human estrogen receptor. FEBS Lett. 1996;392:49–53. doi: 10.1016/0014-5793(96)00782-x. [DOI] [PubMed] [Google Scholar]
- 5.Tremblay GB, Tremblay A, Copeland NG, Gilbert DJ, Jenkins NA, et al. Cloning, chromosomal localization, and functional analysis of the murine estrogen receptor beta. Mol Endocrinol. 1997;11:353–365. doi: 10.1210/mend.11.3.9902. [DOI] [PubMed] [Google Scholar]
- 6.Beato M. Gene regulation by steroid hormones. Cell. 1989;56:335–344. doi: 10.1016/0092-8674(89)90237-7. [DOI] [PubMed] [Google Scholar]
- 7.Evans RM. The steroid and thyroid hormone receptor superfamily. Science. 1988;240:889–895. doi: 10.1126/science.3283939. [DOI] [PMC free article] [PubMed] [Google Scholar]
- 8.Heldring N, Pike A, Andersson S, Matthews J, Cheng G, et al. Estrogen receptors: how do they signal and what are their targets. Physiol Rev. 2007;87:905–931. doi: 10.1152/physrev.00026.2006. [DOI] [PubMed] [Google Scholar]
- 9.Harris HA. Estrogen receptor-beta: recent lessons from in vivo studies. Mol Endocrinol. 2007;21:1–13. doi: 10.1210/me.2005-0459. [DOI] [PubMed] [Google Scholar]
- 10.Zhao C, Dahlman-Wright K, Gustafsson JA. Estrogen receptor beta: an overview and update. Nucl Recept Signal. 2008;6:e003. doi: 10.1621/nrs.06003. [DOI] [PMC free article] [PubMed] [Google Scholar]
- 11.Legler J, Broekhof JLM, Brouwer A, Lanser PH, Murk AJ, et al. A novel in vivo bioassay for (xeno-)estrogens using transgenic zebrafish. Environ Sci Technol. 2000;34:4439–4444. [Google Scholar]
- 12.Bardet PL, Horard B, Robinson-Rechavi M, Laudet V, Vanacker JM. Characterization of oestrogen receptors in zebrafish (Danio rerio). J Mol Endocrinol. 2002;28:153–163. doi: 10.1677/jme.0.0280153. [DOI] [PubMed] [Google Scholar]
- 13.Shelby MD, Newbold RR, Tully DB, Chae K, Davis VL. Assessing environmental chemicals for estrogenicity using a combination of in vitro and in vivo assays. Environ Health Perspect. 1996;104:1296–1300. doi: 10.1289/ehp.961041296. [DOI] [PMC free article] [PubMed] [Google Scholar]
- 14.Menuet A, Pellegrini E, Anglade I, Blaise O, Laudet V, et al. Molecular characterization of three estrogen receptor forms in zebrafish: binding characteristics, transactivation properties, and tissue distributions. Biol Reprod. 2002;66:1881–1892. doi: 10.1095/biolreprod66.6.1881. [DOI] [PubMed] [Google Scholar]
- 15.Costache AD, Pullela PK, Kasha P, Tomasiewicz H, Sem DS. Homology-modeled ligand-binding domains of zebrafish estrogen receptors alpha, beta1, and beta2: from in silico to in vivo studies of estrogen interactions in Danio rerio as a model system. Mol Endocrinol. 2005;19:2979–2990. doi: 10.1210/me.2004-0435. [DOI] [PubMed] [Google Scholar]
- 16.Sumpter JP. The ecotoxicology of hormonally active micropollutants. Water Sci Technol. 2008;57:125–130. doi: 10.2166/wst.2008.796. [DOI] [PubMed] [Google Scholar]
- 17.Giger W, Brunner PH, Schaffner C. 4-Nonylphenol in sewage sludge: accumulation of toxic metabolites from nonionic surfactants. Science. 1984;225:623–625. doi: 10.1126/science.6740328. [DOI] [PubMed] [Google Scholar]
- 18.Menuet A, Le Page Y, Torres O, Kern L, Kah O, et al. Analysis of the estrogen regulation of the zebrafish estrogen receptor (ER) reveals distinct effects of ERalpha, ERbeta1 and ERbeta2. J Mol Endocrinol. 2004;32:975–986. doi: 10.1677/jme.0.0320975. [DOI] [PubMed] [Google Scholar]
- 19.Kimmel CB, Ballard WW, Kimmel SR, Ullmann B, Schilling TF. Stages of embryonic development of the zebrafish. Dev Dyn. 1995;203:253–310. doi: 10.1002/aja.1002030302. [DOI] [PubMed] [Google Scholar]
- 20.Tingaud-Sequeira A, Andre M, Forgue J, Barthe C, Babin PJ. Expression patterns of three estrogen receptor genes during zebrafish (Danio rerio) development: evidence for high expression in neuromasts. Gene Expression Patterns. 2004;4:561–568. doi: 10.1016/j.modgep.2004.02.002. [DOI] [PubMed] [Google Scholar]
- 21.McCurley AT, Callard GV. Characterization of housekeeping genes in zebrafish: male-female differences and effects of tissue type, developmental stage and chemical treatment. BMC Mol Biol. 2008;9:102. doi: 10.1186/1471-2199-9-102. [DOI] [PMC free article] [PubMed] [Google Scholar]
- 22.Cristofaro PA, Opal SM, Palardy JE, Parejo NA, Jhung J, et al. WAY-202196, a selective estrogen receptor-beta agonist, protects against death in experimental septic shock. Crit Care Med. 2006;34:2188–2193. doi: 10.1097/01.CCM.0000227173.13497.56. [DOI] [PubMed] [Google Scholar]
- 23.Liang L, Soyal SM, Dean J. FIGalpha, a germ cell specific transcription factor involved in the coordinate expression of the zona pellucida genes. Development. 1997;124:4939–4947. doi: 10.1242/dev.124.24.4939. [DOI] [PubMed] [Google Scholar]
- 24.Del Giacco L, Diani S, Cotelli F. Identification and spatial distribution of the mRNA encoding an egg envelope component of the Cyprinid zebrafish, Danio rerio, homologous to the mammalian ZP3 (ZPC). Dev Genes Evol. 2000;210:41–46. doi: 10.1007/pl00008187. [DOI] [PubMed] [Google Scholar]
- 25.Carroll JS, Brown M. Estrogen receptor target gene: an evolving concept. Mol Endocrinol. 2006;20:1707–1714. doi: 10.1210/me.2005-0334. [DOI] [PubMed] [Google Scholar]
- 26.Ton C, Lin Y, Willett C. Zebrafish as a model for developmental neurotoxicity testing. Birth Defects Res A Clin Mol Teratol. 2006;76:553–567. doi: 10.1002/bdra.20281. [DOI] [PubMed] [Google Scholar]
- 27.Mouriec K, Lareyre JJ, Tong SK, Page YL, Vaillant C, et al. Early Regulation of Brain Aromatase (cyp19a1b) by Estrogen Receptors During Zebrafish Development. Dev Dyn. 2009;238:2641–2651. doi: 10.1002/dvdy.22069. [DOI] [PubMed] [Google Scholar]
- 28.Korach KS, Levy LA, Sarver PJ. Estrogen receptor stereochemistry: receptor binding and hormonal responses. J Steroid Biochem. 1987;27:281–290. doi: 10.1016/0022-4731(87)90319-0. [DOI] [PubMed] [Google Scholar]
- 29.Seo JS, Lee YM, Jung SO, Kim IC, Yoon YD, et al. Nonylphenol modulates expression of androgen receptor and estrogen receptor genes differently in gender types of the hermaphroditic fish Rivulus marmoratus. Biochem Biophy Res Commun. 2006;346:213–223. doi: 10.1016/j.bbrc.2006.05.123. [DOI] [PubMed] [Google Scholar]
- 30.Sabo-Attwood T, Blum JL, Kroll KJ, Patel V, Birkholz D, et al. Distinct expression and activity profiles of largemouth bass (Micropterus salmoides) estrogen receptors in response to estradiol and nonylphenol. J Mol Endocrinol. 2007;39:223–237. doi: 10.1677/JME-07-0038. [DOI] [PubMed] [Google Scholar]
- 31.Luo Q, Ban M, Ando H, Kitahashi T, Kumar Bhandari R, et al. Distinct effects of 4-nonylphenol and estrogen-17 beta on expression of estrogen receptor alpha gene in smolting sockeye salmon. Comp Biochem Physiol C Toxicol Pharmacol. 2005;140:123–130. doi: 10.1016/j.cca.2005.01.008. [DOI] [PubMed] [Google Scholar]
- 32.Xia YY, Zhan P, Wang Y. Effects of nonylphenol on brain gene expression profiles in F1 generation rats. Biomed Environ Sci. 2008;21:1–6. doi: 10.1016/S0895-3988(08)60001-X. [DOI] [PubMed] [Google Scholar]
- 33.Amores A, Force A, Yan YL, Joly L, Amemiya C, et al. Zebrafish hox clusters and vertebrate genome evolution. Developmental Dynamics Science. 1998:1711–1714. doi: 10.1126/science.282.5394.1711. [DOI] [PubMed] [Google Scholar]
- 34.Wittbrodt J, Meyer A, Schartl M. More genes in fish? BioEssays. 1998;20:511–515. [Google Scholar]
- 35.Wang H, Tan JT, Emelyanov A, Korzh V, Gong Z. Hepatic and extrahepatic expression of vitellogenin genes in the zebrafish, Danio rerio. Gene. 2005;356:91–100. doi: 10.1016/j.gene.2005.03.041. [DOI] [PubMed] [Google Scholar]
- 36.Sawyer SJ, Gerstner KA, Callard GV. Real-time PCR analysis of cytochrome P450 aromatase expression in zebrafish: gene specific tissue distribution, sex differences, developmental programming, and estrogen regulation. Gen Comp Endocrinol. 2006;147:108–117. doi: 10.1016/j.ygcen.2005.12.010. [DOI] [PubMed] [Google Scholar]
- 37.Harries JE, Sheahan DA, Jobling S, Matthiessen P, Neall P, et al. Estrogenic activity in five United Kingdom rivers detected by measurement of vitellogenesis in caged male trout. Environ Toxicol Chem. 1997;16:534–542. [Google Scholar]
- 38.Meucci V, Arukwe A. Transcriptional modulation of brain and hepatic estrogen receptor and P450arom isotypes in juvenile Atlantic salmon (Salmo salar) after waterborne exposure to the xenoestrogen, 4-nonylphenol. Aquat Toxicol. 2006;77:167–177. doi: 10.1016/j.aquatox.2005.11.008. [DOI] [PubMed] [Google Scholar]
- 39.Chiang EF, Yan YL, Guiguen Y, Postlethwait J, Chung B. Two Cyp19 (P450 aromatase) genes on duplicated zebrafish chromosomes are expressed in ovary or brain. Mol Biol Evol. 2001;18:542–550. doi: 10.1093/oxfordjournals.molbev.a003833. [DOI] [PubMed] [Google Scholar]
- 40.Liu RZ, Denovan-Wright EM, Degrave A, Thisse C, Thisse B, et al. Differential expression of duplicated genes for brain-type fatty acid-binding proteins (fabp7a and fabp7b) during early development of the CNS in zebrafish (Danio rerio). Gene Expr Patterns. 2004;4:379–387. doi: 10.1016/j.modgep.2004.01.010. [DOI] [PubMed] [Google Scholar]
- 41.Liu RZ, Sharma MK, Sun Q, Thisse C, Thisse B, et al. Retention of the duplicated cellular retinoic acid-binding protein 1 genes (crabp1a and crabp1b) in the zebrafish genome by subfunctionalization of tissue-specific expression. Febs J. 2005;272:3561–3571. doi: 10.1111/j.1742-4658.2005.04775.x. [DOI] [PubMed] [Google Scholar]
- 42.Kingsley PD, Malik J, Emerson RL, Bushnell TP, McGrath KE, et al. “Maturational” globin switching in primary primitive erythroid cells. Blood. 2006;107:1665–1672. doi: 10.1182/blood-2005-08-3097. [DOI] [PMC free article] [PubMed] [Google Scholar]
- 43.Froehlicher M, Liedtke A, Groh K, Lopez-Schier H, Neuhauss SC, et al. Estrogen receptor subtype beta2 is involved in neuromast development in zebrafish (Danio rerio) larvae. Dev Biol. 2009;330:32–43. doi: 10.1016/j.ydbio.2009.03.005. [DOI] [PubMed] [Google Scholar]
- 44.Bertrand S, Thisse B, Tavares R, Sachs L, Chaumot A, et al. Unexpected novel relational links uncovered by extensive developmental profiling of nuclear receptor expression. PLoS Genet. 2007;3:e188. doi: 10.1371/journal.pgen.0030188. [DOI] [PMC free article] [PubMed] [Google Scholar]
- 45.Muncke J, Junghans M, Eggen RI. Testing estrogenicity of known and novel (xeno-)estrogens in the MolDarT using developing zebrafish (Danio rerio). Environ Toxicol. 2007;22:185–193. doi: 10.1002/tox.20255. [DOI] [PubMed] [Google Scholar]
- 46.Liedtke A, Muncke J, Rufenacht K, ERI L. Molecular multi-effect screening of environmental pollutants using the MolDarT. Environ Toxicol. 2008;23:59–67. doi: 10.1002/tox.20305. [DOI] [PubMed] [Google Scholar]
- 47.Ademollo N, Ferrara F, Delise M, Fabietti F, Funari E. Nonylphenol and octylphenol in human breast milk. Environ Int. 2008;34:984–987. doi: 10.1016/j.envint.2008.03.001. [DOI] [PubMed] [Google Scholar]
- 48.Jobling S, Sheahan D, Osborne JA, Matthiessen P, Sumpter JP. Inhibition of testicular growth in rainbow trout (Oncorhynchus mykiss) exposed to estrogenic alkylphenolic chemicals. Environ Toxicol Chem. 1996;15:194–202. [Google Scholar]
- 49.Kinnberg K, Korsgaard B, Bjerregaard P. Concentration-dependent effects of nonylphenol on testis structure in adult platyfish Xiphophorus maculatus. Mar Environ Res. 2000;50:169–173. doi: 10.1016/s0141-1136(00)00078-7. [DOI] [PubMed] [Google Scholar]
- 50.Lahnsteiner F, Berger B, Grubinger F, Weismann T. The effect of 4-nonylphenol on semen quality, viability of gametes, fertilization success, and embryo and larvae survival in rainbow trout (Oncorhynchus mykiss). Aquat Toxicol. 2005;71:297–306. doi: 10.1016/j.aquatox.2004.11.007. [DOI] [PubMed] [Google Scholar]
- 51.Ishibashi H, Hirano M, Matsumura N, Watanabe N, Takao Y, et al. Reproductive effects and bioconcentration of 4-nonylphenol in medaka fish (Oryzias latipes). Chemosphere. 2006;65:1019–1026. doi: 10.1016/j.chemosphere.2006.03.034. [DOI] [PubMed] [Google Scholar]
- 52.Roy D, Palangat M, Chen CW, Thomas RD, Colerangle J, et al. Biochemical and molecular changes at the cellular level in response to exposure to environmental estrogen-like chemicals. J Toxicol Environ Health. 1997;50:1–29. doi: 10.1080/009841097160573. [DOI] [PubMed] [Google Scholar]
- 53.Ruggeri B, Ubaldi M, Lourdusamy A, Soverchia L, Ciccocioppo R, et al. Variation of the genetic expression pattern after exposure to estradiol-17beta and 4-nonylphenol in male zebrafish (Danio rerio). Gen Comp Endocrinol. 2008;158:138–144. doi: 10.1016/j.ygcen.2008.05.012. [DOI] [PubMed] [Google Scholar]
- 54.Shrader EA, Henry TR, Greeley MS, Jr, Bradley BP. Proteomics in zebrafish exposed to endocrine disrupting chemicals. Ecotoxicology. 2003;12:485–488. doi: 10.1023/b:ectx.0000003034.69538.eb. [DOI] [PubMed] [Google Scholar]
Associated Data
This section collects any data citations, data availability statements, or supplementary materials included in this article.
Supplementary Materials
Expression of three different control genes during development. Quantitative real time PCR was performed on embryos and early larvae treated with solvent control (0.1% ethanol) and E2 (1 µM). Ct values of beta-actin (A), 18s rRNA (B) and elongation factor 1 alpha (ef1α) were calculated (C). Data represents mean Ct ± SD of three independent experiments.
(0.34 MB TIF)
Expression of beta actin in organs. Average Ct values of beta actin in different tissues of adult male and female zebrafish following solvent control and E2 exposures. Tissues from three or four adult female and male fish were collected and processed for qPCR as described in materials and methods. Mean Ct values ± SD of beta-actin in solvent control (0.1% ethanol) and E2 exposed groups are shown.
(0.03 MB DOC)
Expression of two female specific genes in ovary. Relative mRNA levels of germ cell transcription factor, fig alpha (A) and egg envelope protein, zpc (B) in organs of adult fish are represented. Data are represented as mean ± SD of three independent experiments.
(0.34 MB TIF)
Expression of two genes in male brain following 4-NP exposure. Expression of sarcosine (A) and ensa (B) in brain of adult male zebrafish following exposure of 4-NP. Brain of five adult males exposed to 4-NP or solvent control was processed for qPCR as described in materials and methods. After normalization with beta actin the expression levels of individual fish of both groups are shown. The mean value is indicated by a line.
(0.32 MB TIF)


