Abstract
High-performance affinity chromatography was used to study binding by the drug lidocaine to human serum albumin (HSA) and α1–acid glycoprotein (AGP). AGP had strong binding to lidocaine, with an association equilibrium constant (Ka) of 1.1-1.7 × 10⁵ M-1 at 37 °C and pH 7.4. Lidocaine had weak-to-moderate binding to HSA, with a Ka in the range of 103 to 104 M-1. Competitive experiments with site selective probes showed that lidocaine was interacting with Sudlow site II of HSA and the propranolol site of AGP. These results agree with previous observations in the literature and provide a better quantitative understanding of how lidocaine binds to these serum proteins and is transported in the circulation. This study also demonstrates how HPAC can be used to examine the binding of a drug with multiple serum proteins and provide detailed information on the interaction sites and equilibrium constants that are involved in such processes.
Keywords: Lidocaine, human serum albumin, α1–acid glycoprotein, high-performance affinity chromatography
1. Introduction
Many drugs can bind to serum proteins, which can affect the distribution, metabolism, elimination and activity of these drugs [1-3]. The study of drugs binding to plasma proteins has been studied extensively [4-6]. Human serum albumin (HSA) and α1–acid glycoprotein (AGP) are two serum proteins known to bind many small solutes such as drugs and hormones in the body [7-9]. HSA is known to bind to mostly acidic drugs, where as AGP is involved in the binding of mostly basic and neutral drugs [10]. Several methods have been used to study these binding processes, including ultrafiltration, equilibrium dialysis, and CE [3,7,11-13]. Computational modeling has also been used to examine the binding of drugs to HSA [14,15]. High-performance affinity chromatography (HPAC) is another tool that has been frequently used to examine such processes [3,7,11,12].
This report will use HPAC to examine binding by the drug lidocaine with HSA and AGP. Lidocaine (see Figure 1) is used in the treatment of ventricular cardiac arrhythmias or cardiac arrest with ventricular fibrillation; lidocaine is also employed as a local anesthetic [16-18]. A previous report has shown that lidocaine has much greater affinity for AGP than for HSA [19]. Lidocaine is known to bind strongly to AGP, with an association equilibrium constant (Ka) in the range of 3.2 (± 0.2) × 104 (determined at 25 °C and pH 7.4 by CE/frontal analysis) up to 1 × 10⁵ M-1 [20]. Lidocaine is also believed to bind weakly to HSA [16-18,21], with an estimated Ka of 2.3 × 10² M-1 (measured at 25 °C and pH 7.4 by equilibrium dialysis) [22]. Frontal analysis will first be used in this study with HPAC to examine the binding of lidocaine with HSA and AGP. Zonal elution and competition studies will also be conducted to identify the binding sites of lidocaine on these serum proteins. The results should provide a clearer picture of how lidocaine binds with these proteins and illustrate how HPAC can be used to provide detailed information on the interactions of a drug with both HSA and AGP.
Figure 1.
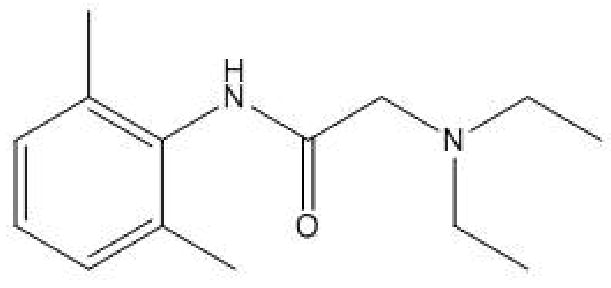
Structure of lidocaine, or 2-(diethylamino)-N-(2,6-diethylphenyl) acetamide monohydrochloride.
2. Experimental
2.1 Reagents
The AGP (human, 99% pure), HSA (essentially fatty acid free, ≥ 96%), lidocaine, racemic propranolol (≥ 99%), racemic warfarin (98%), L-tryptophan (> 98%), and periodic acid were purchased from Sigma (St. Louis, MO, USA). The ethylene glycol was from Fisher Scientific (Pittsburgh, PA, USA). Macherey Nagel (Düren, Germany) was the source of the Nucleosil Si-300 (5 or 7 μm particle diameter, 300 Å pore size). All other reagents were of the purest grades possible. All aqueous solutions were prepared using water from a Nanopure system (Barnstead, Dubuque, IA, USA). The mobile phases were degassed prior to use by ultrasonication and filtered using 0.2 μm nylon filters from Millipore (Billerica, MA, USA).
2.2 Apparatus
Slide-a-Lyzer 10K dialysis cassettes (MW cutoff, 10 kDa) were obtained from Pierce (Rockford, IL, USA). A column packer from Alltech (Deerfield, IL, USA) was used to downward slurry pack all HPAC columns. The system used in the chromatographic studies consisted of two System Gold 118 pumps from Beckman (Fullerton, CA, USA), a UV/Vis 205 variable wavelength absorbance detector from Perseptive Biosystems (Foster City, CA, USA) and a LabPro injection valve (Rohnert Park, FL, USA) equipped with a 5 μL or 10 μL sample loop. Chromatographic data were collected and processed using LabView 5.1 (National Instruments, Austin, TX, USA) and Peakfit (Systat Software, San Jose, CA, USA). During the chromatographic studies, column jackets from Alltech (Deerfield, IL, USA) and a Polyscience circulation water bath from VWR (Buffalo Grove, IL, USA) were used to control the column temperature.
2.3 Methods
Diol silica was prepared from Nucleosil Si-300 (5 or 7 μm particle diameter) using a previous procedure [23]. The methods for converting the diol silica to hydrazide-activated silica and for immobilizing oxidized AGP to this support were also obtained from the literature [3]. Support consisting of hydrazide-activated silica to which no oxidized AGP had been added was made as a control. HSA was immobilized to silica by the Schiff base method, also using diol silica as the starting material [23]. A support that was prepared in the same manner but with no HSA added was prepared as the corresponding control.
The AGP, HSA, and control supports were packed into separate 5 cm × 4.6 mm i.d. stainless steel columns at 4000 psi using pH 7.4, 0.067 M potassium phosphate buffer as the packing solution. The protein content of the AGP support was estimated to be 17 (± 2) mg AGP/g silica, as determined through the measured retention of carbamazepine [24] and using a Ka of 1.05 × 10⁵ M-1 for this interaction [25]. The protein content of the HSA support was estimated to be 30 (± 9) mg HSA/g silica, as also determined through the measured retention of carbamazepine [24] and using a reported Ka of 5.3 × 10³ M-1 [26]. All columns were stored at 4 °C in pH 7.4, 0.067 M phosphate buffer when not in use.
The chromatographic experiments were performed at 37 °C and 0.5 mL/min using a 10 μL sample loop. The only exceptions were the competition studies for HSA, which used a 5 μL sample loop and a flow rate of 1 mL/min. A pH 7.4, 0.067 M potassium phosphate buffer was used as the mobile phase for all studies. This mobile phase was degassed under vacuum for at least 25-30 min prior to use. In the zonal elution studies, mobile phases containing 0-140 μM lidocaine were prepared using the pH 7.4, 0.067 M phosphate buffer, with all injections of probe compounds being made in triplicate. The frontal analysis experiments were also conducted in triplicate, using application buffers containing 5-25 μM lidocaine in pH 7.4, 0.067 M phosphate buffer and only a pH 7.4, 0.067 M phosphate solution as the elution buffer. Control columns in which no protein was present were used to correct for any nonspecific binding by lidocaine or the injected probes to the support and chromatographic system.
The probe compounds used in the competition studies were R/S-propranolol, R/S-warfarin, and L-tryptophan. Each probe was injected separately onto the columns while monitoring its shift in retention as the concentration of lidocaine in the mobile phase was varied. Both R- and S-propranolol are known to bind to a single site on AGP [27]; R- and S-warfarin are both probes for Sudlow site I of HSA, and L-tryptophan is a probe for Sudlow site II [2]. The elution of lidocaine in the frontal analysis experiments was monitored at 205 nm. Detection wavelengths of 225 nm, 308 nm and 280 nm were used in the zonal elution studies to monitor propranolol, warfarin, and L-tryptophan, respectively. The retention times in the zonal elution studies were found by using the first statistical moment of each probe peak, as determined by using Peakfit and programs written in LabView 5.1. The column void time was determined by injecting 10 mM sodium nitrate onto the column and monitoring its elution at 205 nm. The extra-column void time was similarly determined by injecting sodium nitrate onto a zero dead volume connector.
3. Results and Discussion
3.1 Frontal Analysis Studies
Frontal analysis was first used to examine the overall binding of lidocaine to the HSA and AGP columns. In this method, a solution containing an analyte was continuously applied to the desired column and the resulting breakthrough was examined [12]. Eqn (1), which describes the binding by an analyte on a column with a single type of binding site, was used to initially examine these data.
| (1) |
In this equation, Ka is the association equilibrium constant for the binding of analyte A with the immobilized ligand L, and mLapp is the apparent moles of analyte required to reach the mean point of a breakthrough curve at a given concentration of applied analyte, [A]. If the data follows a 1:1 binding model, a plot of 1/mLapp versus 1/[A] according to Eqn (1) would be predicted to give a linear relationship in which the slope and intercept can be used to obtain Ka and the total moles of binding sites mL for the analyte [11].
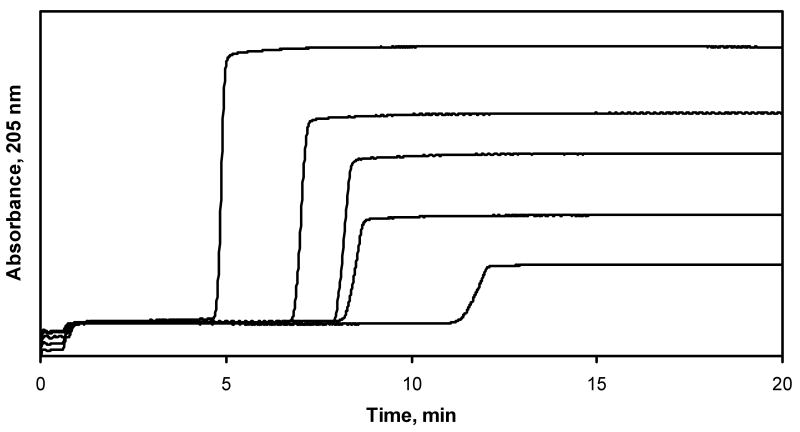
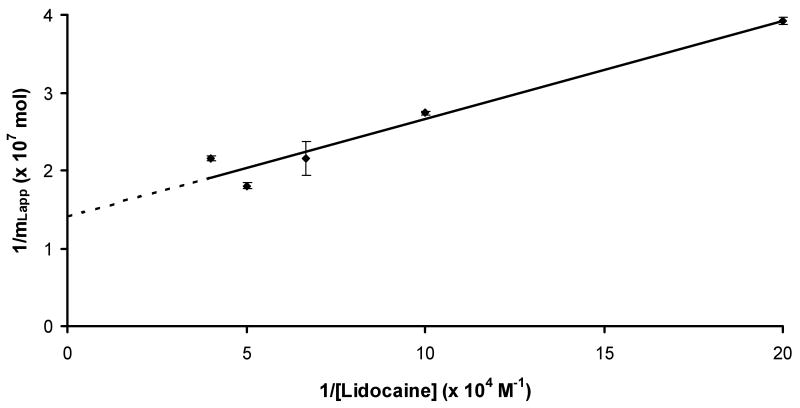
Some typical frontal analysis curves that were obtained for lidocaine on the AGP column are given in Figure 2. Similar curves were obtained for lidocaine on an HSA column, but with much earlier breakthrough times. Figure 3 shows the resulting graph that was obtained when a plot of 1/mLapp versus 1/[Lidocaine] was made according to Eqn (1) for the AGP column (relative standard deviation for mLapp: average, ±3.5%; range, ±0.4-10%). This plot was found to give a good fit to a 1:1 binding model over the range of lidocaine concentrations that were examined (r = 0.9766, n = 5). Similar agreement to a 1:1 binding model was noted for the binding of lidocaine to the HSA column (r = 0.9890, n = 5).
Figure 2.
Typical frontal analysis results for lidocaine on an AGP column. The lidocaine concentrations were (from left to right) 5, 10, 15, 20 and 25 μM. The flow rate was 0.5 mL/min and the temperature was 37 °C.
Figure 3.
Plots made according to Eqn. (1) for frontal analysis data obtained on an AGP column. The equation for the best fit line was y = 126 (± 16) x + 1.41 (± 0.17) × 107 (r = 0.9766).
The value of Ka that was obtained from Figure 3 for the binding of lidocaine to AGP was 1.12 (± 0.20) × 105 M-1. This value agrees with the range of values of 3.2 × 10⁴ to 1 × 10⁵ M-1 that have previously been reported for this interaction (see Ref. [20] and references therein). The binding capacity for this interaction was 7.1 (± 0.9) × 10-8 mol. This value corresponded to a specific activity for lidocaine of 0.46 mol/mol AGP, which was consistent with a single site binding model (note: not all of the immobilized protein may be active, which is why a value below one and in the range of 0.5 can often be obtained in such an analysis) [3,11]. The Ka estimated for lidocaine on the HSA column was 4.7 (± 0.1) × 104 M-1, which was consistent with relatively weak to moderate strength binding, as has been reported earlier for this system [22]. The binding capacity of the HSA column was 1.6 (± 0.5) × 10-8 mol for lidocaine, giving a specific activity for lidocaine of 0.47 mol/mol HSA; this behavior was also consistent with a lidocaine having a single type of binding site on HSA. From the values of Ka obtained for lidocaine on the AGP and HSA columns, the experimentally determined total changes in free energy (ΔG) for these interactions at 37°C were -7.2 (± 0.1) kcal/mol and -6.6 (± 0.1) kcal/mol, respectively.
3.2 Competition Studies
The binding of lidocaine with AGP and HSA was examined next by using zonal elution and competition studies with probe compounds having known binding regions on these proteins. In this type of experiment, the mobile phase contains a competing agent (I) which is applied to the column while small injections of the desired site specific probe (A) are made. If the analyte and competing agent have competition at a single type of site in the column, the following equation can be used to describe the shift in the retention factor (k) for the probe compound that will be produced.
| (2) |
In this equation, VM is the column void volume, KI is the association equilibrium constant for the competing agent at its site of competition with the analyte, [I] is the concentration of competing agent in the mobile phase, and all other terms are as defined previously. The value of k is calculated by using the relationship k = (tR − tM)/tM, where tR is the mean retention time observed for the analyte in the presence of a given concentration of competing agent and tM is the column void time (note: the use of the same units for tR and tM results in a value for k which is dimensionless). Eqn (2) predicts that a system with 1:1 competition will give a linear response for a plot of 1/k versus [I], with a slope and intercept that are related to the values of KI, Ka and mL [11].
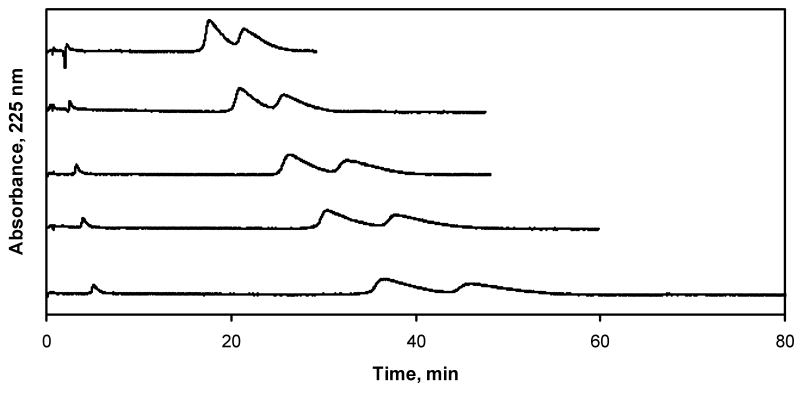
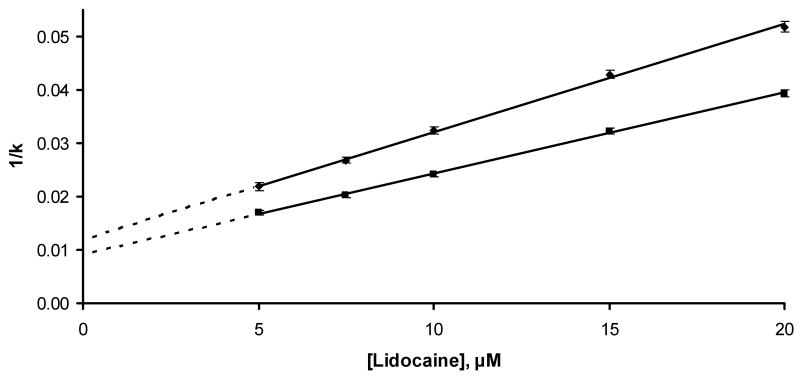
Competition studies on the AGP column were conducted in which propranolol was the injected probe [3,27] and lidocaine was the competing agent. Some typical chromatograms that were obtained are shown in Figure 4. The values of k that were measured in these experiments had an average relative standard deviation of ±3.3% (range, ±0.7-8%). Figure 5 shows that plots of 1/k versus [Lidocaine] were linear for both R- and S-propranolol on the AGP column (r = 0.9993-0.9995, n = 5). This result indicates that there was direct competition between lidocaine and propranolol for a single site on AGP.
Figure 4.
Chromatograms obtained for the injection of propranolol onto an AGP column in the presence of lidocaine as a mobile phase additive. The concentrations of lidocaine in the mobile phase (from top-to-bottom) were 20, 15, 10, 7.5, and 5 μM. These experiments were conducted at pH 7.4 and 37 °C.
Figure 5.
Plot made according to Eqn. (2) for injections of racemic propranolol on an AGP column in the presence of lidocaine in the mobile phase. The equation for the best fit line for R-propranolol was y = 0.00202 (± 0.00004) x + 0.0120 (± 0.0005) (r = 0.9993); the equation for the best fit line for S-propranolol was y = 0.00152 (± 0.00003) x + 0.0091 (± 0.0004) (r = 0.9995).
The Ka for lidocaine at its site of competition with propranolol was calculated by determining the ratio of slope and intercept from Eqn (2). This gave a value of 1.7 (± 0.8) × 105 M-1 when using either R- or S-propranolol as the probe. This result was statistically identical to the Ka value measured by frontal analysis and confirmed that the main binding site of AGP lidocaine was the same site involved in the binding of R/S-propranolol to this protein. This degree of binding corresponded to a calculated total change in free energy of -7.4 (± 0.2) kcal/mol at 37°C.
To determine the binding site of lidocaine with HSA, competition studies were carried out between lidocaine and warfarin or L-tryptophan. There was no shift in the retention of warfarin or any indication of competition as the concentration of lidocaine was varied in the mobile phase. This result indicated that lidocaine was not binding to Sudlow site I of HSA. However, the retention of L-tryptophan did change as the mobile phase concentration of lidocaine was altered. A plot made according to Eqn (2) gave a linear relationship for these results (r = 0.9243, n = 4), confirming that 1:1 interactions and direct competition was occurring between lidocaine and L-tryptophan at Sudlow site II of HSA. The Ka that was obtained for lidocaine at this case was 1.14 (± 0.2) ×103 M-1. Although this value was lower than that obtained by frontal analysis, it was indicative of weak binding and gave good agreement with previous observations made of the lidocaine-HSA interaction [22].
4. Conclusions
It was found by using HPAC that lidocaine has weak to moderate binding with HSA, with an estimated Ka in the range of 103 to 104 M-1. Lidocaine exhibited much stronger binding to AGP, with a Ka in the range of 1.1-1.7 × 10⁵ M-1. It was found that lidocaine interacted with AGP at the same site as propranolol. Competition results also indicated that lidocaine was binding to Sudlow site II of HSA but not to Sudlow site I. These results agreed with previous observations made in the literature [20,22] and provide a better understanding of how lidocaine binds to these serum proteins and is transported in the circulation. This work also illustrates how HPAC can be used to examine the binding of a drug such as lidocaine to both HSA and AGP and to provide detailed information on the binding sites and equilibrium constants that are involved in these interactions.
Acknowledgments
This work was supported by the National Institutes of Health under grant R01 GM044931 and was performed in facilities renovated under NIH grant RR015468.
Footnotes
Publisher's Disclaimer: This is a PDF file of an unedited manuscript that has been accepted for publication. As a service to our customers we are providing this early version of the manuscript. The manuscript will undergo copyediting, typesetting, and review of the resulting proof before it is published in its final citable form. Please note that during the production process errors may be discovered which could affect the content, and all legal disclaimers that apply to the journal pertain.
References
- 1.Otagari M. Drug Metab Pharmacokinet. 2005;20:309. doi: 10.2133/dmpk.20.309. [DOI] [PubMed] [Google Scholar]
- 2.Peters T., Jr . All About Albumin: Biochemistry, Genetics, and Medical Applications. Academic Press; San Diego: 1996. [Google Scholar]
- 3.Xuan H, Hage DS. Anal Biochem. 2005;346:300. doi: 10.1016/j.ab.2005.08.025. [DOI] [PubMed] [Google Scholar]
- 4.Ascoli GA, Domenici E, Bertucci C. Chirality. 2006;18:667. doi: 10.1002/chir.20301. [DOI] [PubMed] [Google Scholar]
- 5.Trainor GL. Ann Report Med Chem. 2007;42:489. [Google Scholar]
- 6.Trainor GL. Expert Opin Drug Discovery. 2007;2:51. doi: 10.1517/17460441.2.1.51. [DOI] [PubMed] [Google Scholar]
- 7.Hage DS. In: Handbook of Affinity Chromatography. Hage DS, editor. CRC Press/Taylor & Francis; 2005. [Google Scholar]
- 8.Sugio S, Kashima A, Mochizuki S, Noda M, Kobayashi K. Protein Eng. 1999;12:439. doi: 10.1093/protein/12.6.439. [DOI] [PubMed] [Google Scholar]
- 9.Sengupta A, Hage DS. Anal Chem. 1999;71:3821. doi: 10.1021/ac9903499. [DOI] [PubMed] [Google Scholar]
- 10.Husain N, Agbaria RA, Warner IM. J Phys Chem. 1993;97:10857. [Google Scholar]
- 11.Hage DS. J Chromatogr B. 2002;768:3. doi: 10.1016/s0378-4347(01)00482-0. [DOI] [PubMed] [Google Scholar]
- 12.Hage DS. J Chromatogr B. 2000;739:39. doi: 10.1016/s0378-4347(99)00445-4. [DOI] [PubMed] [Google Scholar]
- 13.Jia Z, Ramstad T, Zhong M. Electrophoresis. 2001;22:1112. doi: 10.1002/1522-2683()22:6<1112::AID-ELPS1112>3.0.CO;2-1. [DOI] [PubMed] [Google Scholar]
- 14.Estrada E, Uriate E, Molina E, Simon-Manso Y, Milne G. J Chem Inf Model. 2006;46:2709. doi: 10.1021/ci600274f. [DOI] [PubMed] [Google Scholar]
- 15.Gunturi SB, Narayanan R, Khandelwal A. Bioorg Med Chem. 2006;14:4118. doi: 10.1016/j.bmc.2006.02.008. [DOI] [PubMed] [Google Scholar]
- 16.Kakiuchi Y, Fukuda T, Miyabe M, Homma M, Toyooka H, Kohda Y. Int J Clin Pharmacol Therapeut. 2002;40:493. doi: 10.5414/cpp40493. [DOI] [PubMed] [Google Scholar]
- 17.Powell MF. Pharm Research. 1987;4:42. doi: 10.1023/a:1016477810629. [DOI] [PubMed] [Google Scholar]
- 18.McNamara PJ, Slaughter RL, Pieper JA, Wyman MG, Lalka D. Anesth Analog. 1981;60:395. [PubMed] [Google Scholar]
- 19.Cousins MJ, Carr DB, Horlocker TT, Bridenbaugh PO. Neural Blockade in Clinical Anesthesia and Pain Medicine. Lippincott Williams & Wilkins; Philadelphia: 2008. [Google Scholar]
- 20.Jia Z, Ramstad T, Zhong M. J Pharm Biomed Anal. 2002;30:405. doi: 10.1016/s0731-7085(02)00223-6. [DOI] [PubMed] [Google Scholar]
- 21.Goolkasian DL, Slaughter RL, Edwards DJ, Lalka D. Eur J Clin Pharmacol. 1983;25:413. doi: 10.1007/BF01037957. [DOI] [PubMed] [Google Scholar]
- 22.Krauss E, Polnaszek CF, Scheeler DA, Halsall B, Eckfeldt JH, Holtzman JL. J Pharmacol Exp Ther. 1986;239:754. [PubMed] [Google Scholar]
- 23.Ruhn PF, Garver S, Hage DS. J Chromatogr A. 1994;669:9. doi: 10.1016/0021-9673(94)80332-3. [DOI] [PubMed] [Google Scholar]
- 24.Mallik R, Xuan H, Hage DS. J Chromatogr A. 2007;1149:294. doi: 10.1016/j.chroma.2007.03.063. [DOI] [PMC free article] [PubMed] [Google Scholar]
- 25.Xuan H. Ph D Dissertation. University of Nebraska-Lincoln; Lincoln: 2006. [Google Scholar]
- 26.Kim HS, Mallik R, Hage DS. J Chromatogr B. 2006;837:138. doi: 10.1016/j.jchromb.2006.03.062. [DOI] [PubMed] [Google Scholar]
- 27.Xuan H, Hage DS. J Sep Sci. 2006;29:1412. doi: 10.1002/jssc.200600051. [DOI] [PubMed] [Google Scholar]


