

Abstract
New models of the gastric H,K ATPase in the E1K and E2P states are presented as the first structures of a K+ counter-transport P2-type ATPase exhibiting ion entry and exit paths. Homology modeling was first used to generate a starting conformation from the srCa ATPase E2P form (PDB code 1wpg) that contains bound MgADP. Energy minimization of the model showed a conserved adenosine site but nonconserved polyphosphate contacts compared to the srCa ATPase. Molecular dynamics was then employed to expand the luminal entry sufficiently to allow access of the rigid K+ competitive naphthyridine inhibitor, Byk99, to its binding site within the membrane domain. The new E2P model had increased separation between transmembrane segments M3 through M8, and addition of water in this space showed not only an inhibitor entry path to the luminal vestibule but also a channel leading to the ion binding site. Addition of K+ to the hydrated channel with molecular dynamics modeling of ion movement identified a pathway for K+ from the lumen to the ion binding site to give E2K. A K+ exit path to the cytoplasm operating during the normal catalytic cycle is also proposed on the basis of an E1K homology model derived from the E12Ca2+ form of the srCa ATPase (PDB code 1su4). Autodock analyses of the new E2P model now correctly discriminate between high- and low-affinity K+ competitive inhibitors. Finally, the expanded luminal vestibule of the E2P model explains high-affinity ouabain binding in a mutant of the H,K ATPase
P2-type ATPases (ion pumps) catalyze active ion transport by coupling autophosphorylation and dephosphorylation to ion movement across lipid bilayers. The Na,K ATPases and the gastric H,K ATPase couple outward transport of sodium or protons to the inward transport of potassium. They are distinguished from the other members of this family by the presence of a glycosylated β subunit tightly bound to the larger catalytic (α) subunit and by the need for K+ on their luminal surface for completion of the catalytic cycle. There is about 62% homology between their α subunits and about 35% homology between the gastric β subunit and the Na,K ATPase β2 isoform (1). The α subunits contain the known binding sites for ATP, ions, and inhibitors. Several avenues of research have defined the biochemical features of the shared transport mechanism (2). Transport is achieved through a series of conformational transitions which alternatively bind the transported ions from the cytoplasm in the E1 form or from the lumen after autophosphorylation from ATP to give the E2P conformer. Conversion to E2P is associated with export of the outbound cation with generation of luminal acid in the case of the H,K ATPase. For Na,K and H,K ATPases binding of potassium activates dephosphorylation to give a state with tightly bound ion (E2K occluded) in equilibrium with the E1 state (E1K) from which the ion dissociates to the cytoplasm to complete the cycle. The final step is accelerated by the binding of MgATP at a low-affinity site whose Km,app is well below the ~3 mM ATP levels found in the parietal cell, ensuring continual saturation of this site (3).
The clinically significant specific inhibitors of the Na,K and H,K ATPases bind at the luminal face of their E2P conformations. Ouabain and other cardiac glycosides inhibit only the Na,K ATPase, and the ouabain analogue, digoxin, is used as a therapeutic agent in the treatment of heart disease. However, it has recently been shown that replacement of a specific set of seven amino acids confers ouabain sensitivity to the gastric H,K ATPase (4), whereas five are sufficient in the case of the nongastric H,K ATPase (5). This represents a small fraction of the residues surrounding the binding site cavity and emphasizes the generally conserved folding of the backbone in this region. The pyridylmethylsulfinylbenzimidazoles (proton pump inhibitors, PPIs), such as omeprazole1 and pantoprazole, are in use as primary therapy for acid-related diseases (6). These compounds are prodrugs that are acid-activated on the luminal side of the enzyme and then form disulfide bonds with specific cysteines in the membrane domain of the H,K ATPase. Their covalent binding sites have been chemically defined, and all of the PPIs bind to Cys813 at the beginning of transmembrane segment 6 (M6), thus identifying an accessible binding space in this region (7). A different class of acid pump inhibitors, such as imidazo[1,2-a]pyridines like SCH28080 (8), are reversible K+ competitive inhibitors that do not require acid activation and show more complete acid suppression and faster onset of inhibition than the PPIs. An important goal is accurate description of the high-affinity binding site of these reversible inhibitors as the foundation for structure-based drug design. The active conformation of SCH28080 has been identified (9), and the rotationally restricted naphthyridine, Byk99, that mimics this structure was therefore used in combination with homology modeling to define inhibitor access and binding in a new E2P model of the H,K ATPase.
The homology modeling approach has been used to construct heuristic models of the catalytic subunits of the H,K and Na,K ATPases by using the peptide backbone of the srCa ATPase as the initial template since this is the only P2-type ATPase that has been amenable to high-resolution crystal analysis (10–12). Although the derived structures are unlikely to be correct in detail because of their sequence differences and the absence of the β subunit and lipid, they nevertheless can provide important insights and predictions, many of which have been substantiated by empirical results.
The srCa ATPase is ~29% homologous to the Na,K and H,K ATPases and is a single polypeptide that transports Ca2+ outward into the sarcoplasmic reticulum and returns protons to the cytoplasm at a ratio of 2Ca2+/2H+ (13). Several conformations of this enzyme have been crystallized at high resolution (14–19) in the presence of various ions, ligand homologues, and inhibitors. These structures have identified many of the conserved molecular features and domains of the catalytic subunit. The cytoplasmic side of the enzyme consists of the P domain containing the conserved site of phosphorylation, the nucleotide binding N domain, and the A (actuator) domain whose orientation responds to the state of phosphorylation and nucleotide binding. Ten predominantly helical membrane spans, M1 through M10, form the membrane domain. Spans M8 to M10 show relatively small changes in the known conformations and may serve primarily to stabilize the depth and orientation of the polypeptide with respect to the lipid. Span M7 is more inclined with respect to the plane of the membrane in the E1 than in the E2 conformations. Spans M5 and M6 show small but crucial structural changes in the different conformations, especially in the vicinity of the ion binding site. Spans M1 to M4 undergo large rearrangements associated with changes in ion affinity and accessibility. The M5/M6 pair is between the M1 to M4 and M7 to M10 segments, providing an interface between the moving and less mobile domains. The side chains that bind Ca2+ have been identified unambiguously in M4, M5, and M6. Conserved or similar amino acids are present in all of the P2-type ATPases, suggesting a conserved location for the ion transport site(s), and this has been confirmed by site-directed mutagenesis (20–25).
Considerable effort in the past decade utilizing several site-directed mutations and analysis of chimeras has supported many other structure–function generalizations for the P2-type ATPases (2, 26, 27). The rearrangement of the three cytoplasmic domains in the E1 to E2 transition and the associated changes in the orientation of the membrane helices implied by the various srCa ATPase crystal structures are believed to be generally conserved (28, 29). This assumption has provided the foundation of structure–function analyses for the potassium counter-transport ATPases (12, 26, 30, 31).
Our previous homology model of the H,K ATPase (11) was based on the backbone of srCa ATPase in the E2 state (PDB code 1iwo) (18), the only E2 conformer available at that time. This form is unphosphorylated, and thus a hypothetical E2P model was generated by addition of phosphate at the active site to mimic the HAD protein, phosphoserine phosphatase, to account for binding of K+ and the K+ competitive inhibitors to the E2P conformation in the H,K ATPase. Energy minimization with Byk99 docked to the model gave a site supported by an array of data including site-directed mutagenesis, disulfide cross-linking, inhibitor QSAR, and photoaffinity labeling (32). The model identified I332, A335, L809, P810, L811, C813, and I816 as contributing to the competitive inhibitor binding site since mutation of these residues decreased SCH28080 affinity measured in ATPase assays of mutant membranes. This demonstrated the validity of the homology modeling approach.
However, a significant problem of this model for the naphthyridines in the E2-based model was that the path to the binding site from the extracytoplasmic space was too narrow to allow free inhibitor access. Inhibitor entry was assumed to result from random motion within the membrane domain, and this would lead to induced fit binding. This interpretation led to unsuccessful predictions for inhibitor structure–activity relationships. In particular, large decreases in experimentally determined affinity upon the addition of only a single methyl group to the bridge nitrogen of the naphthyridine, Byk99, were not predicted by the model if the protein backbone was allowed to move during energy minimization with various naphthyridine derivatives oriented in the site as defined by the mutational analyses. The E2P conformation of the H,K and Na,K ATPases is stable in the absence of K+ in contrast to the srCa ATPase, suggesting a relatively rigid access path from the luminal vestibule to the ion occlusion site more than 10 Å away. The model therefore required modification to explain inhibitor and ion entry and improve the prediction of inhibitor specificity while maintaining the backbone fixed.
The publication of a crystal structure for the srCa ATPase with bound MgF42− and thapsigargin to give the E2P homologue (PDB code 1wpg) has now provided a backbone template for improved homology modeling of the E2P conformation (11). The structure published for the srCa ATPase in E2P (PDB code 1wpg) (33) has significant differences from the E2 structure on which our initial model was based (11) including changes in the orientations of the cytoplasmic domains, inclusion of bound MgADP at the interface of N and A domains, and an enlarged luminal opening into the membrane domain. For the K+ counter-transport pumps E2P must allow for both the escape of the outward moving ion (sodium or hydronium) and for the passage of luminal K+ to the ion occlusion site. There is no open path in the PDB 1wpg structure from the ion site to the lumen, however, and it has been suggested that this structure represents the product-bound state, E2·P, in which Ca2+ has been released to the lumen, the ion sites have incorporated protons for counter transport, and the luminal gate has been closed (34). Nevertheless, the PDB 1wpg form has bound MgADP which is associated with an expanded luminal vestibule compared to the previously published E2 conformation (PDB code 1iwo). Therefore, the PDB 1wpg amide backbone was utilized as a starting template for improved homology modeling of the H,K ATPase E2P conformation. After constructing a model based on the PDB 1wpg backbone, however, the luminal vestibule required further expansion to explain access of the K+ competitive naphthyridines to the empirically defined binding site for these specific inhibitors of the H,K ATPase (35). This was done by applying steered molecular dynamics to extract the inhibitor from the binding site to the extracytoplasmic space outside the entrance to the luminal vestibule. The reverse movement would account for entry, and the most open conformation observed would allow undistorted passage of the inhibitor. This conformation was further energy minimized to give the new E2P model for the H,K ATPase.
Several of the structural insights derived from this new model are presented. Similarities in the binding domain for the adenosine moiety are identified, but major differences in the region of the A domain contacting the polyphosphate group are predicted in the H,K ATPase model. There was also an enlarged entry into the membrane domain comprised of a luminal vestibule and an access path to the ion occlusion site which was then hydrated, and this allowed evaluation of the access path of inhibitors or ions from the luminal face to their sites of binding in the presence of water. Access and binding to give elimination of water from the hydrophobic surface of the inhibitor were defined for Byk99, and its predicted docking site was supported by separate Autodock analysis. The Autodock program applied to the rigid model now predicted the lower affinity for the methylated derivative of Byk99, Byk73. Short molecular dynamics and energy minimization identified the occluded state, E2K, based on the E2P model and accounted for the nature of the exclusive (competitive) binding of K+ and the reversible class of inhibitors. The new model also gives insight into the site of high-affinity ouabain binding generated in the H,K ATPase by mutation of residues in the membrane domain (4).
A second model was generated for the H,K ATPase catalytic subunit in an E1K+ conformation by homology modeling based on the E12Ca2+ conformation of the srCa ATPase (PDB code 1su4) (36). Hydronium and K+ were used to replace Ca2+ at site I and site II, respectively. A path for K+ exit from site II to the cytoplasm was predicted from the model to account for K+ passage to the cytoplasm under turnover conditions and K+in/K+out exchange in sealed vesicles catalyzed by the H,K ATPase (37). The path was based on brief molecular dynamics and the effects of mutation of conserved residues in close proximity to the presumed gating residue, E343.
EXPERIMENTAL PROCEDURES
General Modeling, Rigid Body Rotation, and Energy Minimization
Model building and short molecular dynamics runs (<0.2 ns) were performed on a Silicon Graphics Indigo O2 computer with Insight II and Discover 2000 software from Accelrys Inc., San Diego, CA, utilizing the consistent valence force field. Energy minimization was carried out to an average absolute derivative of less than 0.1 kcal/ (mol·Å). Short molecular dynamics simulations were at 310 K with 1 fs time steps, fixed dielectric constant of 15, and 15 or 23 Å nonbonded cutoffs for ion or inhibitor simulations, respectively. Temperature was equilibrated for 200 fs before data collection at 200 fs intervals over the time lengths between 0.1 and 0.2 ns.
The sequence alignment used for homology modeling was the same as previously described (11). The model does not contain the first 48 (amino-terminal) nor the last 8 (carboxy-terminal) residues because the srCa ATPase sequence lacks these extensions compared to the H,K ATPase. As before, the new models substituted the peptide backbone of the crystallized N domain from the Na,K ATPase α2 isoform (PDB code 1q3i) for that of the srCa ATPase because sequence alignments do not predict the correct structural alignment in this domain (38). Loops not specified by the PDB 1q3i structure were added according to the NMR-based structure (39) of the rat N domain (PDB code 1mo7). Initial side chain dihedral angles were assigned on the basis of the allowed ranges found in high-resolution structures (40) and the β1 angles in helices according to the preferences of each side chain type (41).
Homology Modeling of the H,K ATPase in E2P
The backbone template for the new E2P H,K ATPase model was the srCa ATPase crystallized with MgF42− at the active site to give an E2P homologue (PDB code 1wpg) containing bound MgADP. This conformation represents an improved template for modeling inhibitor access from the luminal side of the H,K ATPase owing to its expanded luminal vestibule. This can be shown by comparing PDB code 1wpg to PDB code 2agv (42), a more highly resolved structure nearly superimposable with PDB 1iwo (overall RMS for all backbone atoms of 0.83 Å). The PDB 2agv structure is of sufficient resolution to define it as the likely ion occluded counter-transport form of E2 in the srCa ATPase (42) and should be more homologous to the K+ occluded form of the H,K ATPase.
The reasons for luminal expansion in PDB code 1wpg compared to PDB code 2agv are relevant to the homology approach employed to model the H,K ATPase. Comparison of the two srCa ATPase structures is made by superimposing the closely matched backbones of the M5/M6 membrane pair from N755 to N810 (RMS of 0.35 Å). The interface between N and A domains in PDB code 2agv shows several charge pairs whereas these interacting surfaces are widely separated by bound MgADP in PDB code 1wpg. This important difference changes the position of the A domain and raises the M1/M2 helix pair by 1–1.5 Å compared to PDB code 2agv. This in turn lifts M4, resulting in an outward displacement of the lower half of the M4 helix by ~2.5 Å and an associated shift in the M3 helix of ~1 Å laterally, thus enlarging the luminal opening leading to the M5M6 loop.
The movement of the M1/M2 helix pair is coupled to that of M4 by crossover of the M1 and M4 helices where I71 (M1) is interposed between F296 and V300 (M4) in the srCa ATPase. Mutation of the corresponding residue, I119, in the H,K ATPase caused loss of activity (see Table 1). In addition, there is a significant change in the conformation of the M3/M4 loop. The elongated helix at the start of M4 from W288 to Y295 in PDB code 2agv becomes nonhelical in PDB code 1wpg and is displaced outward to enlarge the luminal vestibule. In contrast, the M5 to M10 backbones vary less than 0.5 Å in the two structures. The size of the luminal opening in the srCa ATPase is thus dependent on changes in the positions of helices M1 to M4 and the configuration of the large M3/M4 loop.
Table 1.
Effects of Side Chain Mutation in the Membrane Domain on the H,K ATPasea
| location | mutant | Ki[SCH] (nM) | type of inhibition | Vmax (μmol mg−1 h−1) | Km,app[NH4+] (mM ± SE) |
|---|---|---|---|---|---|
| wtd | 64 ± 11 | comp | 132 ± 3 | 2.4 ± 0.1 | |
| M1 | M113L | 86 | comp | 36 | 0.26 ± 0.04 |
| M113C | 98 | comp | 31 | 2.7 ± 0.2 | |
| I119L | 31 | 2.8 ± 0.2 | |||
| I119A | inactive | ||||
| M2 | L141C | 261 | comp | 11 | 2.2 ± 0.9 |
| L145F | ND | 1–2 | 3.6 ± 0.4 | ||
| Q159E | 132 | mixed | 12 | 6.0 ± 1.7 | |
| Q159N | 233 | comp | 34 | 3.6 ± 0.8 | |
| E160Q | 23 | comp | 35 | 0.3 ± 0.1 | |
| E160D | 168 | comp | 45 | 1.1 ± 0.1 | |
| M4 | R328E/Y324Cd | 493 | mixed | 22 | 0.7 ± 0.3 |
| V331Fd | 48 | mixed | 68 | 1.0 ± 0.1 | |
| F332Id | 4000 | mixed | 14 | 4.5 ± 1.4 | |
| A335Gd | 16 | comp | 31 | 3.4 ± 0.3 | |
| A335Sd | 1200 | comp | 30 | 3.5 ± 0.4 | |
| A335Cd | none | 67 | 2.5 ± 0.3 | ||
| A335C/C813Ad | 40000 | comp | 69 | 3.8 ± 0.3 | |
| M5 | K791Sb | 1325 | comp | 7 | 4.7 ± 0.3 |
| E795Db | 700 | comp | 10 | 8.1 ± 2.6 | |
| Y799S | inactive | ||||
| M5/6 loop | L809Fc | 6150 | noncomp | 89 | 1.9 ± 0.3 |
| P810Gc | 563 | comp | 109 | 2.4 ± 0.2 | |
| L811Fc | 625 | mixed | 113 | 2.0 ± 0.1 | |
| G812I | inactive | ||||
| M6 | C813Tc | 586 | comp | 40 | 6.6 ± 1.8 |
| I816Lc | 309 | noncomp | 31 | 1.4 ± 0.4 |
The large M3/M4 loop does not appear to be a feature of the H,K ATPase, however. The M3/M4 loop in the srCa ATPase has 10 more residues than this loop in the H,K ATPase. The same orientations in the M3 and M4 helices could be preserved in the H,K ATPase model simply by adding an additional helix turn in M3 involving hydrophobic residues A319MCI and constructing a three-residue turn with G323YT where T325 acts as the initiator of the M4 helix. In this structure, the tight M3/M4 loop of the H,K ATPase enlarges the luminal space due to displacement of the M1 to M4 helices while allowing helix contact surfaces with the lipid homologous to those of the srCa ATPase.
The original model (11) was first aligned with PDB code 1wpg by superimposing peptide backbone coordinates in the homologous M5 and M6 segments. Then the N, A, P, M1, and M2 domains were isolated by severing the appropriate peptide bonds and overlaid onto the template (PDB code 1wpg) using a minimum RMS deviation in the backbone atoms corresponding to homologous sequences as defined in the alignment utilized for the original model building (11). After these rigid body rotations, the connecting segments were added back in positions that matched those of the srCa ATPase, and the peptide bonds were re-formed. MgF42− at the active site in PDB code 1wpg was replaced with Mg2+ and an acyl phosphate moiety covalently linked to D385.
As a further structural constraint, the naphthyridine inhibitor Byk99 (Figure 1) was docked manually in the new model at the site defined by biochemical and mutational data (11), and the structure was energy minimized with hydrogen bond distance restraints on all helix segments.
Figure 1.

Structure of the imidazopyridine, SCH28080 (left), and the naphthyridines (right) referred to in the text as Byk99 where R8 is H and as Byk73 where R8 is CH3. The ethylenediol bridge greatly reduces the rotational freedom in the naphthyridines in comparison to the unbridged imidazo[1,2-a]pyridines such as SCH28080.
Modification of the Model To Account for Inhibitor Access
After energy minimization, the cytoplasmic domains were aligned with the srCa ATPase, and the docking site was more open to the lumen than in the earlier model as outlined above but still insufficient to allow inhibitor entry without high-energy distortion of its structure. Therefore, a procedure was devised to account for inhibitor access that employed molecular dynamics to modify the model using a V331F mutant. This substitution was made because V331 was in the inhibitor entry path in the model based on the E2P PDB 1wpg structure, but its replacement by a V331F mutation had no effect on either ion or inhibitor affinity despite the larger side chain (11). Although this result suggests a deficiency in the srCa ATPase backbone as a template for the H,K ATPase in the luminal half of M4, the increased separation between the M1 to M4 helices required to account for the results of this mutation is small. A modification of this separation is supported by the variability in different E2 conformations of the srCa ATPase as outlined above.
A simple modeling procedure was applied to account for the lack of an effect of the V331F mutation and to give adequate inhibitor access. Here the aim was to alter the structure as little as possible to maintain homology with the srCa ATPase. The success of the resulting derived model in explaining a variety of empirical results related to ion movement and mutations in the membrane domains of H,K and Na,K ATPases (detailed below) suggests the validity of the chosen approach.
The model with the bulky V331F substitution was subjected to molecular dynamics in the absence of water while a 20 kcal/mol steering force was applied to extract the naphthyridine, Byk99, from its docking site by minimizing the distance between the bridgehead carbon of the inhibitor and a fixed point 20 Å away in the middle of the vestibule opening. This resulted in moving the relatively rigid naphthyridine to a point in the vestibule which is open to the extracytoplasmic space. During the run, the cytoplasmic domains, the cytoplasmic half of M4, and M7 to the C-terminus were fixed to maintain homology with the srCa ATPase PDB 1wpg form. As discussed above, the M3/M4 loop appears to be too short to provide increased luminal access by changing conformation in the H,K ATPase. This suggested that only a change in the tilt of the M4 helix (and, to a lesser extent, the M3 helix tilt and shift in the position of the M1/M2 helix pair) would enlarge the opening in the H,K ATPase. Membrane proteins uniformly preserve hydrogen-bonding potential in their lipid domains. Therefore, in order to prevent severe distortion of the M1 to M6 helices and loss of hydrogen bonding during extraction of the inhibitor, uniform helix geometry was maintained by applying two sets of distance restraints, one set of 3.0 Å between n and n + 4 acceptor/donor pairs and a second of 3.1 Å from the helix carbonyl oxygens to their n + 3 backbone amide nitrogens. This procedure maintained hydrogen bond geometry in the nonfixed membrane helices as observed in the matching sequences of the srCa ATPase while a progressive change in their tilt angles expanded the luminal entry and allowed transit of the rigid inhibitor. Hence, restrained helical geometry in the M1 to M6 transmembrane segments combined with the rotational motion of the inhibitor during its transit to the external point resulted in increased separation of helices M1 to M4.
Mutational analysis suggested that the helix crossover point conserved from the srCa ATPase between the M1 and M4 helices (I119 in M1 interposed between M330 and M334 side chains in M4) is important for H,K ATPase activity, and the molecular dynamics procedure maintained this contact. The structure achieving the widest spread corresponded to the tightest fit for the inhibitor entry and this was selected for energy minimization after replacing F331 with the wild-type valine to give the final model as shown in Figure 2. This model was hydrated between the membrane helices as detailed below and investigated for its ability to account for ion transit from the luminal vestibule to the ion occlusion site and inhibitor entry to its docking site now in the presence of explicit water. Ion and inhibitor selectivity was assumed to require a rigid conformation, and therefore, all atoms in the cytoplasmic domains, as well as the backbone in the remainder of the protein, were held rigid in simulations using the hydrated E2P model. This included an inhibitor entry simulation (see Figure 5) again utilizing the V331F substitution.
Figure 2.

(A) The srCa ATPase backbone template (PDB code 1wpg, pink ribbon) is overlaid on the H,K ATPase E2P homology model (white) to identify regions of structural alignment and divergence. Altered positions for transmembrane segments M3 and M4 (blue and green ribbons, respectively) are highlighted by lines representing the helix axes. The cytoplasmic entry into M7 (gold ribbon) is also changed. (B) The domain structure of the H,K ATPase model is color coded and the approximate position of the bilayer illustrated with space-filling models of dipalmitoylphosphatidylserine. Transmembrane segments are colored from the N- to C-terminus, and this color scheme is maintained in all figures with M1 in dark blue, M2 in cyan, M3 in light green, M4 in green-blue, M5 in light yellow, M6 in dark yellow, M7 in light brown, M8 in dark brown, M9 in light red, and M10 in dark red. The position of the ion binding site is close to the middle of the membrane (ball and stick). The proposed ion and inhibitor entry (arrow) on the luminal face between M1M2, M3M4, and M5M6 shows significant divergence from the srCa ATPase structure. This space was expanded by the modeling procedure to account for free inhibitor access to the binding site next to the M5M6 loop. ADP and Mg2+ occupy the space between the N and A domains which also exhibit significant divergence at this interface.
Figure 5.

Energy-minimized structures from a molecular dynamics simulation of Byk99 (white and blue stick) movement into the inhibitor binding site. The panels show transit from the extracytoplasmic space to the luminal vestibule and then to the predicted binding site from (A) to (B) to (C) using the H,K ATPase model with phenylalanine replacing V331. Water present during molecular dynamics is not shown for clarity. Ion binding site residues shown in stick format are K791, E343, E795, and E820. The imidazo[1,2-a]pyridine ring inserts (C) into a hydrophobic pocket between Y799 and F332 (stick) on one side and L809, P810, and L811 (space filling) on the other. While entering the binding site the phenyl ring became nearly coplanar (not shown) with the imidazopyridine ring to fit between A335 (small space filling) and C813 (arrow in panel B and the C813 side chain in gold space filling) and then finally had a slanted orientation while bound between I816, A335, and L141 (panel C). Side chains that come into close contact with the inhibitor during approach to the binding site are Q127 and L809 (red circles, panel B). This entry path is consistent with the lack of effect of the V331F mutant and the 80-fold and 100-fold loss in affinity in the Y799A (55) and L809F (50) mutants, respectively, and complete inhibitor insensitivity in A335C (11). M3 is omitted for clarity.
Hydration of the H,K ATPase Model To Explore Inhibitor Entry and Ion Pathways
Hydration was accomplished by using the SOAK module of the Insight II program. A water-filled sphere of radius 17 Å centered on the carbonyl oxygen of L811 was created to fill the vestibular space. This also filled the space between M4, M5, M6, M7, and M8, resulting in an apparent water channel terminating near the proposed ion occlusion site. Molecular dynamics was used to investigate ion movement and inhibitor entry with explicit water to define the accessible space in the channel and observe dehydration of the ion and inhibitor as they moved from the bulk solvent into their binding sites on the protein. A second sphere of water was added in a range from 17 to 24 Å using the same atom as the center of the sphere as before. At the beginning of each simulation, the ion or inhibitor being investigated was energy minimized with all of the water in the system. The outer sphere was then fixed during dynamics while the inner sphere water was allowed to move as part of the simulation. This technique prevented random, thermal expansion of the water into the vacuum surrounding the model during dynamics and maintained a constant volume solvent system in the vestibule and channel where the inhibitor and ion interacted with the protein during the simulations.
The purpose of the initial, short molecular dynamics runs was to examine the ability of the new E2P conformation to provide an ion channel and discriminate inhibitors as a rigid structure. Therefore, during the dynamics simulation of ion or inhibitor movement, all of the following were held fixed; the A, N, and P cytoplasmic domains, M7 to the C-terminus, and the backbone atoms from M1 to M6. The aim was to examine the E2P conformation with movement only permitted for the inner sphere water, the ion or inhibitor, and the side chains of M1 to M6. Pathway simulations were run for 0.1 ns with K+ placed initially either in the luminal vestibule, in the water-filled channel above the M5M6 loop, or in the proposed occlusion site. In one molecular dynamics run a small steering force was used to move the ion past the M5M6 loop (force constant of 1.0 kcal/mol) and then was eliminated to allow unrestrained movement for 0.1 ns to examine the accessible space in the channel. Structures were recorded every 200 fs, and the positions shown for ion movement in Figure 7 were identified in these structures. The ion pathway is illustrated as linear in order to summarize the data although the actual ion trajectories were more random.
Figure 7.

K+ movement in the E2P model of the H,K ATPase predicted by short (0.2 ns) molecular dynamics runs. Water present during the modeling is not shown except in (D). Panel A: Most stable (e.g., occluded) K+ site conformation. The site shows ligand interactions (white lines) in a distorted octahedral arrangement and the position of N792 stabilized by hydrogen bonds to the backbone carbonyl of Y340 and the side chain of T788 (blue arrows). Hydronium (H3) associated with E343 would be replaced by water, pH 7. The β-branched side chain of I825 is a major change from the srCa ATPase which has glycine, and this results in the displacement (yellow arrow) of the expanded helix turn in M6. Panel B: K+ (sphere) enters the channel (side chains in stick and surfaced) over the M5M6 loop at G812 (α carbon as space filling). The distance from C813 to L141 (blue arrow) is consistent with disulfide formation observed in the L141C mutant. A hydrogen bond (line) between T815 and G812 is predicted to stabilize the first turn in M6 and orient the G812 carbonyl for K+ entry between L809 and G812 (arrow). The corresponding position is more constricted in the srCa ATPase. Panel C: K+ path in the channel up to the point just before entry into the occlusion site in the nonhelical part of M4. K+ (sphere) starts in the luminal vestibule, passes over M5M6, moves up the channel on the M5 surface containing P798 and P794, and then crosses to the point between E795 and E820 before entering the occlusion site. After passing over the M5M6 loop, the ion is guided by I816 to the inner surface of M5 (upper arrow, panel B) where the dominant interaction was with the backbone oxygen of P794 which is freed of helix hydrogen bonding by the presence of P798 (Figure 7C). Approach to the transport site was from under K791 where the ion moved horizontally under the influence of the negative charge density contributed by D824, E795, and E820 (panels C and D). The last two positions shown for K+ in panel C show this movement prior to entering the occlusion site on the nonhelical segment of M4. Panel D: K+ path in the upper portion of the channel into the occlusion site. Ion positions are shown from molecular dynamics simulations of K+ movement from the hydrated channel (K1 to K3) to the occlusion site (K4 striped sphere). Waters (red spheres) were relatively stable during the 0.2 ns run, varying only an average of 1 Å from the positions shown. K+ at position K2 representing approach to the occlusion site (K4) was associated with the vertical orientation of the E820 carboxyl (E2). With the ion more distant (K1) or passing under E820 (K3) to approach the carbonyl oxygen of V338, the carboxyl was in a horizontal orientation (E1 and E3, respectively). The most stable position was K4 in which the E820 carboxyl group was slanted (E4) and both oxygens were ion ligands.
Homology Modeling of the H,K ATPase in E1K
A procedure similar to that described for E2P modeling was used to construct a model for the E1K conformation of the H,K ATPase using the same sequence alignment but the backbone of the srCa ATPase in E12Ca2+ (PDB code 1su4), the higher resolution version of PDB code 1eul that now identifies bound water [see structure deposition by Toyoshima et al. (33)]. This unphosphorylated conformation of the srCa ATPase has the ions surrounded by protein ligands, and the ion site is in the presumed occluded state. The subdomain structures of the N and A domains vary little in the known conformations of the srCa ATPase. Therefore, the N and A domains from the E2P model were first isolated as separate subdomains and matched to the homologous structural regions of the srCa ATPase as rigid bodies. Then the P domain, membrane domain, and the segments connecting them were reconstructed to match the coordinates of the conserved sequences in PDB code 1su4. Hydronium and K+ were substituted in the positions of Ca2+ in sites I and II, respectively, and energy minimization was performed to give an E1H3O+K+ model, designated here as E1K.
The PDB 1su4 structure shows two features relevant to modeling a possible exit path to the cytoplasm in the derived H,K ATPase E1K model. First, there is significant free space adjacent to ion site II bounded by M1, M2, M4, and M6 that appears to extend to the cytoplasm based on the lipid boundaries defined for the srCa ATPase (19). Second, part of this space shows the presence of seven tightly bound structural water molecules between M1, M2, and M4 in PDB code 1su4 that define an approximately linear path from E309 toward the cytoplasm. On the basis of these features, the E1K model was used to propose a possible path for K+ return to the cytoplasm from the hydrated form of E1K as the final step in the 1H3O+/1K+ counter-transport mechanism under conditions of high luminal acidity that occur in vivo. Here, the conformation allowing access to site II was assumed to be very similar to PDB code 1su4, and ion exit would require only small changes in the membrane domain and reorientation of E343, the presumed gating residue.
As in PDB code 1su4, there was free space between M1, M2, M4, and M6 outside the gating residue opposite ion site II in the E1K model. This space was filled using the SOAK software as described above by defining two spheres of water molecules centered on K+ in site II. An exit path for K+ into the hydrated space was generated by using brief restrained molecular dynamics (0.1 ns) with the inner sphere waters unrestrained and the outer waters fixed. The cytosolic domains and membrane segments not containing side chains in the ion site (M7, M8, and M10) were held fixed while the remainder of the membrane domain was allowed to move, subject only to restraints on hydrogen bond geometry in the helices as described above. The side chain of E343 provides a ligand in site II in the E1K model and had to be displaced to allow the ion to exit. This was done by using a distance restraint (force constant of 30 kcal/mol) to force its side chain oxygens within hydrogen bond distance of Q159 (3.3 Å). The residue corresponding to E343 in the srCa ATPase, E309, shows different orientations in separate but nearly identical E2 models of the srCa ATPase (PDB code 1iwo and PDB code 2agv) resulting in almost opposite orientations of E309, one pointed toward the ion site and one away from it. This demonstrates the flexibility of the E309 orientation at least in the E2 conformations of the srCa ATPase and provides a rationale for the steered movement of E343 in the H,K ATPase structure. K+ exit into the hydrated space opposite E343 was then accomplished by imposing a steering force of 10 kcal/mol.
Molecular Dynamics of the E2·2K Conformation
A 10 ns simulation of the H,K ATPase E2·2K model inserted into an ionized, solvated lipid bilayer was performed, with two K+ ions at the predicted location of the occlusion site. The primary purpose of the run was to evaluate the stability of the model and its subdomains. Setup of the simulation involved the initial use of a 110 × 110 Å POPC (1-palmitoyl-2-oleoyl-sn-glycerophosphatidylcholine) bilayer slab, with water molecules positioned to hydrate the headgroups. This was created using the Membrane package in VMD (43). This preliminary bilayer [consisting of 326 POPC molecules (163 in each leaflet) and 5529 water molecules] was then relaxed by steepest descent minimization for 100 steps and equilibrated in molecular dynamics for 0.5 ns, in order to optimize the lipid–lipid and lipid–water packing.
The H,K ATPase model was then inserted into the center of the bilayer, and all overlapping lipids and waters were removed. The aromatic girdle residues were lined up with the plane and perimeter of the membrane. The system was then fully solvated to a box size of 110 × 110 × 140 Å by using Solvate (44). Counterions were added to neutralize the charge on the protein with enough extra Na+ and Cl− ions to give a 0.1 M solution. The system was relaxed for 100 steps followed by an equilibration molecular dynamics run lasting 0.5 ns with the positions of the heavy atoms of the protein restrained to their initial positions throughout. During the equilibration, the temperature was raised from 10 to 310 K, under constant pressure conditions. This restrained run allowed the water and lipid to relax around the protein. Images were prepared and analysis was done using VMD.
This simulation was run using the CHARMM force field (45) (version 27 for lipid and protein) in NAMD (46) with a nonbonded cutoff of 9 Å. The restrained equilibration (0.5 ns) and production run (10 ns) were maintained at 310 K by using Langevin temperature coupling and at constant pressure by using a Langevin piston. PME electrostatics settings were applied. The SHAKE algorithm (47) was used to average hydrogen vibrations, alongside a 2 fs time step. TIP3P water was used. The run was conducted on the 512 processors of the MCR machine at the Livermore Computing Center. MCR is a 2304 processor Intel Xeon machine. Preparation, visualization, and analysis of the data were performed on a Polywell AMD64 dual processor machine running Red Hat Linux.
Inhibitor Binding Using Autodock
The Autodock program was applied to the new rigid model to determine if this purely computational approach would identify the experimentally defined inhibitor site as a low-energy docking mode. The program fits the allowed conformations of a ligand to the surface of a rigid protein and ranks the free energy of binding for the various docked structures. Docking was performed on a dual processor AMD64 Polywell computer using Autodock3.02 (48) for the inhibitors Byk99 and Byk73. A 126 × 126 × 126 point grid, with 0.375 Å spacing, was constructed to search the whole membrane domain of the H,K ATPase E2P model. All torsions were allowed for the inhibitor molecules as part of a flexible genetic algorithm (GA) based docking routine, with 100 GA runs for each inhibitor. Modes of binding were separated with a 1 Å RMSD cutoff. The lowest energy structure from each mode was selected for analysis.
H,K ATPase Mutation, Expression, and Assay
These procedures have been detailed previously (11). Briefly, mutants were expressed in a HEK293 cell line stably producing the H,K ATPase β subunit by transfection with the plasmid, pcDNA3.1(Zeo), containing the rabbit gastric H,K ATPase α subunit sequence with site-specific mutations introduced with the QuikChange PCR kit (Stratagene). Mutations were verified by DNA sequencing. After transfection, the mutants were selected with zeocin and screened by Western blot analysis using the H,K ATPase specific antibody, Ab 12.18. The highest expressing clones were expanded for light membrane isolation by Dounce homogenization followed by centrifugation at 4 °C on a solution of 40% sucrose (w/v) in a buffer of 2 mM Tris·EDTA and 2 mM Tris·EGTA, pH 7.0. The membranes were removed from the sucrose interface, diluted with pure water, collected by centrifugation, resuspended with homogenization at ~3 mg/mL total protein, flash frozen in N2(l), and stored at −80 °C. Samples were analyzed for protein concentration by using the Lowry method with BSA as a standard (49). The level of H,K ATPase expression ranged from 1% to 5% of the total membrane protein and was determined by quantitative Western blot densitometry with purified hog enzyme as a standard. ATPase analyses used 3–10 μg of total membrane protein (~100 ng of expressed H,K ATPase), 0.8 mM Tris–ATP containing [32P]ATP (3000 cpm/nmol), Na+-free reaction buffer [40 mM Tris-HCl (pH 7.4) and 2 mM MgCl2 in a total volume 150 μL with a range of NH4-Cl concentrations (0–40 mM)], and various SCH28080 or Byk99 or Byk73 concentrations for times ranging from 60 to 80 min at 37 °C. Also included were inhibitors of possible contaminating ATPases, namely, 1 mM EGTA (Ca AT-Pases), 500 μM ouabain (Na,K ATPase), 1 μM oligomycin (mitochondrial ATPase), 10 nM bafilomycin (V-type AT-Pases), and 100 nM thapsigargin (srCa ATPase). Radioactive phosphate was measured in a 0.4 mL butyl acetate extract after acid quench of the reaction at 4 °C with 150 μL of 4.5% ammonium molybdate in 14% perchloric acid. ATPase activity data were fitted to the Michaelis–Menten equation, and the Vmax was normalized to the amount of H,K ATPase protein present in the assay to give a calculated specific activity (in μmol mg−1 h−1) for comparison to the purified hog enzyme. The apparent Km (Km,app) for ammonium and the Ki (dissociation constant) for SCH28080 or Byk99 and Byk73 were also derived from the fitted curves (50).
RESULTS AND DISCUSSION
Overall Structure
Superimposing the backbones (Figure 2A) of the H,K ATPase E2P model (white ribbon) and the template srCa ATPase (pink ribbon) in regions with high sequence homology in the P, N, and A domains and the M5M6 membrane pair shows the close overall structural alignment of these domains giving an RMS deviation of 3.0 Å. The overlay simplifies identification of shared and unshared features in these pumps. For example, the ADP (space filling) bound to the srCa ATPase in E2P spans the gap between N and A domains resulting in more than a 20 Å separation between the active site phosphate on D351 in the P domain and the β-phosphate. Magnesium ion (yellow sphere) binds to the polyphosphate and is close to the A domain but shows no apparent bond to the protein. ADP binding to the H,K ATPase model shares these features but displays major differences in the A domain interaction site (Figure 2 and detailed below).
The overall structure of the H,K ATPase E2P model oriented vertically with respect to the lipid bilayer is shown in Figure 2B with color coding of the cytoplasmic domains and transmembrane segments. The approximate dimensions of the lipid bilayer in relationship to the H,K ATPase are shown by dipalmitoylphosphatidylserine space-filling models on either side of the membrane domain. These also show the probable tilt of the polypeptide relative to the membrane and indicate that both the upper portion of the M1 helix above the bend point and the putative inhibitor/ion entry vestibule penetrate significantly into the hydrophobic region of the bilayer. The illustrated position of the lipid is based on the location of the hydrophobic side chains and is supported both by molecular dynamics of the srCa ATPase in a dioleoylphosphatidylcholine bilayer (19) and of the H,K ATPase E2·2K model in a POPC bilayer described below (see Figure 8).
Figure 8.

Dynamics of the H,K ATPase E2·2K model exhibited during a 10 ns molecular dynamics simulation. An RMSD plot (A) for the positions of the Cα atoms versus time levels off at ~4 Å, indicating the overall stability of the structure. The insets illustrate the protein in the bilayer at the beginning and end of the simulation. A graph of RMSF versus residue number (B) shows how different sections of the protein contribute to the RMSD. The transmembrane regions are very stable, with the most motion being found in a set of interdomain loops. The K+ binding site at the end of the simulation (C) is shown in the same orientation as in Figure 7A. The oxygen ligands of the occluded ions (purple spheres) are contributed by the side chain of E795, and the carbonyls A339 and Y340 for K1, and by E343 and the carbonyls of V338 and V341 for K2. The E820 side chain participates in binding of both ions.
The membrane domains of the two pumps show significant differences. These are seen in both the C-terminal membrane region (M7 to M10) and the more conformationally sensitive (M1 to M4) transmembrane segments. There is a major insertion in the M7M8 loop, the known site of interaction with the β subunit and variation in M10 where proline replacements in the H,K ATPase are predicted to disrupt the helix (Figure 2A, lower left). The cytoplasmic entry to M7 (Figure 2A, highlighted in gold) is also changed to generate a known site of trypsin digestion in the H,K ATPase (R852) whereas the corresponding backbone position in the srCa ATPase is buried (11). Several other significant changes in the M1 to M4 segments were found, including outward displacement of M1, a change in the tilt angle of M3, and increased angle in the luminal half of M4 (Figure 2A, where blue and green lines indicate M3 and M4 helix axes, respectively).
These give an expanded vestibule on the luminal side of the M5M6 loop bounded by M1M2, M3M4, and M7M8 loops (lower half of Figure 2B). This is the proposed site of ion and inhibitor access from the bulk luminal solvent shown by the arrow in Figure 2B.
ADP Docking to the H,K ATPase E2P Model Compared to srCa ATPase
Although the main focus of the current study was the membrane domain, the matched orientations of the cytoplasmic domains in the srCa ATPase structure and H,K ATPase model provided an opportunity to compare the nucleotide interactions of the two pumps. The overlaid E2P structures revealed closely aligned nucleotide binding pockets. Mg2+ and ADP were therefore copied with the same coordinates as in the overlaid Ca2+ pump (Figure 3A), added to the H,K ATPase model, and energy minimized with hydrogen bond restraints in the membrane helices. This optimized the side chain orientations and generated a preliminary model for E2P·ADP of the H,K ATPase with small changes in the positions of ADP and Mg2+ (Figure 3B).
Figure 3.

MgADP binding region in the srCa ATPase E2P homologue (A) and H,K ATPase model derived from this conformation (B). Docking of MgADP (stick and green surface) in the PDB 1wpg form of the srCa ATPase (A) is at the interface of the N (green ribbon) and A (solid pink ribbon) domains with no phosphate contact with the P (white ribbon) domain. The srCa ATPase backbone (lavender and pink ribbon, panel B) is superimposed on homologous sequences in the H,K ATPase to aid in the comparison of the structures around the polyphosphate where the pink lined ribbon corresponds to the solid pink ribbon in panel A. Energy minimization of the H,K ATPase model results in small changes in the positions of Mg2+ (yellow sphere) and ADP in response to different side chain orientations. The adenosine moiety (ADP in stick and transparent surface) is in homologous N domain binding pockets, and the polyphosphate faces the A domain in both pumps. The interface between the magnesium/polyphosphate and the A domain is less conserved. This is seen especially in the structure of the H,K ATPase from P238 to R249 compared to the srCa ATPase from P193 to K205. The backbones separate near P238 (white circle) of the H,K ATPase and then superimpose again near R249 (yellow circle). R249 replaces K205 of the srCa ATPase. The change in the backbone position (white arrow) may lead to activation of the E2K to E1K transition by ATP in the Na,K and H,K ATPases, where three carboxyl side chains at E232, E243, and E247 would be in close proximity to the γ-phosphate. For clarity some side chains are not labeled or are omitted.
The adenosine binding sites are structurally homologous. The adenine pocket is formed mainly by F487, K492, and K515 in the srCa ATPase and the corresponding residues F491, K496, and K517 in the H,K ATPase (Figure 3). R560 contacts the ribose ring in both pumps, and the importance of this residue for ATP binding has been well documented (51). There is also homologous contact between the polyphosphate and the A domain where the amino group of K205 in the srCa ATPase (Figure 3A, 3.5 Å from a β-phosphate oxygen) is replaced by the guanidine group of R249 which approaches two oxygens on the β-phosphate in the H,K ATPase model (Figure 3B). In both cases, the N domain interacts with the three residues (S231EP in the H,K ATPase and S184VS in the srCa ATPase) immediately following the conserved LTGE sequence in the A domain that provides an interface with the P domain.
The N and A domains have more protein–protein contact in the srCa ATPase structure than in the H,K ATPase model where the polyphosphate of ADP appears to provide the main contact with A (compare panels A and B of Figure 3). Two interacting loops in the srCa ATPase, one containing threonines 171 and 172 in the A domain and a second with R489 from the N domain (top middle of Figure 3A), are not present in H,K ATPase. Threonines at positions 171 and 172 represent an insert in the srCa ATPase sequence and the loop after the conserved F491 in the H,K ATPase folds back with no residue corresponding to R489 (yellow arrows, Figure 3B) and no A domain contact.
In the srCa ATPase the only significant A domain contact with the polyphosphate appears to be K205 whereas in the H,K ATPase the loop containing the equivalent R249 is shifted forward into closer contact with ADP (white arrow, Figure 3B). Similarities and differences in this sector are highlighted in Figure 3 (ribbon backbones and side chains in stick). The backbones diverge near P238 of the H,K ATPase (Figure 3B, white circle) and then rejoin after R249 (yellow circle). The reason for the difference in structure between these points can be traced to three prolines at positions 193, 194, and 197 and the inserted sequence, P197RA, in the srCa ATPase that gives a rigid segment pointing away from the ADP polyphosphate (Figure 3A, right side). These prolines are not present in the H,K ATPase. Instead, this pump substitutes a short straight segment bounded on the ends by P238 and P245 (compare overlaid Ca pump backbone ribbon, Figure 3B). Proline is restricted in its backbone dihedral angles, and the chosen angles were the only ones not resulting in high-energy distortion of P238 and P245. The loop structure brings a strongly electronegative cluster comprised of glutamates 232, 243, and 247 into proximity of the β-phosphate of ADP. Measurement of the intermolecular forces using the Docking module of the Insight II software showed that the van der Waals forces for MgADP binding to the two pumps were nearly the same (0.8 kcal/mol more favorable for the H,K ATPase) but there was a repulsive Coulombic force for the H,K ATPase where this term was slightly favorable in the Ca pump.
It is important to note that the positions of the cytoplasmic domains in the srCa ATPase were copied in the H,K ATPase homology model, but the N domain backbone was replaced with that of the crystal structure of the N domain of the α2 isomer of the Na,K ATPase that is far more homologous to the H,K ATPase. The initial positions for the magnesium ion and ADP were copied from the srCa ATPase PDB 1wpg structure, and the model was energy minimized to remove steric contacts and generate a conformation close to that of the srCa ATPase. The positions of the backbone and of MgADP were changed slightly, with magnesium and the polyphosphate rearranging to optimize contact with the positively charged R249 (Figure 3B). With these assumptions, the conformation obtained would be E2P·ADP or the ADP-insensitive phosphorylated state with the β-phosphate distant from the active site acyl phosphate.
The domain arrangement shown in Figure 3B with MgADP between N and A domains may be similar to that in the E2K conformation of the H,K ATPase that allows low-affinity ATP binding. In this case, replacement of ADP with ATP would bring the γ-phosphate close to the space below the β-phosphate in Figure 3B. Thus, while the presence of R249 suggests a polyphosphate binding function similar to that of the srCa ATPase, replacement of ADP with ATP is expected to make this conformation much less stable in the H,K ATPase. The decreased stability of E2K generated by ATP binding would activate conversion to E1K and the return of K+ to the cytoplasm. This mechanism has been proposed previously in the Na,K ATPase (52).
Membrane Domain
The luminal opening of the membrane domain of the H,K ATPase had to be enlarged (see Experimental Procedures) to allow passage of the relatively rigid naphthyridine inhibitor, Byk99, from the luminal space to its experimentally defined binding site (11, 32, 50). The method employed steered molecular dynamics to move Byk99 from the binding site to the luminal space in the absence of solvent (e.g., in vacuo) to increase the space between the membrane helices. The most open structure obtained was energy minimized and then used with its backbone held fixed for all of the simulations discussed below involving ion and inhibitor movements in the membrane domain, and these simulations all included explicit water. The objective was to test the ability of the fixed backbone model to account for Byk99 and K+ access to their binding sites within the membrane domain with reasonable dehydration of these ligands upon docking.
Explicit water (stick form and surface in blue, Figure 4) was added between the membrane segments by applying the SOAK algorithm supplied with the Insight II 2000 software (Accelrys Inc., San Diego, CA). The procedure was also applied to the srCa ATPase to compare the hydrated space in the two pumps. Although the H,K ATPase model shows a water-filled channel leading to a position next to the ion binding site, the E2P structure (PDB code 1wpg) of the srCa pump shows no obvious exit path for calcium ion (Figure 4). Rather than being expanded to allow calcium release, the ion site is instead collapsed and may represent the conformation after Ca2+ release and protonation of the ion site for counter transport. The hydrated space in the H,K ATPase is consistent with extensive empirical data defining accessibility within the membrane domain of the Na,K-ATPase (53, 54). Expansion of the luminal vestibule and creation of the ion channel are associated with significant displacement in the M1, M3, and M4 helices compared to the Ca pump. Hence, when the M5/M6 membrane pairs of the two pumps (residues 785–824 of the H,K ATPase model and 761–800 of the srCa ATPase, PDB code 1wpg) are overlaid (RMS backbone deviation of 1.81 Å), the distances from the conserved proline (Cα atom) near the middle of the loop to the M1, M2, and M4 axes in the plane of the membrane are increased 3–4 Å. This provides the space required for counterion access to the ion binding site as well as for inhibitor entry.
Figure 4.

Membrane domains of the srCa ATPase in E2P (A) and the H,K ATPase E2P model (slightly more enlarged) (B). The space between the membrane segments was filled with water (stick with blue surfaces) by applying the SOAK algorithm (Accelrys Insight II, 2000) and performing energy minimization with the peptide backbones fixed. (A) For the srCa ATPase in the putative product bound form of the E2P conformation (PDB code 1wpg), the solution ends at the base of the M5M6 loop, and there is no hydrated path from the luminal vestibule to the ion site (side chains in stick form). This is because the ion site side chains are in close contact across the space separating M5 and M6 giving close packing of the helices (color coded as in the H,K ATPase) in the srCa ATPase. (B) In the H,K ATPase model the positions of M1, M3, and M4 are more displaced (see also Figure 2), giving an expanded luminal vestibule below the M5M6 loop and a water-filled channel leading to a position next to the ion binding site between M4, M5, M6, M7, and M8.
Inhibitor Binding to the New E2P Model
The naphthyridine, Byk99, is a fixed ring derivative of the K+ competitive class of specific H,K ATPase inhibitors, the imidazo[1,2-a]-pyridines, such as SCH28080 (Figure 1) (8, 9). Because of its restricted rotational degrees of freedom and high affinity, it makes an nearly ideal compound for use in molecular modeling as compared to the flexible structure of SCH28080 (16). Byk99 was docked into the expanded, hydrated vestibule, and sterically overlapping water molecules were removed. The initial docking position was copied from our original model (11). Then, molecular dynamics and energy minimization in the presence of the remaining water were performed to optimize binding, and this generated the inhibitor docking orientation for the rigid backbone model. The binding space is completely eliminated in the E1K model for the H,K ATPase (described below) by the movement of the luminal half of M4 into the space next to the M5M6 loop. The inhibitor position (Figure 5C) was slightly changed from that of the original model with the imidazopyridine ring inserting between F332, Y799, P810, and L811 and the phenyl ring between A335, I816, and L141.
The side chain interactions important for binding are supported by the results of site-specific mutagenesis studies (Table 1). Peripheral contact between the phenyl moiety and L141 is suggested by the 5-fold loss in affinity given by a L141C mutant. This would account for photoaffinity labeling of the M1M2 membrane pair by a p-azido derivative of SCH28080 (32). The interaction of Y799 with the inhibitor was investigated in recent site-specific mutagenesis studies identifying this residue as an important binding determinant (55). The binding site orientation of SCH28080 proposed by Asano et al. (55), however, is rotated ~90° with respect to that shown in Figure 4C to make the imidazopyridine ring roughly coplanar with respect to the membrane plane. More importantly, this proposed binding mode does not account for the complete elimination of binding in the A335C mutant.
Inhibitor Entry in the Hydrated E2P Model
The hydrated, rigid model was tested for its ability to account for inhibitor access and dehydration. Steered molecular dynamics, with the peptide backbone fixed and a steering force of 20.0 kcal/ mol, was applied to minimize the distance from the bridgehead carbon of the imidazopyridine ring to a fixed point ~20 Å away, close to the middle of the M1M2, M3M4, and M5M6 loops. Residue V331 was replaced with the bulky phenylalanine side chain to see if the model could explain the lack of effect on inhibitor affinity observed in this mutant (Table 1). No high-energy conformations of the inhibitor were required to allow transit to the fixed point (Figure 5). Diffusion to the bulk luminal solvent from that point would be unhindered. The reverse of the simulation would therefore account for entry, and the expanded model was sufficient to allow for this pathway.
The advantage of including channel waters in the inhibitor–protein modeling procedure was to investigate the loss of hydration as the inhibitor entered the hydrophobic binding site in the M5M6 loop. Much of the free energy of binding is likely to be associated with a decrease in solvation of the inhibitor (56). A desolvation term is included in the docking calculations performed by Autodock, as presented below. In the final model there were two water molecules above Byk99 in the channel and three below it in the vestibular space that were within 4 Å of the inhibitor. When hydrated alone using the same method, Byk99 was surrounded by a solvent monolayer comprised of 42 waters. Binding in the model therefore gave an 88% reduction in water bound to the inhibitor and also blocked the water channel to the ion site. Binding therefore would prevent K+ entry to the putative channel. This could account for the K+ competitive kinetics of inhibition by these compounds.
The model shows important side chains (Figure 5B, red circles) that are likely to be in close contact with the inhibitor during transit to the binding site. Inhibitor redesign would have to account for these as possible restrictions to entry. Close contact of the imidazopyridine ring with L809 was found as the ring inserted into a position next to Y799. This would appear to make equivalent insertion into this position impossible for the L809F mutant and led to an alternative binding mode predicted for the naphthyridine in this case (see below). The phenyl ring had to assume an orientation nearly coplanar with the imidazopyridine to pass through the narrow gap between A335 and C813 (arrow, Figure 5B). This could account for the 4-fold increase in affinity observed in the A335G mutant while the A335S mutant showed a 19-fold decreased affinity and A335C was completely insensitive to the inhibitor (Table 1).
In the model, the inhibitor could enter through the middle of the luminal vestibule without contacting phenylalanine at position 331 (Figure 5B, arrow) thus accounting for the empirical results in the V331F mutant.
Inhibitor Binding Sites Identified by Using Autodock
The H,K ATPase model as a rigid structure was tested for its ability to predict inhibitor binding sites consistent with experimental data when probed with a purely computational approach. The membrane domain was examined by using the program Autodock to find docking sites for both high-and low-affinity naphthyridines, Byk99 and Byk73, respectively. The program systematically searches for sites of interaction for different conformations of the chosen compound and ranks them according to their calculated binding free energy. Only two high-affinity binding sites were found for Byk99, both in the channel. One with a binding free energy of −10.55 kcal/mol had the phenyl group facing the ion site and was perpendicular to the plane of the membrane. This position is inconsistent with both mutational and photoaffinity labeling results and could be discarded (11, 32). The second (green stick, Figure 6A), of almost equivalent energy (–10.41 kcal/mol, Kd = 46 nM at 310 K), was only slightly displaced toward the middle of the membrane from the site predicted by the experimental data and the modeling software (pink stick, Figure 6A). The small change in position may be accounted for by slightly less stringent van der Waals terms utilized by Autodock. A site ranked third was of much higher energy (–6.24 kcal/mol) and was located in the cleft under C822. The presence of this site is implied by covalent modification of C822 by a subset of the PPIs whose pKa’s of acid-catalyzed rearrangement are especially low (e.g., pantoprazole) (57). The relatively high energy of this binding mode suggested the possibility of low-affinity binding in this location. Hence, only the site identified by Autodock next to the M5/M6 loop (green stick) is consistent with high-affinity naphthyridine binding and the empirical data.
Figure 6.

Binding modes are compared for Byk99 (A, pink stick) identified by Discover (Accelrys Inc., San Diego, CA) and those identified by Autodock for Byk99 (A, green stick, Kd of 46 nM, −10.41 kcal/mol calculated binding free energy at 310 K) and for Byk73 (B, white stick) with the H,K ATPase E2P model as a rigid structure. The hydrophobic residues (stick) shown in the M5M6 loop (ribbons) form only part of the binding cavity. Only one (Kd of 1.61 μM, −8.22 kcal/mol) of three similar Byk73 binding modes is shown.
In contrast to Byk99, no high-affinity but several low-affinity binding modes were found for Byk73. Three of these modes were close to the M5M6 loop with the naphthyridine ring either flipped or reversed compared to the high-affinity orientation of Byk99 in Figure 6A. These modes had free energies −8.79, −8.76, and −8.22 kcal/mol with corresponding dissociation constants of 0.64, 0.67, and 1.61 μM, respectively. No orientations matching that of Byk99 were found for Byk73, confirming the inability of this compound to fit the site in a high-affinity mode. Autodock found another low-affinity site for Byk73 in the space next to C822 (–5.95 kcal/mol) in a position similar to that for low-affinity Byk99 binding. PPI binding at C822 inactivates the H,K ATPase, suggesting that low-affinity binding in the space next to this residue would be inhibitory.
For the binding modes found by Autodock closest to the high-affinity binding site defined by mutation, the calculated binding free energies for Byk99 and Byk73 correspond to dissociation constants of 46 nM (Figure 6A) and 1.61 μM (Figure 6B), respectively. The observed inhibition constants of the two compounds of 18 nM and 3.8 μM (O. Vagin, personal communication) correspond to binding free energies of −10.99 and −7.69 kcal/mol, respectively, showing a reasonable fit to the computed values of −10.41 and −8.22 kcal/mol for the binding modes shown.
In contrast to these results, the decrease in SCH28080 affinity for the L809F mutant was not predicted by increased binding energy for Byk99 measured by Autodock. The top two ranked sites were very similar in energy to those found for the wild-type enzyme (–10.17 and −10.10 kcal/mol). This mode of binding would block access to the putative ion channel and lead to competitive inhibition whereas the L809F mutant shows noncompetitive inhibition. However, Autodock does not evaluate the accessibility of the site, only its affinity for the ligand, and molecular dynamics with phenylalanine at position 809 showed that the bulky phenyl side chain would increase the energy required for the inhibitor to enter the space next to Y799 (see Figures 5 and 6). Alternatively, Byk99 binding in the space next to C822 (not shown) predicted by Autodock gave a free energy of −7.42 kcal/mol, corresponding to a dissociation constant of 5.88 μM, similar to the experimentally observed value of 6.25 μM for the noncompetitive SCH28080 inhibition of the L809F mutant. The side chain of Cys822 points between M2 and M6, and binding in this space would prevent the conformational transition to E1 while not blocking K+ access to the ion channel. Low-affinity binding at this alternative site could therefore account for the noncompetitive mode of inhibition seen in the L809F mutant.
Ion Occlusion
The most stable binding conformation for a single bound K+ found during molecular dynamics investigation of the ion pathway (described below) was energy minimized with phosphate removed from the active site to give the E2K conformation (Figure 7A). This would be the occluded form of the pump while supporting a high acid gradient where the stoichiometry is 1H3O+/1K+ transported per ATP hydrolyzed (58, 59). There were small changes in the inhibitor binding site including changes in the position of Y799 and C813 which would result in steric interference with the inhibitor binding to E2P (not shown). This would account for the competitive inhibition of ion-activated H,K ATPase activity exhibited by SCH28080 or Byk99.
The occluded conformation of the H,K ATPase model (Figure 7A) can be compared to the E2P conformation of the srCa ATPase to explain the structural origins of counterion occlusion in the Na,K and H,K ATPases. In the calcium pump, the amide side chains of N768 and N796 (N792 and E820, respectively, in the H,K ATPase) are separated by less than 4 Å in E2P, and N768 hydrogen bonds to the carbonyl of A305 on the inside surface of M4, resulting in little space between M4, M5, and M6. In the H,K ATPase model, K791 prevents this close contact, and N792 hydrogen bonds to the side chain of T788 and the backbone carbonyl of Y340 on the outside of M4 (blue arrows, Figure 7A). This allows space for the counterion to bind between M5 and M6 and may be the reason that threonine in the position of T788 is conserved in all H,K and Na,K ATPases but is not present in the srCa ATPases. Finally, a major difference affecting the ion site is the substitution of the bulky, β-branched I825 in the H,K ATPase for G802. This significantly displaces the expanded portion of the M6 loop (yellow arrow, Figure 7A), allowing space for the side chain of E820 to access the ion site.
The resulting occlusion site showed distorted octahedral geometry with K+ bound predominantly on the M4 helix with ligands contributed by backbone carbonyl oxygens of V338, A339, and V341 and by side chain oxygens of E820 and E795. E343 does not participate directly in ion binding in the model but assumes an orientation facing the ion site via interaction with water (H3 in Figure 7A). This arrangement is very similar to the occluded form presented by Swarts et al. (60) with the exception that E343 is predicted to participate in ion binding directly (60).
Ion Pathway
The hydrated model presented a channel for the passage of K+ from the luminal vestibule to the ion occlusion site near the middle of the membrane. Therefore, K+ was placed at various starting positions in the hydrated vestibule or channel, and short molecular dynamics simulations (0.1–0.2 ns) were performed to follow the movement of the ion and define a potential ion pathway in terms of the space accessed by the ion during its thermal motion. The peptide backbone was fixed while the side chains, ion, and water were allowed to move during these time courses with the assumption that inhibitor and ion specificities imply rigidity in the E2P conformation.
Ion Channel Entry over the M5M6 Loop and Approach to the Ion Occlusion Site
The M5/M6 loop presents the first protein encounter for passage of the ion into the channel. In order to examine this interaction, molecular dynamics was performed with a single K+ placed initially in the hydrated luminal vestibule between the M1/M2 and M3/M4 loops and its movement followed for 0.1 ns with no steering force added. The only approach to the loop accessed by the ion was between the carbonyl oxygens of L811 and G812 and the sulfur of C813. This led to apparent binding to these two carbonyls (Figure 7B) and two molecules of water (not shown). This appears from the model to be the initial entry site into the channel.
A second simulation with K+ in the same starting position included a small steering force of 1.0 kcal/mol to bring the ion into the channel. When the ion was just above the M5M6 loop, but still 15 Å from the proposed ion occlusion site, the force was eliminated and the space accessed by the ion in the hydrated channel was recorded for 0.2 ns. The movement of the ion inside the channel is described below (see Figure 7C). The initial encounter with the loop was with the sulfur of C813 and the backbone carbonyl oxygen of L811, showing that the steering force had not affected the entry point. The ion passed through the M5M6 loop in the space formed by L809 and P810 on one side and L811 and G812 on the other. This space forms part of the binding site for the naphthyridine inhibitor and is covered to the side of the M5M6 loop by the grouping of Y799, F332, A335, and A339 (Figure 7C).
The importance of the residues in this apparent entry region has been shown by site-specific mutagenesis. The H,K ATPase F332I mutant shows significantly depressed activity and decreased apparent ion affinity (Table 1), and Y799S is inactive. Mutants of C813 also show significantly lower ion affinity with Km,app for NH4+ of 5.5, 6.6, and 4.9 mM for C813A, C813T, and C813S, respectively, compared to 2.4 mM for wild type (50). The G812I mutant, containing the srCa ATPase residue at this position, was found to be inactive despite a normal level of expression (Table 1), suggesting that the absence of a side chain at G812 may be important for ion entry. G812 is conserved in the Na,K ATPase, and substitution of the corresponding G803 with cysteine followed by treatment with MTSET inhibited the Na,K ATPase by decreasing its affinity toward extracellular K+, suggesting restriction of K+ access to internal binding sites (54). In the srCa ATPase A305 (H,K ATPase A339) substituted with glycine retained activity, but the valine mutant was inactive (61), suggesting the importance of space next to this residue in support of the channel location in the model (Figure 7C).
The ion movement during molecular dynamics showed that a potential alternative path at the interface of M2 and M6 is blocked by contact between residues C813 and L817 on M6 with L141 and L145 on M2, respectively (Figure 7C). These residues are invariant in all Na,K and H,K ATPases, suggesting the importance of their close packing. The L145F mutant is nearly inactive (Table 1), and L141C showed strongly impaired maximal activity (<10% of wild type, Table 1) with 4-fold reduction in apparent affinity for SCH28080 consistent with a possible role at the edge of the binding site as predicted in the model (see Figures 5C and 7C). The L141C mutant also showed an extra band, stained with specific antibody, above the normal catalytic subunit in SDS–polyacrylamide gels. The band was eliminated by treatment with DTT and was not present in the L141C/ C813A double mutant (data not shown). The band likely represents the catalytic subunit with an internal disulfide bridge between C141 and C813, demonstrating that the α carbons in these positions must come within 7.5 Å of each other. This distance is 7.44 Å in the model (Figure 7B). We previously reported a similar disulfide in an A335C mutant between C813 in M6 and position 335 in M4 (11). No cross-linking was found in a C813A/A335C/L141C triple mutant, however, suggesting a distance exceeding 7.5 Å or a lack of the proper orientation between α carbons at positions 141 and 335. The geometry implied by these results is consistent with the srCa ATPase E2P structure. An homologous structure in the M5M6 loop is further supported by scanning cysteine mutagenesis in the Na,K ATPase where accessibility to sulfyhdryl reagents was predicted by the side chain orientations of the corresponding residues in the srCa ATPase (54). Furthermore, labeling of the H,K ATPase at C813 by all the PPIs (16) indicates that this residue is adjacent to open space at the start of M6 and the aligned P789 of the srCa ATPase similarly faces a luminal vestibule. Instead of proline as a helix initiator, however, the first helix turn of M6 in the H,K ATPase model is stabilized by hydrogen bonding of T815 to the M5M6 loop (white line, Figure 7B). Amino acid sequence alignments show that a threonine equivalent to T815 is present in all Na,K and H,K ATPases. This arrangement, together with the flexibility of G812, enables the carbonyls of L811 and G812 and the side chain sulfur of C813 to form an entry site for K+ in the derived structure of the H,K ATPase.
Ion Movement from the Channel to the Occlusion Site
In the srCa ATPase, the backbone positions in the membrane helices are hardly changed in the E2P and E2 conformations. There is a significant change in the side chain position of E309 (H,K ATPase E343), however, with the carboxyl group pointing away from the ion site in E2 and toward it in E2P. This residue has been suggested to play a role in access to the occlusion site. For these reasons, we again held the backbone fixed and allowed the side chains to move in molecular dynamics simulations of ion movement in the upper part of the ion channel to follow the mechanism of ion insertion into the occlusion site. The ion was found to exchange its water of hydration for ligands on the protein during its horizontal movement from the upper portion of the water-filled channel into this site. The details of this process were studied by molecular dynamics starting with the ion in the upper part of the channel, and the results are summarized in Figure 7D.
At the top of the ion channel a small set of water molecules whose positions changed little during these short simulations were surrounded by hydrophilic residues T790 and Y787 in M5, Q870 in M7, and Q939 and E936 in M8. These provided nearly complete solvation for the ion as shown for K1 in Figure 7D. Movement toward the occlusion site (K4 in Figure 7D) resulted in the ion exchanging the water of hydration for ligands on the protein contributed by the carboxyls of E795 and E820 and the carbonyl oxygen of A339 (K2, Figure 7D). These residues, however, also presented a barrier to the occlusion site (white triangle in Figure 7D), and from position K2 the ion never entered the occlusion site directly but instead passed below E820 to position K3 while maintaining a single water of hydration (W2) and being drawn into contact with the carbonyl oxygen of V338. Optimization of the orientation of E820 with contribution of both of its side chain oxygens to the ion resulted in the loss of the last water of hydration and entry into the presumed occlusion geometry (K4). This was the most stable position for the ion as judged by the time spent in this conformation during the simulations and would be associated with conversion to E2K. Given the narrow entry to the binding site, even a small displacement of the membrane helices associated with this conversion would be sufficient to prevent inhibitor entry and account for the competitive kinetics of SCH28080 inhibition.
The side chains of M113 and L145 occupy positions next to the occlusion site and may help to stabilize the occluded state. Mutation of M113 to leucine resulted in a 10-fold increase in apparent ion affinity while the cysteine mutant was unaffected (Table 1). Substitution of leucine for the more flexible methionine in the model would be expected to present a more stable barrier to the ion in this conformation. In the Na,K ATPase leucine replaces M113, and K+ occlusion is significantly more stable than in the H,K ATPase where measurement of occluded ion requires low temperature and vanadate (59). Substitution by a larger, hydrophobic side chain for L145 would fill the space next to the occlusion site, and this mutant shows almost no activity (Table 1). Hence, these changes are consistent with inhibited conversion to E1K and subsequent K+ deocclusion.
Bilayer Simulation and Molecular Dynamics of the E2·2K Conformation
The H,K ATPase is capable of pumping at a stoichiometry of 2H3O+/2K+ per ATP hydrolyzed while sustaining a low acid gradient (59). Dephosphorylation under these conditions generates the E2·2K conformation with the ions occluded, and this form was investigated by using molecular dynamics over a length of time sufficient to evaluate the stability of the model and its various subdomains (62). The E2P model with phosphate removed, along with pore waters, two K+, and hydronium ions, was placed into an equilibrated bilayer of POPC lipid and solvated, and sodium and chloride ions were added to produce an approximately 270000 atom system. After 0.5 ns of equilibration with the protein heavy atoms held rigid, molecular dynamics was run on the system for 10 ns to examine the protein movement in a native environment.
Figure 8 summarizes the motions observed in the model, over the course of the simulation, with Cα RMSD and RMSF graphs. The RMSD value of ~4 Å after 10 ns (Figure 8A) is well within the expected dynamical range for a homology model of a membrane protein of this size (62). The RMSF plot (Figure 8B) shows the contribution of defined regions of the protein to the RMSD. The transmembrane helices all have a RMSF of ~1 Å, including the loop at the center of M4, which forms much of the proposed occlusion site. The deviations and fluctuations in the model and the relative stability of secondary structure and important internal loops are consistent with the model being of sufficient quality to determine biologically relevant information from it in simulation. It compares favorably to other membrane protein simulations of equivalent size, such as KcsA (63) and aquaporins (64–66), or of even larger size, such as the nicotinic acetylcholine receptor (67).
Two K+ ions, located at the occlusion site during the setup of the system, remain bound at that site (Figure 8C) throughout the 10 ns simulation. The stable ligands of the bound ions (purple spheres in Figure 8C) are in agreement with the results shown in Figure 7A with K2 replacing the hydronium at H3. The oxygen ligands of the occluded ions are contributed by the side chain of E795 and the carbonyls A339 and Y340 for K1 and by E343 and the carbonyls of V338 and V341 for K2. The E820 side chain binds both ions. The participation of E343 as a ligand of occluded K+ at K2 explains the decrease in apparent binding affinity given by mutation of this residue (25).
Model Assessment
The RMSF plots highlight areas of the protein that are seen to be highly mobile. The loop connecting the first sequence of the A domain to M1 is highly mobile and so is a short loop connecting the P and N domains. These segments connect mobile domains and undergo known structural changes during the transition between E1 and E2 forms of the srCa ATPase. The section with the most motion is the M7/M8 loop, which is known to provide a site of interaction with the β subunit (68). Because the srCa ATPase template lacks a β subunit and the sequence is poorly conserved in the M7/M8 loop, the model is uncertain in this region. In addition, the nine carboxy-terminal residues of the model, after the conserved segment -DEIXR-, are nonhomologous. This region is likely to interact with the amino terminus of the β subunit, and the structure here cannot be reliably predicted from the srCa ATPase. There are also mobile segments in the N domain, and these correlate to the loop regions whose structures could not be defined in the crystallized N domain of the Na,K ATPase (38). Flexibility may therefore be an intrinsic property of these loops. In the P domain there is a 20 amino acid insert in the H,K ATPase (residues 649–668) for which a hypothetical structure had to be modeled (11). This region shows RMSF above the background, and the structure here is based only on helix/ turn predictions and is uncertain. Flexibility in this segment may also be a property of the peptide because it contains the only site of trypsin sensitivity observed in the presence of MgATP and SCH28080 (32).
Ion Binding and Exit to the Cytoplasm for an E1K Model of the H,K ATPase
Concentrations of K+ ~10-fold higher than the Km for ATPase activation inhibit the H,K ATPase with a parallel reduction in the steady-state level of phosphorylation (69). In contrast to the high-affinity K+ site for ATPase activation accessed from the extracytoplasmic surface (Km,app = 0.2 mM), this low-affinity inhibitory site (Km,app = 8 mM) is accessed from the outside (cytoplasmic surface) of intact sealed H,K ATPase vesicles, and K+ binding at this site reduces the rate of phosphorylation by ATP (70). The bound inhibitory conformation is therefore designated E1K. Under normal steady-state conditions the conversion of E1P to E2P is rate limiting in the H,K ATPase with rapid conversion of E2P to E2K and then release of K+ from E1K to the cytoplasm (70). At high K+/ATP ratios, however, the conversion of E1K to E1ATP becomes rate limiting. These results suggest that an access/exit path exists for K+ in an E1 conformation of the H,K ATPase. Hence, mutations significantly decreasing the rate of K+ release to the cytoplasm could be expected to give the latter mechanism and decrease the maximal turnover rate compared to wild type.
In order to explain K+ exit to the cytoplasm from the E1K conformation of the H,K ATPase, a homology model was constructed on the basis of the backbone coordinates of PDB code 1su4, the srCa ATPase in the E12Ca2+ conformation. Hydronium and K+ were substituted for Ca2+ in sites I and II, respectively (Figure 9). Two bound waters (not shown) were also included in site I in the same position as defined in the srCa ATPase structure. In the energy-minimized model, the site I hydronium was within hydrogen-bonding distance of E795, T823, D824, and N792. The K+ ligands were carbonyl oxygens of V338, A339, and V341 and side chain oxygens of E820 and E343 (Figure 9). In this model the imidazopyridine binding site is eliminated by the presence of the lower half of M4 in the space next to the M5M6 loop, thus accounting for the absence of inhibitor binding to the E1K conformation.
Figure 9.
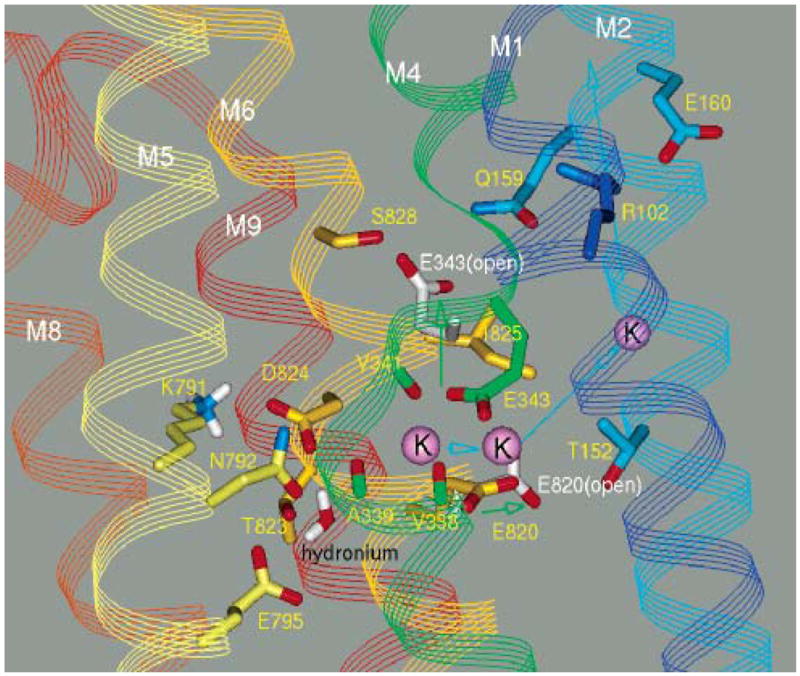
K+ binding and exit from an E1K homology model of the H,K ATPase. The E1K binding site defined by energy minimization with hydronium in site I and K+ in site II. Hydronium in site I is bound to the N792, E795, and D824 side chains. Site II is formed from carbonyl oxygens of V338, A339, and V341 on membrane helix M4 and carboxyl oxygens from E820 and E343. Movement of the latter two side chains out of site II (green arrows) to give a more open site (side chains in white stick) is suggested to lead to K+ exit to the cytoplasm (blue arrows). Water filling the space around the ion path is not shown.
To find a possible exit path from site II, the free space in the model between M1, M2, M4, and M6 was hydrated, and molecular dynamics was performed (0.3 ns) while a steering force (force constant of 10 kcal/mol) was applied to withdraw the ion to a point near the middle of the hydrated volume on the opposite side of E343. This procedure resulted in exit of the ion from site II only when the side chain of E820 was reoriented to face T152 directly across the hydrated space in M2 and E343 was brought into hydrogen-bonding distance of S828 and Q159 as illustrated in Figure 9. Hence, changes in the orientations of these two residues appear to be required for K+ dissociation from this conformation. Dioleoylphosphatidylserine stabilization of a K+-bound conformation has been reported to preserve enzyme activity of the solubilized Na,K ATPase (71), suggesting a possible structural role for phospholipid. A tightly bound phospholipid headgroup is seen in a high-resolution E2 form of the srCa ATPase (PDB code 2agv) between M2 and M6 but apparently moves out of this space during the transition to the E1 state. If the space between M1 and M2 at the cytoplasmic membrane border has a similarly bound lipid in the H,K ATPase, the negatively charged headgroup would appear close enough to E343 to influence ion deocclusion by attracting the ion or favoring movement of E343 as shown in Figure 9.
The possibility that mutants of Q159 and E160 would affect activity and apparent ion affinity in a manner consistent with a role in deocclusion was investigated (Table 1). These highly conserved residues in M2 are close to E343 in E1 but quite distant in E2. Conversion of Q159 to a negatively charged glutamate resulted in the loss of more than 90% of the turnover activity and almost a 3-fold increase in the Km,app for NH4+, namely, 6.0 mM as compared to wild type, 2.4 mM. The effects were less in Q159N (74% inactivation and Km,app of 3.6 mM), showing that the side chain length is important. The results suggest that Q159 is hydrogen bonded to a negatively charged side chain. The E160Q and E160D mutants showed the reverse effect on Km,app with values of 0.3 and 1.1, respectively. Here, negative charge repulsion would be decreased either by neutralization in E160Q or by withdrawing the negative charge with the shorter side chain in E160D. The increased distance to the negative charge partner from E160 compared to Q159 would explain the less dramatic effect on activity. If the hydrogen-bonded partner were E343, the open conformation of the gate would be destabilized in Q159E and Q159N and stabilized in E160Q and E160D. In the former case the rate of deocclusion could be expected to decrease compared to wild type. This would require a higher ion concentration for half-maximal velocity while the opposite would hold for the E160 mutants. The model of Figure 9 provides a template for further investigation.
It is relevant to note the E820Q mutation in the H,K ATPase results in a constitutively active enzyme in which the E2 ↔ E1 equilibrium is shifted in favor of the E1 form (72). It has been suggested that charge neutralization in the E820Q mutant mimics neutralization of E820 by K+ during turnover in the wild-type enzyme (72). In this case the position of the amino group of K791 in the E2P conformation (Figure 7A) would be destabilized, thus favoring the orientation in E1K (Figure 9). This analysis implies that the conversion to E1K is determined at the time K+ reaches E820 from the lumen. The position of E343 is on the cytoplasmic side of E820. Mutants E343A and E343D show no turnover activity and the E343Q mutant has 4–5-fold higher Km,app for K+ activation of the ATPase activity and 2–3-fold higher K0.5 for inhibition (25, 72). The latter effect is known to arise by K+ binding from the cytoplasm. These mutations at E343 may therefore affect K+ exit from site II in the E1K conformation and are consistent with the mechanism suggested above.
Ouabain Binding to a Mutant Form of the H,K ATPase Model
A recent report (4) describes a mutant of the gastric H,K ATPase in which seven amino acid replacements in the membrane domain produced an enzyme with high-affinity ouabain binding not seen in the wild-type H,K ATPase. Ouabain is known to bind specifically to the E2P conformation of the Na,K ATPase. Therefore, as a test of the model, these seven residue replacements, R328E, M330V, V331I, A335G, Y799F, C813T, and E820D corresponding to the Na,K ATPase residues E312, V314, I315, G319, F783, T797, and D804, respectively, were made and their side chain orientations optimized by energy minimization with the peptide backbone fixed. After water was added to the luminal vestibule and ion channel, ouabain was added in the vestibule approximately in the middle of the substituted side chains with the lactone ring toward the M5M6 loop and the rhamnose moiety facing the lumen. After water molecules overlapping the inhibitor were removed, molecular dynamics was performed until a stable binding orientation was achieved (0.1 ns, Figure 10). The conformation used for ouabain itself was obtained from the ouabain antibody structure (PDB code 1ibg) where the bound inhibitor has the lactone and steroid buried in a hydrophobic cavity and the rhamnose ring exposed to the solvent. Comparison of this ouabain conformation in water to the antibody-bound inhibitor showed 83% of the surface water was removed upon binding as determined by the procedure described above for Byk99 binding to the H,K ATPase.
Figure 10.

Ouabain (stick in pink) binding to the H,K ATPase model. The protein structure was modified with seven amino acid replacements that confer high-affinity ouabain binding (Y799F, A335G, R328E, C813T, and I331V with side chains in white and M330I and E820D not shown). Only selected side chains, M1, M2, and the M5M6 portion of the binding site (side chains in stick and surfaced) are shown. Water is not displayed for clarity. Essential structural features of the inhibitor (arrows) and hydrogen bonds involving the steroid moiety (blue lines) or rhamnose (white lines) are predicted by the model. Substitution of alanine at G335 (white sphere) would generate steric conflict with the C18 methyl.
A similar result was found for ouabain bound to the modified H,K ATPase model where 71% of the surface water was displaced by the protein. The inhibitor moved up into the membrane domain during the molecular dynamics optimization and buried the lactone and part of the steroid ring in the hydrophobic fold of the M5M6 loop as seen for the imidazopyridine ring of Byk99 but with a different orientation. As described above for Byk99 binding, side chains at positions 809, 811, 332, 335, 813, and 799 were involved in ouabain docking. The lactone was inserted into a groove between F799, L811, A339, and I816. Phenylalanine in position 799 in place of tyrosine resulted in a different side chain orientation compared to the wild type (see Y799 in Figure 5C), and this allowed a cavity for the lactone, which would be unavailable in the wild-type H,K ATPase. L809 fitted into the hydrophobic curvature of the steroid ring system (Figure 10) which was enclosed on the side by F332, a residue that is conserved in the Na,K ATPase. Substitution of the residue equivalent to L809 (L793) in the Na,K ATPase with either proline or alanine was reported to give an ouabain-resistant phenotype in random mutagenesis experiments (73). Ouabain also formed key interactions with G335 and T813 (detailed below) but was only peripherally associated with E328 and I331. V330 and D820 do not contact the inhibitor in the model.
The binding site in the mutant model is consistent with a range of known mutation effects on ouabain binding to the Na,K ATPase and also rationalizes important structure–activity relationships of this inhibitor. A hydroxyl group at C14, cis fusion of the C and D steroid rings giving the steroid curvature, and the C18 methyl are essential for inhibition. These groups provide key interactions with the model where the C14 hydroxyl (Figure 10) hydrogen bonds between the backbone oxygen of L811 (donor/acceptor distance of 2.91 Å) and the side chain hydroxyl of T813 (3.45 Å). Another important group on the steroid ring, the C19 hydroxyl, also makes a hydrogen bond to T813 with a donor/ acceptor distance of 2.92 Å (blue line, Figure 10). The importance of hydrogen bonding by threonine in this position was shown by generation of an ouabain-resistant form of the Na,K ATPase (IC50 > 5 mM) with a single residue substitution of isoleucine for T797 (74). The C18 methyl is precisely oriented into the space next to G335 (Figure 10, arrow), and substitution of alanine for the equivalent G319 in the Na,K ATPase resulted in a loss of binding function (4) and would overlap the C18 methyl. Hence, these positions in the structure, A335 in the H,K ATPase and the corresponding G319 in the Na,K ATPase, are key residues in naphthyridine and ouabain binding, respectively.
Hence, the current model suggests that the combined effects of Y779F, A335G, and C813T are predominantly responsible for allowing key interactions with ouabain while the R328E and V331I mutations affect binding more peripherally. The roles of the M330V and E820D mutations in high-affinity ouabain binding are not explained by the model although an allosteric effect on the helix tilts by the latter replacement may be important. Finally, the sugar residue in the model points between M1 and M4. In this position the C2 and C4 hydroxyls of the rhamnose ring would form hydrogen bonds to E328 and Q127 (Figure 10, white lines), respectively.
Q127 of the H,K ATPase is equivalent to Q111 of the Na,K ATPase where arginine substitution of this residue greatly decreases ouabain sensitivity. Arginine substitution for Q111 in the Na,K ATPase, however, has no effect on rhamnose interaction with the protein (75), suggesting an alternative mode of interference with binding. A possible explanation is that arginine at this position confers resistance by interfering with access of ouabain to its binding site. This interpretation is supported by the apparent access path for the naphthyridine inhibitors (see position of Q127 in Figure 10, lower right, and in Figure 5B, red circle), which may also be the path accessed in the case of ouabain entry in the Na,K ATPase.
SUMMARY
New models for the E1K and E2P conformations of the H,K ATPase were generated by homology modeling from the crystal structures of the E12Ca2+ and E2MgF42− conformations of the srCa ATPase. The E2P model was further modified to account for naphthyridine access to the biochemically defined inhibitor binding site. This new structure is now able to predict a hydrated entry vestibule and channel in the E2P conformer enclosed by M4, M5, M6, M7, and M8. The presence of this channel allows access and binding of the high-affinity K+ competitive inhibitors based on an imidazo[1,2-a]pyridine or naphthyridine structure and successfully identifies low-affinity analogues. The binding of these inhibitors prevents access or binding of K+ to the ion binding site. With K+ bound in the E2K occluded conformation generated from the E2P model, the inhibitor site contracted, thus explaining loss of binding and the K+ competitive nature of inhibition by these reagents. Similarly, the conformation of the enzyme with two occluded K+ ions was derived from the E2P model, and the stability of the structure, especially in the region of the ion binding site, was confirmed in a 10 ns molecular dynamics simulation that included the lipid bilayer and water. The K+ pathways to the occlusion site from the luminal and cytoplasmic sides of the enzyme were also delineated in the new models. Finally, the E2P model could reasonably account for the high-affinity ouabain binding previously defined in a mutant form of the gastric H,K ATPase.
Footnotes
Abbreviations: srCa ATPase, sarcoplasmic reticulum Ca2+-ATPase; omeprazole, 5-methoxy-2-[[(4-methoxy-3,5-dimethyl-2-pyridinyl)methyl]sulfinyl]-1H-benzimidazole; protein-bound form of pantoprazole, [1-(5-difluoromethoxy-1H-benzimidazol-2-yl)-3,4-dimethoxypridinium-2-yl]methyldisulfidyl protein; SCH28080, 3-cyanomethyl-2-methyl-8-(phenylmethoxy)imidazo[1,2-a]pyridine; Byk99, (7R,8R,9R)-7,8-dihydroxy-2,3-dimethyl-9-phenyl-7,8,9,10-tetrahydroimidazo[1,2-h][1,7]naphthyridine; Byk73, (7R,8R,9R)-7,8-dihydroxy-2,3-dimethyl-9-phenyl-10-methyl-7,8,9-trihydroimidazo[1,2-h][1,7]naphthyridine; RMS, root mean square; PCR, polymerase chain reaction; HAD, halo acid dehalogenase; QSAR, quantitative structure–activity relationships; RMSD, root mean square deviation; RMSF, root mean squared fluctuation.
Supported in part by the U.S. Veterans Administration and NIH Grants DK46917, DK53462, and DK58333.
References
- 1.Martin-Vasallo P, Dackowski W, Emanuel JR, Levenson R. Identification of a putative isoform of the Na,K-ATPase beta subunit. Primary structure and tissue-specific expression. J Biol Chem. 1989;264:4613–4618. [PubMed] [Google Scholar]
- 2.Jorgensen PL, Hakansson KO, Karlish SJ. Structure and mechanism of Na,K-ATPase: functional sites and their interactions. Annu Rev Physiol. 2003;65:817–849. doi: 10.1146/annurev.physiol.65.092101.142558. [DOI] [PubMed] [Google Scholar]
- 3.Sarau HM, Foley JJ, Moonsammy G, Sachs G. Metabolism of dog gastric mucosa. Levels of glycolytic, citric acid cycle and other intermediates. J Biol Chem. 1977;252:8572–8581. [PubMed] [Google Scholar]
- 4.Qiu LY, Krieger E, Schaftenaar G, Swarts HG, Willems PH, De Pont JJ, Koenderink JB. Reconstruction of the complete ouabain-binding pocket of Na,K-ATPase in gastric H,K-ATPase by substitution of only seven amino acids. J Biol Chem. 2005;280:32349–32355. doi: 10.1074/jbc.M505168200. [DOI] [PubMed] [Google Scholar]
- 5.Qiu LY, Swarts HG, Tonk EC, Willems PH, Koenderink JB, De Pont JJ. Conversion of the low affinity ouabain-binding site of non-gastric H,K-ATPase into a high affinity binding site by substitution of only five amino acids. J Biol Chem. 2006;281:13533–13539. doi: 10.1074/jbc.M600551200. [DOI] [PubMed] [Google Scholar]
- 6.Sachs G, Shin JM, Howden CW. The clinical pharmacology of proton pump inhibitors. Aliment Pharmacol Ther. 2006;23(Suppl 2):2–8. doi: 10.1111/j.1365-2036.2006.02943.x. [DOI] [PubMed] [Google Scholar]
- 7.Besancon M, Simon A, Sachs G, Shin JM. Sites of reaction of the gastric H,K-ATPase with extracytoplasmic thiol reagents. J Biol Chem. 1997;272:22438–22446. doi: 10.1074/jbc.272.36.22438. [DOI] [PubMed] [Google Scholar]
- 8.Wallmark B, Briving C, Fryklund J, Munson K, Jackson R, Mendlein J, Rabon E, Sachs G. Inhibition of gastric H+,K+-ATPase and acid secretion by SCH 28080, a substituted pyridyl(1,2a)imidazole. J Biol Chem. 1987;262:2077–2084. [PubMed] [Google Scholar]
- 9.Kaminski JJ, Wallmark B, Briving C, Andersson BM. Antiulcer agents. 5. Inhibition of gastric H+/K+-ATPase by substituted imidazo[1,2-a]pyridines and related analogues and its implication in modeling the high affinity potassium ion binding site of the gastric proton pump enzyme. J Med Chem. 1991;34:533–541. doi: 10.1021/jm00106a008. [DOI] [PubMed] [Google Scholar]
- 10.Koenderink JB, Swarts HG, Willems PH, Krieger E, De Pont JJ. A conformation-specific interhelical salt bridge in the K+ binding site of gastric H,K-ATPase. J Biol Chem. 2004;279:16417–16424. doi: 10.1074/jbc.M400020200. [DOI] [PubMed] [Google Scholar]
- 11.Munson K, Garcia R, Sachs G. Inhibitor and ion binding sites on the gastric H,K-ATPase. Biochemistry. 2005;44:5267–5284. doi: 10.1021/bi047761p. [DOI] [PubMed] [Google Scholar]
- 12.Ogawa H, Toyoshima C. Homology modeling of the cation binding sites of Na+K+-ATPase. Proc Natl Acad Sci USA. 2002;99:15977–15982. doi: 10.1073/pnas.202622299. [DOI] [PMC free article] [PubMed] [Google Scholar]
- 13.Olesen C, Sorensen TL, Nielsen RC, Moller JV, Nissen P. Dephosphorylation of the calcium pump coupled to counterion occlusion. Science. 2004;306:2251–2255. doi: 10.1126/science.1106289. [DOI] [PubMed] [Google Scholar]
- 14.Sugita Y, Miyashita N, Ikeguchi M, Kidera A, Toyoshima C. Protonation of the acidic residues in the transmembrane cation-binding sites of the Ca(2+) pump. J Am Chem Soc. 2005;127:6150–6151. doi: 10.1021/ja0427505. [DOI] [PubMed] [Google Scholar]
- 15.Sugita Y, Toyoshima C. Structure and functions of a calcium pump. Tanpakushitsu Kakusan Koso. 2005;50:1271–1277. [PubMed] [Google Scholar]
- 16.Toyoshima C, Inesi G. Structural basis of ion pumping by Ca2+-ATPase of the sarcoplasmic reticulum. Annu Rev Biochem. 2004;73:269–292. doi: 10.1146/annurev.biochem.73.011303.073700. [DOI] [PubMed] [Google Scholar]
- 17.Toyoshima C, Mizutani T. Crystal structure of the calcium pump with a bound ATP analogue. Nature. 2004;430:529–535. doi: 10.1038/nature02680. [DOI] [PubMed] [Google Scholar]
- 18.Toyoshima C, Nomura H. Structural changes in the calcium pump accompanying the dissociation of calcium. Nature. 2002;418:605–611. doi: 10.1038/nature00944. [DOI] [PubMed] [Google Scholar]
- 19.Toyoshima C, Nomura H, Sugita Y. Structural basis of ion pumping by Ca(2+)-ATPase of sarcoplasmic reticulum. FEBS Lett. 2003;555:106–110. doi: 10.1016/s0014-5793(03)01086-x. [DOI] [PubMed] [Google Scholar]
- 20.Clarke DM, Loo TW, Inesi G, MacLennan DH. Location of high affinity Ca2+-binding sites within the predicted transmembrane domain of the sarcoplasmic reticulum Ca2+-ATPase. Nature. 1989;339:476–478. doi: 10.1038/339476a0. [DOI] [PubMed] [Google Scholar]
- 21.Clarke DM, Loo TW, MacLennan DH. Functional consequences of alterations to polar amino acids located in the transmembrane domain of the Ca(2+)-ATPase of sarcoplasmic reticulum. J Biol Chem. 1990;265:6262–6267. [PubMed] [Google Scholar]
- 22.Jewell-Motz EA, Lingrel JB. Site-directed mutagenesis of the Na,K-ATPase: consequences of substitutions of negatively-charged amino acids localized in the transmembrane domains. Biochemistry. 1993;32:13523–13530. doi: 10.1021/bi00212a018. [DOI] [PubMed] [Google Scholar]
- 23.Koster JC, Blanco G, Mills PB, Mercer RW. Substitutions of glutamate 781 in the Na,K-ATPase alpha subunit demonstrate reduced cation selectivity and an increased affinity for ATP. J Biol Chem. 1996;271:2413–2421. doi: 10.1074/jbc.271.5.2413. [DOI] [PubMed] [Google Scholar]
- 24.Kuntzweiler TA, Arguello JM, Lingrel JB. Asp804 and Asp808 in the transmembrane domain of the Na,K-ATPase alpha subunit are cation coordinating residues. J Biol Chem. 1996;271:29682–29687. doi: 10.1074/jbc.271.47.29682. [DOI] [PubMed] [Google Scholar]
- 25.Vagin O, Munson K, Lambrecht N, Karlish SJ, Sachs G. Mutational analysis of the K+-competitive inhibitor site of gastric H,K-ATPase. Biochemistry. 2001;40:7480–7490. doi: 10.1021/bi0105328. [DOI] [PubMed] [Google Scholar]
- 26.Koenderink JB, Swarts HG, Stronks HC, Hermsen HP, Willems PH, De Pont JJ. Chimeras of X+, K+-ATPases. The M1–M6 region of Na+, K+-ATPase is required for Na+-activated ATPase activity, whereas the M7–M10 region of H+, K+-ATPase is involved in K+ de-occlusion. J Biol Chem. 2001;276:11705–11711. doi: 10.1074/jbc.M010804200. [DOI] [PubMed] [Google Scholar]
- 27.Segall L, Lane LK, Blostein R. Insights into the structural basis for modulation of E1↔E2 transitions by cytoplasmic domains of the Na,K-ATPase alpha subunit. Ann NY Acad Sci. 2003;986:58–62. doi: 10.1111/j.1749-6632.2003.tb07139.x. [DOI] [PubMed] [Google Scholar]
- 28.Hebert H, Purhonen P, Thomsen K, Vorum H, Maunsbach AB. Renal Na,K-ATPase structure from cryo-electron microscopy of two-dimensional crystals. Ann NY Acad Sci. 2003;986:9–16. doi: 10.1111/j.1749-6632.2003.tb07132.x. [DOI] [PubMed] [Google Scholar]
- 29.Andersen JP, Clausen JD, Einholm AP, Vilsen B. Mutagenesis of residues involved in control of the Ca2+ entry pathway and conformational changes associated with Ca2+ binding in the SR Ca2+-ATPase. Ann NY Acad Sci. 2003;986:72–81. doi: 10.1111/j.1749-6632.2003.tb07141.x. [DOI] [PubMed] [Google Scholar]
- 30.Clausen JD, McIntosh DB, Woolley DG, Anthonisen AN, Vilsen B, Andersen JP. Asparagine 706 and glutamate 183 at the catalytic site of sarcoplasmic reticulum Ca2+-ATPase play critical but distinct roles in E2 states. J Biol Chem. 2006;281:9471–9481. doi: 10.1074/jbc.M512371200. [DOI] [PubMed] [Google Scholar]
- 31.Toustrup-Jensen M, Vilsen B. Interaction between the catalytic site and the A-M3 linker stabilizes E2/E2P conformational states of Na+,K+-ATPase. J Biol Chem. 2005;280:10210–10218. doi: 10.1074/jbc.M411214200. [DOI] [PubMed] [Google Scholar]
- 32.Munson KB, Gutierrez C, Balaji VN, Ramnarayan K, Sachs G. Identification of an extracytoplasmic region of H+,K+-ATPase labeled by a K(+)-competitive photoaffinity inhibitor. J Biol Chem. 1991;266:18976–18988. [PubMed] [Google Scholar]
- 33.Toyoshima C, Nomura H, Tsuda T. Lumenal gating mechanism revealed in calcium pump crystal structures with phosphate analogues. Nature. 2004;432:361–368. doi: 10.1038/nature02981. [DOI] [PubMed] [Google Scholar]
- 34.Danko S, Yamasaki K, Daiho T, Suzuki H. Distinct natures of beryllium fluoride-bound, aluminum fluoride-bound, and magnesium fluoride-bound stable analogues of an ADP-insensitive phosphoenzyme intermediate of sarcoplasmic reticulum Ca2+-ATPase: changes in catalytic and transport sites during phosphoenzyme hydrolysis. J Biol Chem. 2004;279:14991–14998. doi: 10.1074/jbc.M313363200. [DOI] [PubMed] [Google Scholar]
- 35.Andersson K, Carlsson E. Potassium-competitive acid blockade: a new therapeutic strategy in acid-related diseases. Pharmacol Ther. 2005;108:294–307. doi: 10.1016/j.pharmthera.2005.05.005. [DOI] [PubMed] [Google Scholar]
- 36.Toyoshima C, Nakasako M, Nomura H, Ogawa H. Crystal structure of the calcium pump of sarcoplasmic reticulum at 2.6 Å resolution. Nature. 2000;405:647–655. doi: 10.1038/35015017. [DOI] [PubMed] [Google Scholar]
- 37.Schackmann R, Schwartz A, Saccomani G, Sachs G. Cation transport by gastric H+:K+ ATPase. J Membr Biol. 1977;32:361–381. doi: 10.1007/BF01905228. [DOI] [PubMed] [Google Scholar]
- 38.Hakansson KO. The crystallographic structure of Na,K-ATPase N-domain at 2.6Å resolution. J Mol Biol. 2003;332:1175–1182. doi: 10.1016/j.jmb.2003.07.012. [DOI] [PubMed] [Google Scholar]
- 39.Hilge M, Siegal G, Vuister GW, Guntert P, Gloor SM, Abrahams JP. ATP-induced conformational changes of the nucleotide-binding domain of Na,K-ATPase. Nat Struct Biol. 2003;10:468–474. doi: 10.1038/nsb924. [DOI] [PubMed] [Google Scholar]
- 40.Ponder JW, Richards FM. Tertiary templates for proteins. Use of packing criteria in the enumeration of allowed sequences for different structural classes. J Mol Biol. 1987;193:775–791. doi: 10.1016/0022-2836(87)90358-5. [DOI] [PubMed] [Google Scholar]
- 41.Richardson JSR, DC . Principles and Patterns of Protein Conformation. Plenum Press; New York: 1990. [Google Scholar]
- 42.Obara K, Miyashita N, Xu C, Toyoshima I, Sugita Y, Inesi G, Toyoshima C. Structural role of countertransport revealed in Ca(2+) pump crystal structure in the absence of Ca-(2+) Proc Natl Acad Sci USA. 2005;102:14489–14496. doi: 10.1073/pnas.0506222102. [DOI] [PMC free article] [PubMed] [Google Scholar]
- 43.Humphrey W, Dalke A, Schulten K. VMD: visual molecular dynamics. J Mol Graphics. 1996;14:33–38. 27–28. doi: 10.1016/0263-7855(96)00018-5. [DOI] [PubMed] [Google Scholar]
- 44.Grubmuller H, Heymann B, Tavan P. Ligand binding: molecular mechanics calculation of the streptavidin-biotin rupture force. Science. 1996;271:997–999. doi: 10.1126/science.271.5251.997. [DOI] [PubMed] [Google Scholar]
- 45.MacKerrell AD, Bashford D, Bellott M, Dunbrack RL, Evanseck JD, Field MJ, Fischer S, Gao J, Guo H, Ha S, Joseph-McCartney D, Kuchnir L, Kuczera K, Lau FTK, Mattos C, Michnick S, Ngo T, Nguyen DT, Prodhom B, Reiher WE, Roux B, Schlenkrich M, Smith JC, Stote R, Straub J, Watanabe M, Wiorkiewicz-Kuczera J, Yin D, Karplus M. All-atom empirical potential for molecular modeling and dynamics studies of proteins. J Phys Chem B. 1998;102:3586–3616. doi: 10.1021/jp973084f. [DOI] [PubMed] [Google Scholar]
- 46.Kalé L, Skeel R, Bhandarkar M, Brunner R, Gursoy A, Krawetz N, Phillips J, Shinozaki A, Varadarajan K, Schulten K. NAMD2: Greater scalability for parallel molecular dynamics. J Comput Phys. 1999;151:283–312. [Google Scholar]
- 47.Ryckaert JP, Ciccotti G, Berendsen HJC. Numerical integration of the Cartesian equations of motion of a system with constraints: molecular dynamics of n-alkanes. J Comput Phys. 1977;23:327. [Google Scholar]
- 48.Goodsell DS, Morris GM, Olson AJ. Automated docking of flexible ligands: applications of AutoDock. J Mol Recognit. 1996;9:1–5. doi: 10.1002/(sici)1099-1352(199601)9:1<1::aid-jmr241>3.0.co;2-6. [DOI] [PubMed] [Google Scholar]
- 49.Lowry OH, Rosebrough NJ, Farr AL, Randall RJ. Protein measurement with the Folin phenol reagent. J Biol Chem. 1951;193:265–275. [PubMed] [Google Scholar]
- 50.Vagin O, Denevich S, Munson K, Sachs G. SCH28080, a K+-competitive inhibitor of the gastric H,K-ATPase, binds near the M5-6 luminal loop, preventing K+ access to the ion binding domain. Biochemistry. 2002;41:12755–12762. doi: 10.1021/bi025921w. [DOI] [PubMed] [Google Scholar]
- 51.Jacobsen MD, Pedersen PA, Jorgensen PL. Importance of Na,K-ATPase residue alpha 1-Arg544 in the segment Arg544-Asp567 for high-affinity binding of ATP, ADP, or MgATP. Biochemistry. 2002;41:1451–1456. doi: 10.1021/bi015891h. [DOI] [PubMed] [Google Scholar]
- 52.Patchornik G, Munson K, Goldshleger R, Shainskaya A, Sachs G, Karlish SJ. The ATP-Mg2+ binding site and cytoplasmic domain interactions of Na+,K+-ATPase investigated with Fe2+-catalyzed oxidative cleavage and molecular modeling. Biochemistry. 2002;41:11740–11749. doi: 10.1021/bi026334d. [DOI] [PubMed] [Google Scholar]
- 53.Horisberger JD, Kharoubi-Hess S, Guennoun S, Michielin O. The fourth transmembrane segment of the Na,K-ATPase alpha subunit: a systematic mutagenesis study. J Biol Chem. 2004;279:29542–29550. doi: 10.1074/jbc.M400585200. [DOI] [PubMed] [Google Scholar]
- 54.Capendeguy O, Horisberger JD. The role of the third extracellular loop of the Na+,K+-ATPase alpha subunit in a luminal gating mechanism. J Physiol. 2005;565:207–218. doi: 10.1113/jphysiol.2004.080218. [DOI] [PMC free article] [PubMed] [Google Scholar]
- 55.Asano S, Yoshida A, Yashiro H, Kobayashi Y, Morisato A, Ogawa H, Takeguchi N, Morii M. The cavity structure for docking the K(+)-competitive inhibitors in the gastric proton pump. J Biol Chem. 2004;279:13968–13975. doi: 10.1074/jbc.M308934200. [DOI] [PubMed] [Google Scholar]
- 56.Keeling DJ, Taylor AG, Schudt C. The binding of a K+ competitive ligand, 2-methyl,8-(phenylmethoxy)imidazo-(1,2-a)pyridine 3-acetonitrile, to the gastric (H+ + K+)-ATPase. J Biol Chem. 1989;264:5545–5551. [PubMed] [Google Scholar]
- 57.Shin JM, Cho YM, Sachs G. Chemistry of covalent inhibition of the gastric (H+, K+)-ATPase by proton pump inhibitors. J Am Chem Soc. 2004;126:7800–7811. doi: 10.1021/ja049607w. [DOI] [PubMed] [Google Scholar]
- 58.Rabon EC, McFall TL, Sachs G. The gastric [H,K]ATPase:H+/ATP stoichiometry. J Biol Chem. 1982;257:6296–6299. [PubMed] [Google Scholar]
- 59.Rabon EC, Smillie K, Seru V, Rabon R. Rubidium occlusion within tryptic peptides of the H,K-ATPase. J Biol Chem. 1993;268:8012–8018. [PubMed] [Google Scholar]
- 60.Swarts HG, Koenderink JB, Willems PH, Krieger E, De Pont JJ. Asn792 participates in the hydrogen bond network around the K+-binding pocket of gastric H,K-ATPase. J Biol Chem. 2005;280:11488–11494. doi: 10.1074/jbc.M412321200. [DOI] [PubMed] [Google Scholar]
- 61.Clarke DM, Loo TW, Rice WJ, Andersen JP, Vilsen B, MacLennan DH. Functional consequences of alterations to hydrophobic amino acids located in the M4 transmembrane sector of the Ca(2+)-ATPase of sarcoplasmic reticulum. J Biol Chem. 1993;268:18359–18364. [PubMed] [Google Scholar]
- 62.Law RJ, Capener C, Baaden M, Bond PJ, Campbell J, Patargias G, Arinaminpathy Y, Sansom MS. Membrane protein structure quality in molecular dynamics simulation. J Mol Graphics Modell. 2005;24:157–165. doi: 10.1016/j.jmgm.2005.05.006. [DOI] [PubMed] [Google Scholar]
- 63.Shrivastava IH, Sansom MS. Simulations of ion permeation through a potassium channel: molecular dynamics of KcsA in a phospholipid bilayer. Biophys J. 2000;78:557–570. doi: 10.1016/S0006-3495(00)76616-1. [DOI] [PMC free article] [PubMed] [Google Scholar]
- 64.de Groot BL, Grubmuller H. Water permeation across biological membranes: mechanism and dynamics of aquaporin-1 and GlpF. Science. 2001;294:2353–2357. doi: 10.1126/science.1066115. [DOI] [PubMed] [Google Scholar]
- 65.Law RJ, Sansom MS. Homology modelling and molecular dynamics simulations: comparative studies of human aquaporin-1. Eur Biophys J. 2004;33:477–489. doi: 10.1007/s00249-004-0398-z. [DOI] [PubMed] [Google Scholar]
- 66.Tajkhorshid E, Nollert P, Jensen MO, Miercke LJ, O’Connell J, Stroud RM, Schulten K. Control of the selectivity of the aquaporin water channel family by global orientational tuning. Science. 2002;296:525–530. doi: 10.1126/science.1067778. [DOI] [PubMed] [Google Scholar]
- 67.Law RJ, Henchman RH, McCammon JA. A gating mechanism proposed from a simulation of a human alpha7 nicotinic acetylcholine receptor. Proc Natl Acad Sci USA. 2005;102:6813–6818. doi: 10.1073/pnas.0407739102. [DOI] [PMC free article] [PubMed] [Google Scholar]
- 68.Melle-Milovanovic D, Milovanovic M, Nagpal S, Sachs G, Shin JM. Regions of association between the alpha and the beta subunit of the gastric H,K-ATPase. J Biol Chem. 1998;273:11075–11081. doi: 10.1074/jbc.273.18.11075. [DOI] [PubMed] [Google Scholar]
- 69.Wallmark B, Mardh S. Phosphorylation and dephosphorylation kinetics of potassium-stimulated ATP phosphohydrolase from hog gastric mucosa. J Biol Chem. 1979;254:11899–11902. [PubMed] [Google Scholar]
- 70.Wallmark B, Stewart HB, Rabon E, Saccomani G, Sachs G. The catalytic cycle of gastric (H+ + K+)-ATPase. J Biol Chem. 1980;255:5313–5319. [PubMed] [Google Scholar]
- 71.Cohen E, Goldshleger R, Shainskaya A, Tal DM, Ebel C, le Maire M, Karlish SJ. Purification of Na+,K+-ATPase expressed in Pichia pastoris reveals an essential role of phospholipid-protein interactions. J Biol Chem. 2005;280:16610–16618. doi: 10.1074/jbc.M414290200. [DOI] [PubMed] [Google Scholar]
- 72.Swarts HG, Koenderink JB, Hermsen HP, Willems PH, De Pont JJ. K(+)-independent gastric H(+),K-(+)-ATPase activity. Dissociation of K(+)-independent dephosphorylation and preference for the E1 conformation by combined mutagenesis of transmembrane glutamate residues. J Biol Chem. 2001;276:36909–36916. doi: 10.1074/jbc.M103945200. [DOI] [PubMed] [Google Scholar]
- 73.Burns EL, Nicholas RA, Price EM. Random mutagenesis of the sheep Na,K-ATPase alpha1 subunit generating the ouabain-resistant mutant L793P. J Biol Chem. 1996;271:15879–15883. doi: 10.1074/jbc.271.27.15879. [DOI] [PubMed] [Google Scholar]
- 74.Cantley LG, Cunha MJ, Zhou XM. Ouabain-resistant OR6 cells express the murine alpha 1-subunit of the Na,K-ATPase with a T797–I797 substitution. J Biol Chem. 1994;269:15358–15361. [PubMed] [Google Scholar]
- 75.O’Brien WJ, Wallick ET, Lingrel JB. Amino acid residues of the Na,K-ATPase involved in ouabain sensitivity do not bind the sugar moiety of cardiac glycosides. J Biol Chem. 1993;268:7707–7712. [PubMed] [Google Scholar]