

Abstract
Vascularization of transplanted islets must be maintained to provide long-term graft function. In vivo assessment of new vessel formation in islet grafts has been poorly documented. The purpose of this study was to investigate whether neovascularization was detectable in vivo in a Feridex-labeled murine syngeneic subcapsular islet mass using DCE MRI over 180 days. Subcapsular transplants could be visualized at post-transplant days three, seven, 14, and 28 using T2-weighted MRI and at post-transplant day 180 by immunohistochemistry. Injection of the contrast agent gadolinium (Gd)-DTPA for DCE at three, seven, and 14 days showed increased signal in the transplant area consistent with new vessel formation. Areas under contrast enhancement curves suggested peak angiogenesis at 14 days. At 180 days, there was no observable change in signal intensity after contrast injection suggesting established vascularization or islet mass reduction. Immunohistochemistry confirmed MRI and DCE findings. These data suggest that islet angiogenesis occurs early after transplantation and is likely established after one month of transplantation. This study provides an in vivo time-line of neovascularization in subcapsular islet grafts. We anticipate that contrast extravasation captured by MRI may provide useful monitoring of graft angiogenesis if reproduced in a clinically relevant intraportal model.
Keywords: islet transplantation, imaging, vascularization, in vivo, MRI
Pancreatic islet transplantation is a promising therapy for patients with type 1 diabetes (1, 2). However, long-term insulin independence is frequently not sustainable presumably because of hypoxic, inflammatory, and immune damage to islets (3). In a healthy pancreas, islets are in a nutrient-rich environment with highly oxygenated blood. After transplantation, islets are subject to hypoxia from initial avascularity (4, 5), and it is estimated that approximately 50–70% of islets are lost in the immediate post-transplantation period (50–70%), along with functional impairment of the remaining surviving islets (3, 6, 7). A total of two to four pancreatic donors are sometimes required for a sufficiently functional islet transplant (1). Despite the above challenges, there is an obvious paucity of in vivo methods to monitor islet fate and in particular, new vessel formation in islet grafts.
Several studies have shown that in vivo MRI of transplanted rodents can be used to localize islets labeled with SPIO under high resolution (8–10). It has also been recently demonstrated that MRI monitoring of SPIO-labeled islets can be applied clinically to intrahepatic islet transplantation in patients with type 1 diabetes (11).
To chronicle islet graft neovascularization in vivo, we used contrast extravasation to characterize neovascularization. DCE MRI is an imaging modality that can be used to non-invasively measure key hemodynamic parameters such as blood flow, blood volume, interstitial volume and capillary permeability in real time. This method has been used clinically to assess tumor angiogenesis and the vascular effects of anticancer therapies (12–16).
In a pilot short-term trial, we previously reported that DCE MRI can be used to evaluate neovascularization non-invasively in islets transplanted under the kidney capsule (10). We first described a macroscopic timeline for islet angiogenesis, then confirmed that iron labeling of islets allowed localization of islet grafts as hypointense regions on post-transplant days three and 14. In our previous study, DCE MRI revealed increased contrast enhancement on day 14 compared with day three suggesting temporal evolution of new vessel formation. Here, we detail the chronology of progression of vascularization hemodynamically by including earlier and later time points, and quantify the extent of MR-captured neovascularization to allow future functional correlation studies. In addition, we present concomitant immunohistochemical identification of iron-labeled cells, islets, and new vessels.
Materials and methods
Animals
Adult female Balb/c mice weighing 25–30 g were purchased (Charles River, Wilmington, MA, USA) and housed under specific pathogen-free conditions with a 12-h light/dark cycle and had free access to food and water. All care and handling of animals was in accordance with institutional regulations. The Loma Linda University Institutional Animal Care Use Committee approved all experimental protocols.
Islet transplantation studies
Islets were isolated by collagenase digestion of the pancreas and separated from exocrine tissue by a discontinuous Ficoll density gradient centrifugation and then hand-picked (10). Iron labeling of islets was performed by overnight co-culture of freshly isolated islets in Feridex (Advanced Magnetics Inc., Cambridge, MA, USA) supplemented medium at 200 μg iron/mL as previously described (10). Five hundred syngeneic islets were transplanted under the kidney capsule of normal recipients as a single mass. Three animals were used to produce results at each time point.
MRI
MRI was performed at three, seven, 14, 28, and 180 days after transplantation. Imaging was undertaken to (i) identify the location of the islets on the kidney and (ii) use DCE imaging as a surrogate marker for angiogenesis. All MRI data were collected on a Bruker Advance 11.7 T MRI (8.9 cm bore) with a 3.0 cm (ID) volume radiofrequency coil (Bruker Biospin, Billerica, MA, USA). Mice were lightly anesthetized using isoflurane (3% induction and 1% maintenance). A tail vein catheter was inserted and fastened to the tail for infusion of gadolinium-DTPA [Gd-DTPA,-BMA, Gadodiamide, 0.1 mmol/kg body weight (0.2 mL/kg), Omniscan; Amersham Health, Princeton, NJ, USA] contrast. Body temperature was maintained at 35–37 ± 1 °C using a thermostat-controlled heated water cushion placed under the mouse. Respiration was monitored with a MR-compatible pressure transducer on a Biopac MP150 (Goleta, CA, USA) system. Scout images were obtained in the axial, sagittal, and coronal planes to accurately position slices.
Three MR sequences were acquired: (i) A 10 echo T2 sequence composed of a TR/TE of 4697/10.2 ms, a 256 matrix, a 3 cm FOV, two averages for a total acquisition time of 40 min, (ii) The pre/post-contrast T1 was composed of a TR/TE of 837.1/10.2 ms, a 256 matrix, 3 cm FOV, and four averages for a total acquisition time of 14 min. The standard T2 and T1 sequences collected 20 coronal slices that were 0.80 mm thick and interleaved by 0.80 mm, and (iii) the DCE sequence acquired one image slice through the kidney at the level of the islets using a TR/TE = 250/20 ms, 128 matrix, 3 cm FOV, one average for an acquisition time of 32 s/image and a total acquisition time of 32 min with 60 images collected.
The T2 and precontrast T1 images were visually evaluated to identify the location of the transplanted islets in each animal. The single DCE acquisition slice was then placed over the region of maximal volume of the transplanted islets. At each time point, three non-diabetic transplant recipients underwent DCE MRI to non-invasively quantify islet graft vascularization as evidenced by contrast enhancement. Contrast (Gd-DTPA 0.1 mmol/kg) was delivered as a bolus injection via tail vein catheter two min after the start of the imaging sequence.
DCE analysis
Temporal change of signal intensity was visualized and quantified using JIM software (Thorpe Waterville, UK). Three regions of interest, islet, muscle, and kidney were outlined on the DCE images based on T1 high-resolution images. Kinetic analysis used a bidirectional two-compartment model based on the equations of Tofts (17). All signal intensities were converted to [Gd] values by averaging pre-contrast R1 (1/T1), and assuming that
where ρ = 1 as we assumed that there was no difference between plasma relaxivity (relaxivity of the contrast agent in plasma) and interstitial relaxivity (relaxivity of the contrast agent in the extra-vascular extracellular space) and R1pre is the average precontrast R1.
In the standard Tofts model, the tissue [Gd], Ct (t) is related to the plasma [Gd], Cp (t) by:
where ve is the extra-vascular extracellular space volume fraction. This model neglects any contribution to the signal intensity of the passing contrast in intact blood vessels within the tissue of interest. The AIF was defined from the abdominal aorta that was visible within the slice of interest. DCE MRI tissue Gd concentration curves extracted from JIM software were normalized for inter- and intra-animal comparisons.
Histology and immunohistochemistry
After the last imaging time point, kidneys were removed and fixed in 10% formalin and embedded in paraffin. At the level of the transplanted islets, 5-μm sections were cut with serial sections processed for H&E and PB for iron particles within the transplanted islets. Briefly, sections were immersed in 10% potassium ferrocyanide (Fisher Scientific, Pittsburg, PA, USA) for five min, in PB solution containing 5% potassium ferrocyanide and 10% hydrochloric acid for 30 min and counterstained with nuclear fast red (Sigma-Aldrich, St Louis, MO, USA).
Immunohistochemistry was performed to confirm the presence of insulin in the islets and vWF for newly formed blood vessels. Specifically, sections were deparaffininized in xylene and hydrated. To restore immunoreactivity of antigens for anti-vWF, the specimens were treated with Proteinase K (Dako, Carpinteria, CA, USA) for two min. Endogenous peroxidase activitiy was blocked by treatment of 0.1% hydrogen peroxide for 30 min. Non-specific binding was blocked by treatment with 10% goat serum for 30 min. Specimens were incubated with either: guinea pig anti-insulin antibody (1:100; Dako) or rabbit anti-vWF (1:500; Abcam, Cambridge, MA, USA) for 90 min at room temperature. Biotinylated anti-rabbit IgG antibody treatment for 30 min was followed by streptavidin-conjugated horse-radish peroxidase treatment for 30 additional minutes (Vectastain Elite ABC kit; Vector Laboratories, Burlingame, CA, USA). Bound peroxidase was developed with 3–3′-di-aminobenzidine (brown; Dako) for vWF (Red; Dako) for insulin and counterstained with hematoxylin.
Statistical analysis
Statistical evaluation of AUC from DCE curves was performed using SIGMASTAT software (SPPS, Chicago, IL, USA) and differences among experimental groups were considered significant for p < 0.05. ANOVA was performed with a Tukey post hoc test to evaluate significance at each time point. Data were expressed as the mean ± s.e.m.
Results
Islets transplanted under the kidney capsule were readily visualized in all animals in the immediate post-transplant period. The labeled islets underwent subsequent non-invasive T2-weighted imaging at three, seven, 14, and 28 days post-transplantation. Iron-labeled islets were visualized in each animal at each time point except day 180. Arrows in Fig. 1 indicate hypointense regions under the kidney capsule characteristic of iron-labeled islets. By 180 days post-transplantation, no labeled islets could be seen by in vivo MRI in any of the animals.
Fig. 1.
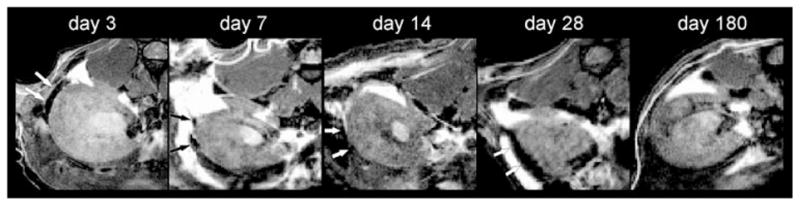
Representative T2-weighted imaging of Feridex labeled islets under the kidney capsule at three, seven, 14, 28, and 180 days post-transplantation. Islets are visible as hypointensities (white arrow) at all early time points, but not at day 180 post-transplantation.
To detect transplanted islets, histological examination was performed on days 14, 28, and 180 post-transplantation (Fig. 2). PB and insulin staining were confined to the subcaspsular region of the kidney (site of the transplant). PB staining indicated the presence of iron-labeled islets at all time points. These iron-labeled islets were also seen as brown regions in the H&E sections. Insulin immunohistochemical analysis suggests a decrease in insulin staining at day 180 compared with days 14 and 28. A change in distribution of iron-positive cells is also noted over time. Iron-positive cells appeared deeper within the renal parenchyma in the early time points, but were mostly in the external subcapsular margin by day 180. Staining for new vessels is shown in a separate figure.
Fig. 2.
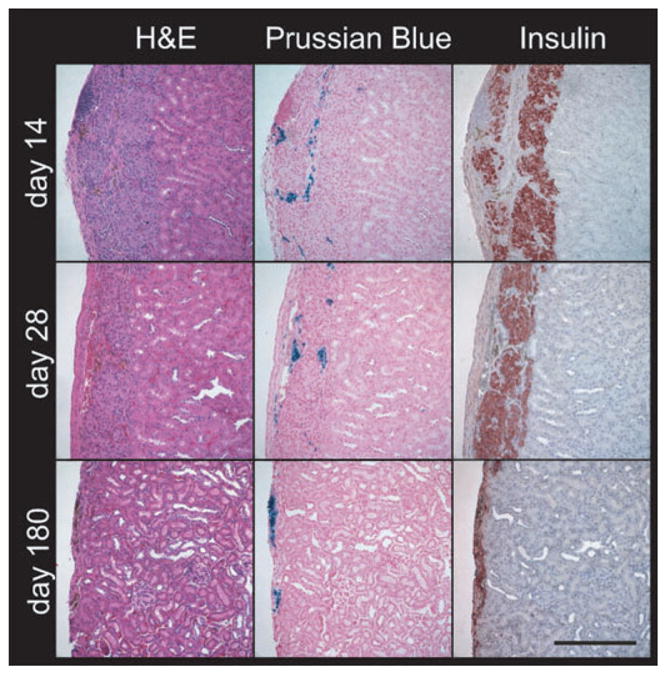
Representative immunohistochemistry of islet grafts. Kidneys with islet grafts were recovered on days 14, 28, and 180 post-transplantation, and consecutive sections were processed for H&E, PB for iron particles, and insulin for the presence of islets. PB reveals the iron-labeled islets in the subcapsular region of the kidney at days 14, 28, and 180. Unstained iron can be seen in H&E sections as brown regions at all three time points. Strong insulin immunostaining (red) shows the presence of islets at days 14 and 28 compared with weaker staining at day 180. Scale bar, 250 μm.
The dynamics of contrast enhancement in the islet grafts can be seen in Fig. 3. Normalized maximal tissue concentration of contrast increased progressively from three to 14 days, and then decreased at 28 days (Fig. 3a). Time to maximal relative gadolinium concentration was 5.47 ± 1.21, 6.29 ± 2.03, 7.09 ± 0.81, and 6.26 ± 1.60 min at three, seven, 14, and 28 days, respectively. Time to peak was not significantly different between the different days, but contrast enhancement over time AUC analysis showed a clear trend towards a peak at day 14 relative to all other time points which was significant (ANOVA p = 0.03, Fig. 3b). There was a significant difference in AUC between days three and 14, p = 0.02. AUC up to the peak concentration point showed the same trend to peak enhancement at day 14. There were no discernible islets on T2 MRI at day 180 to warrant further hemodynamic analysis.
Fig. 3.

Temporal evolution of DCE MRI. (a) DCE imaging of subcapsular islet graft reveals peak enhancement at 14 days post-transplantation. (b) AUC analysis shows a progressive increase in overall enhancement over the total imaging time of 32 min (ANOVA p = 0.03 with Tukey post hoc test, p = 0.02). Data were averaged from all animals at each time point, n = 3.
vWF, an endothelial marker of newly formed blood vessels, was used to follow the temporal evolution of new blood vessels in the islet graft region (Fig. 4) at the same time points selected for MRI. Post-transplant day three showed disorganized vWF immunostaining, which was better outlined at day seven and more abundant at day 14. The vWF-stained vessels at day 28 appeared larger in size, suggesting a maturation process. No vWF immunostaining was observed at day 180.
Fig. 4.
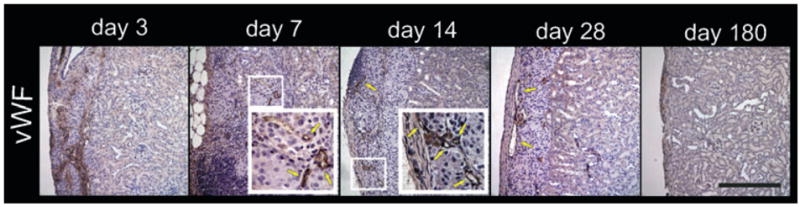
Representative temporal vascularization of islet grafts. Kidneys with islet grafts were recovered on days 3, 7, 14, 28, and 180 post-transplantation, and immunohistochemistry of anti-vWF (brown; a marker of newly formed blood vessels) was performed. Day 3 shows disorganized staining of vWF. Day 7 shows some microvessels, which are more clearly delineated at day 14 (yellow arrows indicate vessels). Day 28 is similar to day 14 with apparently larger microvessels. Day 180 shows absence of vWF staining. [These sections were immediately adjacent to sections in Fig. 2. Hence the brown in day 180 indicates iron not vWF as can be seen in corresponding H&E section (Fig. 2)]. Scale bar, 250 μm.
Discussion
In the above study, we tested the applicability of DCE MRI for assessment of neovascularization in islet grafts. To our knowledge, this is the first study to employ the clinically applicable concept of contrast extravasation to the field of islet transplantation. Lack of long-term visualization of labeled islets by MRI in our study contrasts with data by others (8, 9) who transplanted up to 1000 islets under the kidney capsule. Therefore, MR visibility may be highly dependent on islet number, and the negative localization of islets at 180 days in our study may be related to the smaller (500) islet mass we used. In addition, islet loss or redistribution over time may have lead to the reduced T2 signal and lack of visualization by MRI.
Analysis of areas under contrast enhancement curves was only significant at day 16. The trend portrayed by the curves is consistent with both our histological data, as well as reports by other groups (18–20). It is possible therefore that the use of more animals would result in significant differences at seven and 28 days. Use of heat-inactivated islets for transplantation could serve as a control for density and mass effects.
It remains to be validated whether the use of a two-compartment model is optimal for the assessment of an islet graft, or whether a three-compartment model needs to be developed. As contrast enhancement is assessed relative to aortic blood flow, normalization of data may be refined by testing the variability of the AIF between study subjects. To balance sensitivity and specificity of islet imaging, positron emission tomography may be needed in addition to MRI for adequate islet volume assessment.
Our histological data show a change of distribution of iron-positive cells with time. This may reflect the lack of specificity of iron labeling or subsequent uptake of dead islets by macrophages. Such “false labeling” therefore can lead to overestimation of islet mass at the early post-transplant stage. Transplantation of an adequate islet mass under the kidney capsule may be visible on T2 MRI without iron labeling, a concept which would be more appealing in clinical practice. The apparent decrease in insulin-positive cells with time is consistent with previously described post-transplant islet loss, which might have been more or less exaggerated if human islets were used in an immunodeficient model.
Immunohistochemical staining results suggest that new vessel formation starts by post-transplant day three, peaks at day 14, and is complete after day 28. The use of vWF as a marker of new vessel formation has not been agreed on particularly in rodent models where it has previously produced inconsistent results (20–22). It is also unclear whether endothelial markers for microvessels are different from macrovessels. At day 180, it is safe to assume that a mature network of blood vessels supplies the islets as they were clearly present at this late time point albeit drastically reduced in number. Thus, a marker for established rather than evolving blood vessels, e.g., alpha smooth muscle actin, might have confirmed and complemented the vascularization time-line shown above.
The small recipient numbers and lack of microvascular density quantification make this more of a pilot trial which can greatly benefit from future in depth larger scale analysis. A natural extension of this study would be to use DCE/MRI in assessment of islet neovascularization in a diabetic model correlating DCE data with islet function. The ultimate in vivo methodology for assessment of islet neovascularization, including mathematical models, will likely be very dependent on the transplant site, and the general progress of in vivo imaging modalities applicable to transplanted and native islets. Our study offers what we believe to be a valid approach to addressing the dynamics of vascularization of islet grafts. Such hemodynamic monitoring, if applicable in an intraportal model, may be relevant to other cellular and organ transplants, and thus pave the way to strategies enhancing graft survival in clinical settings.
Acknowledgments
This work was supported by NIH/NIDDK grant number 1R01-DK077541 (EH). We are very grateful for the technical assistance provided by John Chrisler, Pete Hayes, John Hough, and Serafin Lalas.
Abbreviations
- AIF
arterial input function
- AUC
area under the curve
- DCE
dynamic contrast-enhanced
- DTPA
diethylene triamine pentaacetic acid
- FOV
field of view
- H&E
hematoxylin and eosin
- MR
magnetic resonance
- MRI
magnetic resonance imaging
- PB
Prussian Blue
- SPIO
superparamagnetic iron particles
- TE
echo time
- TR
repetition time
- vWF
von Willebrand factor
References
- 1.Shapiro AM, Lakey JR, Ryan EA, et al. Islet transplantation in seven patients with type 1 diabetes mellitus using a gluco-corticoid-free immunosuppressive regimen. N Engl J Med. 2000;343:230–238. doi: 10.1056/NEJM200007273430401. [DOI] [PubMed] [Google Scholar]
- 2.Ryan EA, Paty BW, Senior PA, et al. Five-year follow-up after clinical islet transplantation. Diabetes. 2005;54:2060–2069. doi: 10.2337/diabetes.54.7.2060. [DOI] [PubMed] [Google Scholar]
- 3.Davalli AM, Ogawa Y, Ricordi C, Scharp DW, Bonner -Weir S, Weir GC. A selective decrease in the beta cell mass of human islets transplanted into diabetic nude mice. Transplantation. 1995;59:817–820. [PubMed] [Google Scholar]
- 4.Carlsson PO, Palm F, Mattsson G. Low revascularization of experimentally transplanted human pancreatic islets. J Clin Endocrinol Metab. 2002;87:5418–5423. doi: 10.1210/jc.2002-020728. [DOI] [PubMed] [Google Scholar]
- 5.Mattsson G, Jansson L, Carlsson PO. Decreased vascular density in mouse pancreatic islets after transplantation. Diabetes. 2002;51:1362–1366. doi: 10.2337/diabetes.51.5.1362. [DOI] [PubMed] [Google Scholar]
- 6.Davalli AM, Scaglia L, Zangen DH, Hollister J, Bonner-Weir S, Weir GC. Vulnerability of islets in the immediate posttransplantation period. Dynamic changes in structure and function. Diabetes. 1996;45:1161–1167. doi: 10.2337/diab.45.9.1161. [DOI] [PubMed] [Google Scholar]
- 7.Mattsson G, Jansson L, Nordin A, Andersson A, Carlsson PO. Evidence of functional impairment of syngeneically transplanted mouse pancreatic islets retrieved from the liver. Diabetes. 2004;53:948–954. doi: 10.2337/diabetes.53.4.948. [DOI] [PubMed] [Google Scholar]
- 8.Evgenov NV, Medarova Z, Dai G, Bonner-Weir S, Moore A. In vivo imaging of islet transplantation. Nat Med. 2006;12:144–148. doi: 10.1038/nm1316. [DOI] [PubMed] [Google Scholar]
- 9.Jirak D, Kriz J, Herynek V, et al. MRI of transplanted pancreatic islets. Magn Reson Med. 2004;52:1228–1233. doi: 10.1002/mrm.20282. [DOI] [PubMed] [Google Scholar]
- 10.Hathout E, Sowers L, Wang R, et al. In vivo magnetic resonance imaging of vascularization in islet transplantation. Transpl Int. 2007;20:1059–1065. doi: 10.1111/j.1432-2277.2007.00550.x. [DOI] [PMC free article] [PubMed] [Google Scholar]
- 11.Toso C, Vallee JP, Morel P, et al. Clinical magnetic resonance imaging of pancreatic islet grafts after iron nanoparticle labeling. Am J Transplant. 2008;8:701–706. doi: 10.1111/j.1600-6143.2007.02120.x. [DOI] [PubMed] [Google Scholar]
- 12.Cuenod CA, Fournier L, Balvay D, Guinebretiere JM. Tumor angiogenesis: Pathophysiology and implications for contrast-enhanced MRI and CT assessment. Abdom Imaging. 2006;31:188–193. doi: 10.1007/s00261-005-0386-5. [DOI] [PubMed] [Google Scholar]
- 13.Cartwright L, Farhat WA, Sherman C, et al. Dynamic contrast-enhanced MRI to quantify VEGF-enhanced tissue-engineered bladder graft neovascularization: Pilot study. J Biomed Mater Res A. 2006;77:390–395. doi: 10.1002/jbm.a.30648. [DOI] [PubMed] [Google Scholar]
- 14.Medved M, Karczmar G, Yang C, et al. Semiquantitative analysis of dynamic contrast enhanced MRI in cancer patients: Variability and changes in tumor tissue over time. J Magn Reson Imaging. 2004;20:122–128. doi: 10.1002/jmri.20061. [DOI] [PubMed] [Google Scholar]
- 15.Rehman S, Jayson GC. Molecular imaging of antiangiogenic agents. Oncologist. 2005;10:92–103. doi: 10.1634/theoncologist.10-2-92. [DOI] [PubMed] [Google Scholar]
- 16.Brekke C, Lundervold A, Enger PO, et al. NG2 expression regulates vascular morphology and function in human brain tumours. Neuroimage. 2006;29:965–976. doi: 10.1016/j.neuroimage.2005.08.026. [DOI] [PubMed] [Google Scholar]
- 17.Tofts PS. Modeling tracer kinetics in dynamic Gd-DTPA MR imaging. J Magn Reson Imaging. 1997;7:91–101. doi: 10.1002/jmri.1880070113. [DOI] [PubMed] [Google Scholar]
- 18.Menger MD, Jaeger S, Walter P, Feifel G, Hammersen F, Messmer K. Angiogenesis and hemodynamics of microvasculature of transplanted islets of Langerhans. Diabetes. 1989;38(Suppl 1):199–201. doi: 10.2337/diab.38.1.s199. [DOI] [PubMed] [Google Scholar]
- 19.Sandberg JO, Margulis B, Jansson L, Karlsten R, Korsgren O. Transplantation of fetal porcine pancreas to diabetic or normoglycemic nude mice. Evidence of a rapid engraftment process demonstrated by blood flow and heat shock protein 70 measurements. Transplantation. 1995;59:1665–1669. doi: 10.1097/00007890-199506270-00004. [DOI] [PubMed] [Google Scholar]
- 20.Morini S, Brown ML, Cicalese L, et al. Revascularization and remodelling of pancreatic islets grafted under the kidney capsule. J Anat. 2007;210:565–577. doi: 10.1111/j.1469-7580.2007.00717.x. [DOI] [PMC free article] [PubMed] [Google Scholar]
- 21.Mattsson G, Carlsson PO, Olausson K, Jansson L. Histological markers for endothelial cells in endogenous and transplanted rodent pancreatic islets. Pancreatology. 2002;2:155–162. doi: 10.1159/000055906. [DOI] [PubMed] [Google Scholar]
- 22.McDonald DM, Choyke PL. Imaging of angiogenesis: From microscope to clinic. Nat Med. 2003;9:713–725. doi: 10.1038/nm0603-713. [DOI] [PubMed] [Google Scholar]