

Abstract
Introduction
The hypoxia marker IAZGP, 1-(6-deoxy-6-iodo-β-D-galactopyranosyl)-2-nitroimidazole, has been labeled with 123I/124I/125I/131I via iodine–radioiodine exchange, which gives the radiotracer in a specific activity of 10–90 MBq/μmol. We synthesized the same radiotracer possessing several hundred to thousand times higher specific activity (high-SA IAZGP) via nucleophilic substitution and compared its biological behavior with that of conventionally produced IAZGP (low-SA IAZGP) to determine if specific activity is a factor influencing cell uptake kinetics, biodistribution and intratumor microregional localization of the radiotracer.
Methods
High-SA [131I]IAZGP was prepared by substitution of the tosyl functionality with [131I]iodide. In vitro uptake of high- and low-SA [131I]IAZGP by HCT8 and HT29 cells was assessed in normoxic and hypoxic conditions. Biodistribution and intratumor localization of high- and low-SA [131I]IAZGP were determined by injection into HT29 tumor-bearing mice.
Results
The nucleophilic substitution reaction proceeded efficiently in acetonitrile at 150°C, giving the final product in an average yield of 42% and an average specific activity of 30 GBq/μmol. In vitro, high-SA [131I]IAZGP was incorporated into the tumor cells with similar kinetics and oxygen dependence to low-SA [131I]IAZGP. In HT29 tumor-bearing mice, biodistributions of high- and low-SA [131I]IAZGP were equivalent. Ex vivo autoradiography revealed heterogeneous intratumor localization of high-SA [131I]IAZGP corresponding closely to distributions of other exogenous and endogenous hypoxia markers. Comparable microregional distribution patterns were observed with low-SA [131I]IAZGP.
Conclusions
Radiolabeled IAZGP produced via nucleophilic substitution is validated as an exogenous hypoxia marker. Specific activity does not appear to influence the in vivo hypoxia-mapping ability of the radiotracer.
Keywords: Specific activity, IAZGP, Hypoxia, Nucleophilic substitution
1. Introduction
Molecular imaging of tumor hypoxia by positron emission tomography (PET) or single-photon emission computed tomography (SPECT) using hypoxia targeting tracers may provide information which assists in predicting the prognosis to cancer therapies. It has also been suggested as a way to identify radioresistant hypoxic subvolumes within the tumor suitable for biologically-based intensity modulated radiotherapy (IMRT). Several authors have described the potential of dose painting tumor hypoxia [1–6]. Among hypoxia-selective PET/SPECT radiotracers, the most frequently employed are 2-nitro-imidazole (azomycin) analogs including 18F-labeled FMISO, 1-(2-nitro-imidazolyl)-3-[18F] fluoro-2-propanol, which is currently most widely utilized for the purpose. [18F]FMISO exhibits higher accumulation into hypoxic regions of a tumor in a shorter period of time than other hypoxia markers, giving a tumor-to-blood ratio of 3–7 at 3 h postinjection in small animal tumor models [7–10]. However, its slow clearance from nontarget tissues prompted the development of a new class of 2-nitro-imidazole-monosaccharide tracers such as [18F]FAZA, 1-(5-[18F] fluoro-5-deoxy-β-D-arabinofuranosyl)-2-nitroimidazole [7,9]. Some hypoxia markers of this class were also labeled with longer-lived radionuclides than 18F such as 123I or 124I [11–14]. Schneider et al. [15] reported that among the iodinated 2-nitroimidazole-monosaccharides they synthesized and tested, IAZGP, 1-(6-deoxy-6-iodo-β-D-galacto-pyranosyl)-2-nitroimidazole, was identified as one of the most suitable radiotracers for imaging hypoxia. The tracer showed rapid clearance from plasma and other nontarget tissues, giving a tumor-to-nontumor ratio of 10 at 24 h after injection into EMT-6 tumor-bearing mice. They labeled IAZGP with 123I and 125I by the iodine–radio-iodine exchange reaction, which gave the desired product in a labeling efficiency of approximately 60% in 6 h and a specific activity of 10–90 MBq (0.3–2 mCi)/μmol when 1 mg of cold IAZGP was used as the starting material. IAZGP was also labeled with 124I, a positron emitter, in a similar fashion and tested in vivo in a small animal model [8].
Radiosynthesis of 123I/124I/125I/131I-labeled IAZGP can also be achieved by nucleophilic substitution of a leaving group such as the tosyl functionality with radioiodide, which gives radioiodinated IAZGP in significantly higher specific activity than the same radiotracer produced via the iodine–radioiodine exchange procedure. The difference in specific activity may result in differences in biological behavior of the hypoxia marker, which may be reflected on quality of PET/SPECT images.
The mechanism by which a 2-nitroimidazole-based radiotracer labels hypoxia is not well understood. However, enzymatic reduction of the oxygen-rich nitro group appears to be the main event from which bioactivities of a 2-nitroimidazole-based compound as a radiosensitizer, a hypoxia marker and an anticancer agent are derived. Under anaerobic conditions, the reduction occurs irreversibly resulting in adduct formation between the metabolites and macromolecules [16–18]. The number of adducts increases linearly with time for at least 4–6 h. During this period of time, the rate of adduct formation was reported by Chapman et al. to be dependent on the initial concentration of the hypoxia marker as follows:
| (1) |
where [HM]b is the amount of the hypoxia marker bound to macromolecules in a certain number of cells, such as 106 cells, in a unit time such as 1 hour, k a constant and [HM]0 the initial concentration of the hypoxia marker. The quantity r is the order of dependence on the initial concentration, which was empirically determined by the researchers to be 1/2 or 1 [18,19]. Their finding is interesting because it implies that when the adduct formation occurs with first-order kinetics, that is, r=1, the proportion of the hypoxia marker bound to macromolecules to that of its initial amount becomes independent of the initial concentration of the hypoxia marker:
| (1′) |
In other words, in this case, the radioactivity of a radio-labeled hypoxia marker associated with hypoxic cells at a unit time is proportional to the radioactivity added to initiate the cell uptake regardless of the number of molecules, radiolabeled or nonradiolabeled, of the marker present at the time 0. On the other hand, if the rate of the adduct formation is governed by 1/2 order kinetics, that is, r=1/2, Eq. (1) becomes as follows
| (1″) |
and the proportion of the hypoxia marker bound to macromolecules becomes dependent on the initial hypoxia marker concentration. And, in this case, the fraction of the radioactivity incorporated into hypoxic cells at a unit time decreases with the number of molecules, or the total mass, of the hypoxia marker added to initiate the uptake [Eq. (1″)]. Thus, in this case, hypoxia-labeling efficiency of a radiolabeled hypoxia marker, defined as the [HM]b/[HM]0 ratio, depends on its specific activity. Koch et al.[20] also pointed out that in some cell lines, the adduct formation occurs in a 1/2 order under extremely hypoxic conditions but the kinetics changes to a first order under milder conditions and hypothesized that because of this difference in kinetics, a high specific activity hypoxia marker is required to visualize and differentiate extremely hypoxic tissues and relatively well-oxygenated tissues with high contrasts. Thus, specific activity of a hypoxia marker may matter when performing in vivo imaging of hypoxia.
The specific activity of 123I/124I/125I/131I-labeled IAZGP produced via nucleophilic substitution normally exceeds 18 GBq/μmol (500 mCi/μmol), which is several hundred to several thousand times higher than the specific activity of radioiodinated IAZGP produced by the conventional exchange method. In order to address the issue as to whether specific activity of a PET/SPECT hypoxia marker is a factor that influences its cell uptake kinetics, intratumor hypoxia mapping capability and in vivo biodistribution, we undertook comparison studies between high and low specific activity (SA) [131I]IAZGP produced via the two different methods using small animal tumor models and tumor cell lines. We report our findings in this article.
2. Materials and methods
Sodium [131I]iodide was purchased from PerkinElmer Life and Analytical Sciences (MA, USA) as a 0.1N NaOH solution in a concentration of 11–63 GBq/ml (0.3–1.7 Ci/ml) with specific activity of 500–600 GBq/mg (14–17Ci/mg) as of manufacturer’s calibration dates. At the time of use, its concentration ranged from 11 to 37 GBq (0.3–1.0 Ci)/ml and specific activity from 11 to 44 GBq (300–1200 mCi)/μmol.
2.1. Chemistry
Unlabeled IAZGP was synthesized according to the literature procedure [15] and fully characterized at the Organic Synthesis Core Facility of MSKCC. The tosylate precursor (B, Fig. 1) was also synthesized at the same facility according to Kumar et al [21] starting with 1-(β-D-galactopyranosyl)-2-nitroimidazole (A, Fig. 1). Briefly, to a solution of A in anhydrous pyridine cooled at −10°C, 4-tosyl chloride in the same solvent was added dropwise. After stirring for 4 h at −10°C, the reaction mixture was quenched with water and the solvent removed. The desired product was isolated using a silica gel column eluted with methanol and dichloromethane.
Fig. 1.

Synthesis of [131I]IAZGP via nucleophilic substitution.
2.2. Radiochemistry
[131I]IAZGP was synthesized by nucleophilic substitution of the tosyl group at the 6-position with [131I]iodide (Fig. 1). The substitution reaction was studied under various conditions in different solvents and temperatures. Progress of the reaction was examined by analytical HPLC using a reversed-phase C18 column (NovaPak, 4.6×150 mm, Waters) and a mobile phase of acetonitrile/water (10:90) at a flow rate of 2 ml/min. Under these conditions, IAZGP was eluted at a retention time of 7.5 (±0.2) min. The HPLC output was monitored using a Diode Array Detector (Shimazdu SPD-M10AVP) and a radiation detector (Bioscan Flow-Count).
To a 1 ml reaction V-vial (Pierce), 1–10 μL of the Na131I/NaOH solution was added. After addition of 50–100 μL of anhydrous ethanol, the solvents were evaporated at 30–40°C under a stream of N2. This step was repeated three to five times until the dry residue was obtained. The tosylate precursor dissolved in 40 μL of acetonitrile in a concentration of 1.5–4 mg/ml was added to the vial, which was heated at a temperature ranging from 100°C to 155°C. The reactions in DMF and 2-pentanone were also studied in similar fashions. The effect of the basicity stemming from NaOH contained in the commercially-supplied Na131I, which becomes a critical factor when 123I- or 124I-labeled IAZGP is prepared for a clinical study, was examined as well by adding 50–100 μL of 0.1N NaOH to the reaction medium.
Purification of [131I]IAZGP was performed by semi-prep HPLC using a semipreparative C18 column (NovaPak, 7.8×300 mm, Waters) and a mobile phase of acetonitrile/water (25:75) at a flow rate of 6 ml/min. The radioactive peak eluting at the retention time corresponding to that of authentic IAZGP was collected, diluted with 50 ml of water and passed through a tC18 SepPak (Waters), which was washed with 10 ml water. The final product [131I]IAZGP was eluted with 1.0 ml of ethanol, diluted with saline and formulated for injection. The specific activity of [131I] IAZGP produced via the nucleophilic substitution reaction (high-SA IAZGP) depended on the specific activity of the starting material Na131I.
[131I]IAZGP was also prepared by the conventional iodine–radioiodine exchange method as described by Schneider et al. [15], starting with 1 mg of nonradioactive IAZGP dissolved in 20 μl of DMF. The specific activity of [131I]IAZGP prepared by this method (low-SA IAZGP) was 20–30 MBq/μmol (0.4–0.8 mCi/μmol).
The specific activities of the [131I]IAZGP batches used in the in vitro cell uptake, ex vivo autoradiography and biodistribution studies described below were 23 GBq (630 mCi)/μmol for high-SA IAZGP and 28 MBq (0.77 mCi)/μmol for low-SA IAZGP.
2.3. In vitro uptake of IAZGP as a function of oxygen concentration
The in vitro uptake of IAZGP was assessed as previously described [22]. Briefly, 2×10⁵ HCT8 or HT29 cells were seeded as monolayers in glass culture vessels [Leighton-type culture tubes (Bellco Glass, Vineland, NJ)] ~16 h before experiments. For uptake studies, cells were incubated in 0.5 ml HEPES-buffered DMEM/F12 medium (without sodium bicarbonate, supplemented with 10% FBS and Pen/Strep; pH 7.4) containing high- or low-SA [131I] IAZGP (approximately 37 KBq/ml). For induction of hypoxia, the tubes were sealed with an open-top screw cap and a butyl rubber septum stopper through which 19-gauge stainless-steel needles were inserted for equilibration with either humidified certified N2 (O2 <10 ppm) or a certified mixture of O2 and N2 (TechAir, White Plains, NY). The tubes were flushed with the gasses at a flow rate of 1 L/min for 5–7 min under continuous shaking to stimulate gas exchange with the medium. After the equilibration period, the needles were removed and the tubes placed in a 37°C incubator under continuous gentle shaking to prevent the formation of an oxygen gradient in the medium. The cells were incubated in the presence of the hypoxia marker for different amounts of time.
After incubation, duplicate tubes were removed, the cells rinsed (3×) with ice-cold phosphate-buffered saline (PBS) and lysed with 1 ml of 0.3N NaOH/1% SDS. The lysate was transferred into a 5-mL tube, neutralized with 3N HCl and the radioactivity in the lysate determined using a gamma counter (CompuGamma CS, Pharmacia LKB Nuclear, Gaithersburg, MD).
The amount of protein in the lysate was determined using the bicinchoninic acid protein assay kit (Pierce, Rockford IL), and the uptake of the radiolabeled marker expressed as fractional uptake per milligram of protein or as fractional uptake/106 cells.
From these data, the rate of uptake during the 0.5- to 3-h incubation interval was calculated (% uptake/mg protein per minute), normalized to the rate under anoxic conditions and plotted as a function of oxygen concentration to generate K curves. The oxygen dependence of uptake was calculated as described by Engelhardt et al. [23].
2.4. Tumor xenograft studies
Animal studies were performed in conformity with all applicable policies, procedures and regulatory requirements of the Institutional Animal Care and Use Committee and Research Animal Resource Center of MSKCC, the National Institutes of Health (NIH) Guide for the Care and Use of Laboratory Animals and the Public Health Service Policy on Humane Care and Use of Laboratory Animals.
NIH nude mice were inoculated in the right hind limb with 5×10⁶ HT29 cells. Tumors were allowed to develop for approximately 3–4 weeks until they had reached approximately 1000 mm3 in size.
2.5. Mapping of intratumor distribution of high- and low-SA [131I]IAZGP by ex vivo autoradiography
Animals bearing HT29 tumors were coadministered pimonidazole hydrochloride (60 mg/kg) along with either low- or high-SA [131I]IAZGP (approximately 80 μCi) by intravenous injection 3 and 24 h prior to sacrifice. Five minutes prior to sacrifice, animals were administered 1 mg of Hoechst 33342 (10 mg/ml in sterile saline) by intravenous injection.
Following sacrifice, tumors were excised, snap-frozen in isopentane/dry ice, embedded in cutting medium (OCT 4583, Sakura Finetek) and sets of 10-μm-thick contiguous frozen sections obtained using a cryostat microtome (Microm International) as previously described [24].
To determine radiolabeled tracer distribution, one section from each set was immediately placed onto an imaging phosphor plate for digital autoradiography (DAR). After 24 h, latent images were read out at 50-μm resolution using a FujiFilm Bas-1800 II phosphor plate reader.
Distribution of IAZGP was then compared to fluorescent imaging of vascular perfusion (Hoechst) and immunohistochemical staining of the endogenous tumor hypoxia marker carbonic anhydrase 9 (CA9) and the exogenous hypoxia tracer pimonidazole.
2.6. Immunofluorescence staining
Following exposure for DAR, sections were fixed in 4% paraformaldehyde solution for 10 min at room temperature then blocked in Superblock-PBS (Pierce, USA) for 1 h. CA9 was detected using cG250 antibody (kindly gifted by Dr Gerd Ritter, LICR, New York) at 25 μg/ml in Superblock, followed by incubation with a goat antihuman IgG conjugated to Alexa-568 (Invitrogen, USA). Pimonidazole was subsequently detected by incubation with mouse anti-pimonidazole antibody conjugated to FITC (Chemicon, Temecula, CA), diluted 1:10 in Superblock. Stained sections were imaged using Olympus BX40 fluorescence microscope (Olympus America, Melville, NY) equipped with a motorized stage (Prior Scientific Instruments, Cambridge, UK) and appropriate filters. Sections were also stained with hematoxylin and eosin to image tumor tissue, stroma and necrosis.
2.7. Biodistribution in mice
Four HT-29 tumor-bearing mice were grouped for each time point, and 10–15 μCi of high- or low-SA [131I]IAZGP was administered via tail vein injection. At 3 and 24 h postinjection, the animals were sacrificed and their blood, brain, lung, heart, liver, kidney, stomach, intestine, muscle and tumor were removed and weighed. The radioactivity in the tissues was determined using a gamma counter (Wizard 3 1480, PerkinElmer, MA). Statistical evaluation of the data was performed using unpaired Student’s t tests (SigmaPlot).
3. Results
3.1. Radiosynthesis
The nucleophilic substitution reaction with [131I]iodide (Fig. 1) proceeded efficiently in acetonitrile at 150°C, and, in 15 min, 70–80% (average 79.6±5.6%, n=6) of 131I was incorporated into IAZGP molecules when the molecular ratio of the tosylate precursor to NaOH was greater than approximately 0.5. The rate of reaction depended on reaction temperature. At 100°C, only 10% of the radioactivity was associated with IAZGP at 15 min, while the rest was eluted in void volume suggesting that 90% of [131I]iodide remained unreacted. The nucleophilic substitution reaction in DMF did not produce [131I]IAZGP in a high efficiency after 15 min of heating at 150–155°C. The labeling efficiency in DMF was 5–13%, and 75–90% of the radioactivity was eluted at a retention time of approximately 2 min while unreacted [131I] iodide appeared at 0.9 min. In 2-pentanone, the labeling efficiency was approximately 40%. However, it was noted that a large radioactive peak appeared when eluted with a mobile phase of higher acetonitrile composition, suggesting that 131I− was oxidized and converted into a more lipophilic species, presumably 131I2, before the substitution reaction was complete.
The labeling efficiency in acetonitrile was a function of the molar ratio between the tosylate precursor and NaOH present in the reaction medium (Fig. 2). This result suggests that the presence of the base interferes with the nucleophilic substitution reaction with [131I]iodide. Fig. 2 indicates that while a labeling efficiency greater than 80% can be achieved when the precursor-to-NaOH ratio is high enough, the presence of the base in more than 10-fold excess, that is, precursor/NaOH ≤0.1, reduces the yield of [131I]IAZGP to a point close to zero. In those cases, no tosylate precursor remained at the end of the 15-min reaction, suggesting that the precursor had been consumed by a side reaction before the substitution reaction was complete.
Fig. 2.

Effect of the molar ratio of precursor to NaOH on labeling efficiency of [131I]IAZGP via nucleophilic substitution. [Precursor]0 and [NaOH]0 represent the initial concentration of the precursor and that of NaOH, respectively.
[131I]IAZGP produced in acetonitrile was isolated by semi-preparative HPLC without co-eluting any radioactive or nonradioactive by-products. The yield of the final product after formulation was approximately 42% (42±9%, n=7). The specific activity of [131I]IAZGP prepared as above ranged from 19 to 44 GBq/μmol (0.5–12 Ci/μmol) (average, 29.5±10.0GBq/μmol or 797±271 mCi/μmol, n=6). Overall synthesis time including HPLC purification and formulation was approximately 90 min.
3.2. Oxygen dependence of in vitro [131I]IAZGP uptake
In both HT29 and HCT cell lines, approximately 0.8% of [131I]IAZGP added to the medium was taken up by 106 cells at 30 min regardless of oxygen levels the cells were exposed to (Fig. 3). After 3 h incubation, the tracer was incorporated into the cells depending on the oxygen level, from approximately 1% of [131I]IAZGP per 106 cells in air (21% oxygen) to 4–6%/106 cells in 0–0.02% oxygen (Fig. 3). No significant differences were observed in the oxygen-dependent uptake between high- and low-SA [131I] IAZGP (Fig. 3) in either of the cell lines used. After 3 h incubation, the ratios of IAZGP incorporated into HT29 cells under extremely hypoxic conditions (0–0.02% oxygen) to that under aerobic conditions were 4.8 for high-SA IAZGP and 5.1 for low-SA IAZGP with no statistically significant difference between them. Similar ratios, 4.3 and 3.9 for high-and low-SA IAZGP, respectively, were observed with HCT8 cells. Fig. 4 shows K curves for high- and low-SA IAZGP for HT29 and HCT8 cells. In HT29 cells (Fig. 4A), the half-maximum rate of uptake was at 0.14% (±0.05%)% O2 for high-SA IAZGP and at 0.235 (±0.27%) O2 for low-SA IAZGP. In HCT8 cells (Fig. 4B), the half-maximum rate of uptake was at 0.30% (±0.07%) O2 for high-SA IAZGP and at 0.30% (±0.12%) O2 for low-SA IAZGP.
Fig. 3.

In vitro [131I]IAZGP uptake by HT29 cells under normoxic and hypoxic conditions. HSA represents high-SA [131I]IAZGP, and LSA, low-SA [131I]IAZGP.
Fig. 4.

K curves for high- and low-SA IAZGP for HT29 and HCT8 cells.
3.3. Ex vivo autoradiographic evaluation
A close correspondence was observed between CA9 expression, pimonidazole distribution and distribution of high-SA [131I]IAZGP (image in red, green and black and white, respectively, in Fig. 5). We also observed low uptake in tumor regions with strong staining for the vascular perfusion marker Hoechst 33342 (image in blue in Fig. 5), indicating that binding of high-SA [131I]IAZGP in well-oxygenated tumor regions is reduced compared to hypoxic tumor regions. In mice sacrificed 24 h after injection, the heterogenous locoregional distribution of high-SA [131] IAZGP in the tumor was notably clear with high contrasts between hypoxic and nonhypoxic regions, whereas at 3 h postinjection, although the hypoxic regions were obvious, the contrasts were significantly lower probably due to incomplete clearance of unbound [131]IAZGP from the tumor. The average ratio in radioactivity density between the hottest spots in the tumors, which presumably represent severe hypoxia, to the relatively well-perfused and oxygenated regions was 9.0±0.8 (n=8) at 24 h, whereas the corresponding ratio at 3 h was 2.8±0.2 (n=6). There were no observable differences in the locoregional distribution between low- and high-SA IAZGP relative to either of the other hypoxia markers, pimonidazole and CA9, or to regions with strong Hoechst 33342 staining. Furthermore, similar hypoxia-to-nonhypoxia ratios were observed with low-SA [131I]IAZGP: the average ratios at 24 and 3 h were 8.5 and 2.8, respectively. The difference in hypoxia-to-nonhypoxia contrasts between the two time points, that is, 3 and 24 h, suggests that the clearance of [131I]IAZGP from nonhypoxic regions is relatively slow.
Fig. 5.
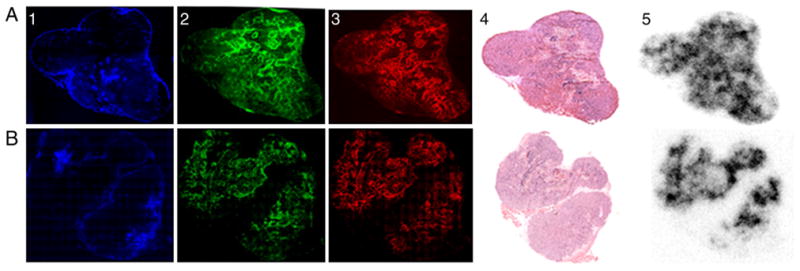
Digital autoradiographic assessment of IAZGP distribution. Comparison of the relative tumor distribution of high-SA [131I]IAZGP at 3 h (top row) and 24 h (bottom row) postinjection. Panels A and B indicate IAZGP distribution assessed by DAR. Panels A1–3 and B1–3 show the distribution of the vascular perfusion marker Hoechst 33342 (blue), CA9 (red) and pimonidazole (green), respectively. Panels A4 and B4 are H and E sections. All images in each row are obtained from the same frozen tumor section. Bar=2 mm.
3.4. Biodistribution of high- and low-SA [131I]IAZGP
At 3 h postinjection, the highest level of high-SA [131I] IAZGP was observed in the stomach at 0.32±0.9% dose/g tissue (n=4), followed by the tumor (0.29±0.06% dose/g tissue), intestine (0.27±0.07% dose/g tissue), kidney (0.23±0.05% dose/g tissue), and liver (0.16±0.03% dose/g tissue) (Fig. 6A, gray bars). The tumor-to-tissue ratio was the highest for the brain at 24±4, followed by the muscle, 5.0±1.3, blood, 4.9±1.1, lung, 3.9±0.6 and heart, 3.4±0.2. Low-SA [131I]IAZGP exhibited a similar distribution pattern (Fig. 6A, dotted bars) with a correlation coefficient between high- and low-SA IAZGP of 0.96 and no statistical difference (P>.05) for each organ. At 24 h, most of the radioactivity of high-SA IAZGP had washed out of the organs with the exception of the stomach and the tumor (Fig. 6B, gray bars), where 0.22±0.10% and 0.09±0.01% of the injected dose per gram of tissue remained, respectively. The tumor-to-nontumor ratios were approximately 8 and 6 in the muscle and blood, respectively. As was observed at 3 h, low-SA [131I]IAZGP was distributed similarly to high-SA [131I]IAZGP (Fig. 6B, dotted bars) with a correlation coefficient of 0.99. There were no statistically significant differences in radioactivity concentration remaining in the tissues at 24 h between the 2 tracers (P>0.5). The radioactivity of low-SA [131I]IAZGP found in the tumor at 24 h was 0.08±0.01% dose/g tissue with the tumor-to-muscle and tumor-to-blood ratios being approximately 9 and 5, respectively. The uptake by the tumor did not appear to be related to the tumor size ranging from 10 to 230 mg.
Fig. 6.

Body distribution of high- and low-SA [131I]IAZGP at 3 h (Fig. 6A) and 24 h (Fig. 6B) postinjection into HT29 tumor-bearing mice.
4. Discussion
The use of a nucleophilic substitution reaction to radiolabel a hypoxia marker of the 2-nitroimidazole-monosaccharide class has been reported in the past. [18F] FAZA is now routinely produced by substitution of the tosyl group at the 5-position of the precursor with 18F. [131I] IAZA, the iodo analog of FAZA, has also been synthesized by the tosyl-131I substitution reaction [21]. Using a similar method (Fig. 1), we prepared [131I]IAZGP in 70–80% labeling efficiencies under optimal conditions. We found that the molar ratio between the precursor and the base NaOH was a critical factor determining the yield of the final product. [131I]IAZGP was produced in the highest efficiency when the precursor/NaOH ratio was greater than approximately 0.5. However, as the ratio approached 0.1, the labeling efficiency became close to zero (Fig. 2). From a practical point of view, this information is useful when IAZGP is labeled with 123I or 124I for a PET/SPECT study because commercially-available Na123I or Na124I is normally supplied as a NaOH solution. Fig. 2 suggests that if Na123I(124I) is in 0.1 ml of a 0.1N NaOH solution, an amount of the tosylate precursor higher than approximately 2 mg is required in order to maintain a labeling efficiency greater than 70–80%. The base interferes with the nucleophilic substitution reaction presumably by inducing an elimination reaction, in which the tosyl group is removed while a double bond is formed. The competition between nucleophilic substitution and base-induced elimination and its impact on [18F]FLT synthesis has been reported [25]. Another critical factor is the solvent in which the nucleophilic substitution reaction takes place. In acetonitrile, the tosyl substitution with [131I]iodide proceeds efficiently with almost no side reactions, whereas in DMF and 2-pentanone, side reactions which alter the chemical form of [131I]iodide and/or decompose the precursor seem to dominate.
The specific activity of radioiodinated IAZGP prepared by the conventional iodine–radioiodine exchange method, which has been utilized since Schneider et al. [15] developed it, is normally lower than 4 mCi/μmol, assuming that the highest practically achievable yield at EOS is 10 mCi of 123I/124I/125I/131I-IAZGP using 1 mg of cold IAZGP as the precursor. In the past, this method has resulted in various 123I/124I/125I/131I-labeled 2-nitro-imidazole-monosaccharide hypoxia markers such as IAZGP, IAZA and IAZP, the specific activity of which ranged from 0.03 to 3 mCi/μmol [11–15,26,27]. In contrast, the new method we report here (Fig. 1) is a no-carrier-added approach, and theoretically, specific activity as high as 16–200 Ci/μmol at EOB would be possible [28] depending on the specific activity of the radioiodide available for the synthesis, although, practically, it most likely falls into a range of 0.5–6 Ci/μmol at EOS.
The conventional heating method employed in this investigation to radiolabel IAZGP with 131I via nucleophilic substitution proved to be effective. The reaction time of 15 min is 24 times shorter than that required for the [131I] IAZGP preparation via the 131I–I exchange reaction [15]. Owing to this effectiveness, the use of the nucleophilic substitution method becomes advantageous when IAZGP is labeled with a relatively short-lived nuclide such as 123I, the half-life of which is 13 h. In the aforementioned [131I]IAZA synthesis, a microwave-assisted heating technique was applied [21]. The authors pointed out, however, that microwave heating was less effective for the 131I–I exchange reaction compared to the tosyl-131I substitution.
The difference in specific activity between high- and low-SA [131I]IAZGP tracers used in the cell uptake and animal experiments in this investigation was approximately 800-fold. In vitro, this difference translated to an 800-fold difference in initial concentration of IAZGP with which the cell uptake was started, that is, 1.3 μM of low-SA IAZGP vs. 1.6 nM of high-SA IAZGP. In spite of the large difference in the number of IAZGP molecules participating in the process, both tracers were taken up into the cells in similar proportions under both normoxic and hypoxic conditions. The in vitro incorporation of IAZGP into HT29 cells at 30 min and 3 h summarized in Fig. 3 indicates that (i) under aerobic conditions, high- and low-SA IAZGP tracers enter the cells with similar kinetics, and both tracers are distributed between extracellular and intracellular compartments with similar ratios; and (ii) the rate of IAZGP incorporation into hypoxic cells depends on oxygen levels the cells are exposed to but not on the initial IAZGP concentration. Thus, specific activity of radiolabeled IAZGP does not appear to influence its labeling efficiency of hypoxic cells in vitro. This finding also suggests that IAZGP binding sites in hypoxic cells are unsaturable. Chapman et al. [17,18] have estimated that more than 109 binding sites are available per cell to misonidazole (MISO) in extreme hypoxia, which correspond to 1.5 nmol (or 1015) of MISO molecules binding to 106 cells. In this investigation, the in vitro uptake of IAZGP into HCT-8 or HT29 cells was initiated with approximately 0.8 pmol and 0.65 nmol of high- and low-SA IAZGP, respectively. Assuming that 6% of the initial amount of IAZGP binds to 106 extremely hypoxic cells (Fig. 3) and that the number of binding sites for IAZGP is similar to that for MISO, that is, 1015/106 cells, it is estimated that the binding sites occupied by the high- and low-SA IAZGP molecules were less than 0.003% and 3%, respectively, of the total available binding sites. The actual numbers are lower if only 20% of the intracellular tracer is bound to the macromolecules as previously suggested [16]. This may explain our finding that there are no significant differences in in vitro cell incorporation into hypoxic cells between high- and low-SA IAZGP. Similar observation of a seemingly unlimited number of binding sites for fluoromisonidazole (FMISO) has been suggested [29].
Koch et al. [20] showed that under extremely hypoxic conditions with a 0–0.02% oxygen level, the initial rate of MISO uptake by V-79 cells was proportional to the square root of the initial concentration of MISO [(r=1/2 in Eq. (1)], whereas under moderately hypoxic conditions with 0.2–0.7% oxygen, the uptake occurred with first-order kinetics [r=1 in Eq. (1)]. Based on these observations, they suggested that as a result of the difference in kinetics, when hypoxia is visualized in vivo with a radiolabeled hypoxia marker, the lower the specific activity of the tracer is, the lower the contrast between severely and moderately hypoxic regions becomes. Our results shown in Fig. 3 indicate that that is not the case as far as IAZGP incorporation into HCT-8 and HT29 cells is concerned. For HT29 cells, the ratios of [131I]IAZGP incorporated under normoxic conditions with a 21% oxygen level to that under extremely hypoxic conditions with 0–0.02% oxygen at 3 h are approximately 5 for both high- and low-SA IAZGP (Fig. 3). In addition, the ratios between extremely and moderately hypoxic (0.25% oxygen) conditions are approximately 2 for both high-and low-SA IAZGP (Fig. 3). If Koch’s hypothesis were applicable to this case, we would have observed a 28-fold difference between high- and low-SA IAZGP in the rate of incorporation into extremely hypoxic cells and in the ratios between extremely and moderately hypoxic cells according to Eq. (1″).
Biodistributions of high- and low-SA [131I]IAZGP in HT29 tumor-bearing mice at 3 and 24 h postinjection (Fig. 6) indicate that the two tracers appear to be distributed in the body by similar mechanisms and with similar kinetics in vivo. Injection doses given to the mice were 9 ng per mouse and 7.5 μg per mouse for high- and low-SA IAZGP, respectively. In tumors, approximately 0.3% of the injected dose was found for both tracers at 3 h, which decreased to approximately 0.1% at 24 h. The tumor-to-blood and tumor-to-muscle ratios at 3 and 24 h, which are determined by two factors, that is, how rapidly IAZGP molecules are taken up by the tumor from the blood and how rapidly they are cleared from nontumor tissues, were also similar (Fig. 6). With both tracers, tumor-to-blood ratios reached approximately 6 at 24 h when unbound IAZGP was cleared from nonhypoxic tissues. The ratios observed in this investigation were similar to those reported by Zanzonico et al. [8] who studied the in vivo behavior of 124I-labeled IAZGP using mice bearing MCa and FSaII tumors, although they observed approximately 5 times higher uptake into the tumors. It is known that the tumor uptake of a hypoxia marker largely depends on tumor cell types used in animal models. Iyer et al. reported that EMT-6 tumors gave two to four times higher uptake of [131I]IAZGP than R3327-AT prostate carcinoma, where the uptake of the tracer was approximately 0.2–0.3% dose/g tissue at 3 h postinjection [19,26].
Rasey et al. [30] reported a dramatic 50% reduction of in vivo [3H]FMISO uptake into C3H tumors in mice after increasing the intraperitoneal injection dose from 3×5 to 3×50 μmol/kg. In contrast, using 18F-labeled FMISO and nanoPET, Wyss et al. [31] did not detect any difference in their hypoxia images in mouse tumors after intravenous injection of the radiotracer loaded with various amounts of cold FMISO ranging from 0.0008 to 3 mg, which corresponds to approximately 0.4 to 1580 μmol/kg assuming the mice weighed approximately 10 g. The reason of the discrepancy between these two reports is unclear. A triple intraperitoneal injection of 50 μmol/kg might not have the same effects of a single intravenous injection of 150 μmol/kg. In accordance with the aforementioned work by Rasey et al., Hirst et al. [32] observed a tumor-to-muscle ratio of 26:1 in mice implanted in the flanks with EMT-6 tumors 24 h after a triple intraperitoneal injection of 0.5 μmol/kg of [14C]MISO, whereas 100 μmol/kg of the same radiotracer gave a lower ratio of 11:1 in the same type of tumor at the same time point [33]. Contrary to these observations, however, Parliament et al. [34] report that ex vivo hypoxia images visualized with 1 μmol/kg of [3H]MISO were quantitatively equivalent to those with 50 μmol/kg of [14C] MISO. Furthermore, the same researchers found no mass-dependent effects on the in vivo tumor uptake of 125I-IAZA, an IAZGP analog, when various doses between 0.18 and 18 mg/kg, that is, 0.5–50 μmol/kg, were injected into EMT-6 or RIF-1 tumor-bearing mice [34]. The observations made by Wyss et al. and Parliament et al. and the results of this investigation dealing with cold IAZGP contained in a hot injection dose ranging from 0.002 to 2 μmol/kg, taken together, suggest that the biodistribution of a radiolabeled 2-nitro-imidazole-based hypoxia marker appears to be independent of cold mass contained in the tracer in a range of 0.002–1580 μmol/kg.
In PET or SPECT imaging of hypoxia, the amount of the unlabeled carrier in a radiolabeled hypoxia marker given to a patient normally does not exceed 10 mg, which corresponds to a dose of approximately 0.4 μmol/kg of IAZGP or IAZA and 0.8 μmol/kg of FMISO. Thus, clinically relevant doses for these purposes are most likely less than 1 μmol/kg, which is close to the highest dose we tested, that is, 2 μmol/kg, in this investigation. The use of a radiolabeled hypoxia marker at amounts higher than 25 μmol/kg is not practical. The dose higher than 100–200 μmol/kg becomes relevant when MRI imaging of hypoxia is performed using an NMR-sensitive imaging agent such as trifluoro-misonidazole (TF-MISO), which is normally administered at a dose higher than 100 μmol/kg to visualize the target regions. It is interesting to note that Procissi et al. [35] observed that the ratio in rate of in vitro uptake of TF-MISO into HCT8 cells between anoxic and normoxic conditions decreased as the concentration of TF-MISO increased from 50 to 200 μM. Hence, it may be important to study dose-dependent changes in biodistribution of an MRI imaging agent. However, it is out of the scope of this investigation.
The specific activity-independent biodistribution exhibited by a hypoxia marker such as IAZGP, IAZA or FMISO is in stark contrast to specific activity-dependent binding to saturable binding sites such as neurotransmitter receptors or transporters, where radiolabeled ligands compete with unlabeled ones for a limited number of binding sites. In those cases, a radiotracer with specific activity higher than 30 GBq/μmol (1 Ci/μmol) is normally required, and the binding sites for radiolabeled ligands are completely masked after a dose of unlabeled ligands as small as 0.01 mg/kg is administered (e.g., see Ref. [36]). According to the biodistribution data reported here, it is obvious that cold and hot IAZGP molecules do not compete for specific binding sites that are saturable, which is also obvious from the in vitro data (Figs. 3 and 4).
Ex vivo autoradiography revealed heterogeneous distribution of high-SA IAZGP in the tumor (Fig. 5). The distribution patterns agreed well with those of two other hypoxia markers, pimonidazole and CA9, suggesting that high-SA IAZGP is distributed according to oxygenation levels in the tumor. These regions where high-SA IAZGP accumulates are also the regions with poor vascular perfusions, devoid of Hoechst 33342 staining (Fig. 5), further validating high-SA IAZGP as a hypoxia marker. However, as found in the in vitro cell uptake and the mouse body distribution, there were no observable differences in the locoregional distribution of high- and low-SA IAZGP relative to that of either of the other hypoxia markers or to the regions of strong Hoechst 33342 staining. Both high- and low-SA IAZGP tracers visualized hypoxic regions with high contrasts of approximately 9 between hypoxic and normoxic tissues at 24 h after intravenous administration of the radiotracer. These findings confirm that specific activity of radiolabeled IAZGP does not influence the ability of the tracer to identify and map hypoxia in the tumor. Similar specific activity-independent microregional distribution patterns of [3H] MISO have been reported [34]. Thus, images visualized with high- and low-SA IAZGP can be interpreted as images translated from the same events occurring in the hypoxic tissues both macroscopically and microscopically.
Although high- and low-SA IAZGP radiotracers appear to behave similarly in a living body and accumulate into hypoxic regions localized in a tumor in similar fashions, one potential problem with low-SA IAZGP is toxicity. Studies to establish the toxicity of IAZGP in mice, performed by Celsis Laboratories (St. Louis, MO), showed no consequential ill effects of the drug at the 2.5 mg/g body weight. All 28 mice administered these doses were alive at the 14-day observation period, with only one mouse from the 2.5 mg/g dose level that had a fluid-filled cyst on its stomach and one mouse that lost weight (1 g) over the observation period. Major organ histology performed at the highest dose level of 25 mg/g showed no histological differences with the control group. Low-SA IAZGP is synthesized with 1–2 mg of cold IAZGP, which serves as the starting material. The same amount of cold IAZGP still remains in the injection dose together with hot IAZGP. This amount of IAZGP, if injected into a 70-kg patient, corresponds to a dose of 15–30 μg/kg, which is more than 1000 times lower than any dose expected to result in tissue toxicity. Thus, 1–2 mg of IAZGP contained in an injection dose of low-SA IAZGP is unlikely to result in any adverse effects.
Heterogeneous intratumor localization of [131I]IAZGP visualized by ex vivo autoradiography (Fig. 5) suggests that using the same hypoxia marker labeled with a positron emitter such as 124I and the PET technique, hypoxic regions in the tumor can be pinpointed if the spatial resolution of a PET camera is sufficiently high, which is important for image-guided radiotherapy planning.
The ex vivo autoradiograms taken at 24 h showed significantly higher hypoxia-to-nonhypoxia contrasts (Fig. 5) compared to those taken at 3 h, indicating that later time point imaging with PET would expectedly result in a more hypoxia-specific image than imaging early (3 h) postinjection. This suggests that a hypoxia marker labeled with a relatively long-lived positron/single photon emitter such as 124I may be more useful for distinguishing hypoxic regions of various oxygenation status with greater accuracy. Using microPET and a mice tumor model, Zanzonico et al. [8] successfully visualized a MCa tumor of 0.7 g up to 48 h after injection of 0.45 mCi of [124I]IAZGP.
We currently have an ongoing clinical trial under an approved IRB and investigational new drug application (IND 72,013) to evaluate the dosimetry and safety of 124I-IAZGP in patients. Ten patients have been administered approximately 1 mg of IAZGP labeled with 148 MBq (3–4 mCi) of 124I. A significant factor affecting the radiation dosimetry of 124I-IAZGP is the rapid effective clearance of 124I-IAZGP from the blood and the whole body. The blood clearance of 124I-IAZGP is best described by a biphasic clearance of 0.24 and 5.2 h. The clearance of 124I-IAZGP from the whole body was also rapid with, on average, two thirds of the activity clearing with an effective half-time of 0.93 h and the remaining one third with an effective half-time of 11 h. These rapid clearances do not impede the use of this new PET hypoxia tracer in man. The organ receiving the highest radiation dose is the urinary bladder wall with 2cGy/mCi administered, a consequence of the excretion rate through the urine.
In conclusion, this paper describes a radiosynthesis of [131I]IAZGP via nucleophilic substitution, which produces the radiotracer in specific activity several hundred to several thousand times higher (high-SA IAZGP) than that of conventionally produced [131I]IAZGP via iodine–radio-iodine exchange (low-SA IAZGP) and demonstrates that (a) high-SA IAZGP is incorporated into tumor cells with similar kinetics and oxygen dependence to low-SA IAZGP, (b) the biodistribution of high-SA IAZGP at 3 and 24 h postinjection is equivalent to that of low-SA IAZGP and (c) intratumor microregional localization of high- and low-SA IAZGP is comparable in accord with the oxygenation status of the tissues where the tracers accumulate. Taken together, the specific activity of IAZGP does not appear to be a factor influencing the hypoxia-mapping ability of this radiotracer. Thus, high- and low-SA IAZGP tracers are both equally validated as exogenous hypoxia markers for in vivo imaging of hypoxia by PET or SPECT. However, owing to the highly effective synthesis procedure, the use of the nucleophilic substitution method becomes advantageous when IAZGP is labeled with a relatively short-lived nuclide such as 123I.
Acknowledgments
We would like to thank Jazmin Schwartz for her skillful assistance in the [131I]IAZGP DAR image analysis. This research was supported by the National Cancer Institute Grant No. P01CA115675 (PI: C. Clifton Ling). This publication also acknowledges Grant No. NCI P30-CA 08748, which provides partial support for the Organic Synthesis Core and Research Animal Resource Center used in conducting this investigation.
References
- 1.Ling CC, Humm J, Larson S, Amols H, Fuks Z, Leibel S, Koutcher JA. Toward multidimensional radiotherapy (MD-CRT): biological imaging and biological conformity. Int J Radiat Oncol Biol Phys. 2000;47:551–60. doi: 10.1016/s0360-3016(00)00467-3. [DOI] [PubMed] [Google Scholar]
- 2.Schinagl DAX, Kaanders JHAM, Oyen WJG. From anatomical to biological target volumes: the role of PET in radiation treatment planning. Cancer Imaging. 2006;6:S107–16. doi: 10.1102/1470-7330.2006.9017. [DOI] [PMC free article] [PubMed] [Google Scholar]
- 3.Thorwarth D, Eschmann SM, Paulsen F, Alber M. A model of reoxygenation dynamics of head-and-neck tumors based on serial 18F-fluoromisonidazole positron emission tomography investigations. Int J Radiation Oncology Biol Phys. 2007;68:515–21. doi: 10.1016/j.ijrobp.2006.12.037. [DOI] [PubMed] [Google Scholar]
- 4.Rajendran JG, Hendrickson KRG, Spence AM, Krohn KA, Mankoff DA. Hypoxia imaging-directed radiation treatment planning. Eur J Nucl Med Mol Imaging. 2006;33:S44–S53. doi: 10.1007/s00259-006-0135-1. [DOI] [PubMed] [Google Scholar]
- 5.Lecchi M, Fossati P, Elisei F, Orecchia R, Lucignani G. Current concepts on imaging in radiotherapy. Eur J Nucl Med Mol Imaging. 2008;53:821–37. doi: 10.1007/s00259-007-0631-y. [DOI] [PubMed] [Google Scholar]
- 6.Lee NY, Mechalakos JG, Nehmeh S, Lin Z, Squire OD, Cai S, Chan K, Zanzonico PB, Greco C, Ling CC, Humm JL, Schoder H. Fluorine-18-labeled fluoromisonidazole positron emission and computed tomography-guided intensity-modulated radiotherapy for head and neck cancer: a feasible study. Int J Radiat Oncol Biol Phys. 2008;70:2–13. doi: 10.1016/j.ijrobp.2007.06.039. [DOI] [PMC free article] [PubMed] [Google Scholar]
- 7.Sorger D, Patt M, Kumar P, Wiebe LI, Barthel H, Seese A, Dannenberg C, Tannapfel A, Kluge P, Sabri O. [18F]fluoroazomycinarabinoside (18FAZA) and [18F]fluoromisonidazole (18FMISO): a comparative study of their selective uptake in hypoxia cells and PET imaging in experimental rat tumors. Nucl Med Biol. 2003;30:317–26. doi: 10.1016/s0969-8051(02)00442-0. [DOI] [PubMed] [Google Scholar]
- 8.Zanzonico P, O’Donoghue J, Chapman JD, Schneider R, Cai S, Larson S, Wen B, Chen Y, Finn D, Ruan S, Gerweck L, Humm J, Ling C. Iodine-124-labeled iodo-azomycin-galactoside imaging of tumor hypoxia in mice with serial microPET scanning. Eur J Nucl Med Mol Imaging. 2004;31:117–28. doi: 10.1007/s00259-003-1322-y. [DOI] [PubMed] [Google Scholar]
- 9.Piert M, Machulla HJ, Picchio M, Reischl G, Ziegler S, Kumar P, Wester HJ, Beck R, McEwan JB, Wieber LI, Schwaiger M. Hypoxia-specific tumor imaging with 18F-fluoroazomycin arabinoside. J Nucl Med. 2005;46:106–13. [PubMed] [Google Scholar]
- 10.Reischl G, Dorow DS, Cullinane C, Katsifis A, Roselt P, Binns D, Hicks RJ. Imaging of tumor hypoxia with [124I]IAZA in comparison with [18F]FMISO, [18F]FAZA-First small animal PET results. J Pharm Pharmaceut Sci. 2007;10:172–80. [PubMed] [Google Scholar]
- 11.Mannan RH, Somayaji VV, Lee J, Mercer JR, Chapman JD, Wieber LI. Radioiodinated 1-(5-iodo-5-deoxy-b-D-arabinofuranosyl)-2-nitroimi-dazole, iodoazomycin arabinoside: IAZA): a novel marker of tissue hypoxia. J Nucl Med. 1991;32:1764–70. [PubMed] [Google Scholar]
- 12.Mannan RH, Mercer JR, Wieber LI, Kumar P, Somayaji VV, Chapman JD. Radioiodinated azomycin pyranoside (IAZP): a new non-invasive marker for the assessment of tumor hypoxia. J Nucl Biol Med. 1992;36:60–7. [PubMed] [Google Scholar]
- 13.Parliament MB, Chapman JD, Urtasun RC, McEwan AJ, Goldberg L, Mercer JR, Mannan RH, Wieber LI. Non-invasive assessment of human tumour hypoxia with 123I-iodoazomycin arabinoside: preliminary report of a clinical study. Br J Cancer. 1992;65:90–5. doi: 10.1038/bjc.1992.17. [DOI] [PMC free article] [PubMed] [Google Scholar]
- 14.Urtasun RC, Parliament MB, McEwan AJ, Mercer JR, Mannan RH, Wieber LI, Morin C, Chapman JD. Measurement of hypoxia in human tumors by non-invasive SPECT imaging of iodoazomycin arabinoside. Br J Cancer. 1996;27:S209–12. [PMC free article] [PubMed] [Google Scholar]
- 15.Schneider RF, Engelhardt EL, Stobbe CC, Fenning MC, Chapman JD. The synthesis and radiolabeling of novel markers of tissue hypoxia of the iodinated azomycin nucleoside class. J Labelled Compd Radio-pharm. 1997;39:541–57. [Google Scholar]
- 16.Varghese AJ, Whitmore GF. Binding of cellular macromolecules as a possible mechanism for the cytotoxicity of misonidazole. Cancer Res. 1980;40:2165–9. [PubMed] [Google Scholar]
- 17.Miller GG, Ngan-Lee J, Chapman JD. Intracellular localization of radioactively labeled misonidazole in EMT-6 tumor cells in vitro. Int J Radiation Oncology Biol Phys. 1982;8:741–4. doi: 10.1016/0360-3016(82)90725-8. [DOI] [PubMed] [Google Scholar]
- 18.Chapman JD, Baer K, Lee J. Characteristics of the metabolism-induced binding of misonidazole to hypoxic mammalian cells. Cancer Res. 1983;43:1523–8. [PubMed] [Google Scholar]
- 19.Chapman JD, Coia LR, Stobbe CC, Engelhardt EL, Fenning MC, Schneider RF. Prediction of tumor hypoxia and radioresistance with nuclear medicine markers. Br J Cancer. 1996;74:S204–8. [PMC free article] [PubMed] [Google Scholar]
- 20.Koch CJ, Stobbe CC, Baer KA. Metabolism induced binding of 14C-misonidazole to hypoxic cells: kinetic dependence on oxygen concentration and misonidazole concentration. Int J Radiation Oncology Biol Phys. 1983;10:1327–31. doi: 10.1016/0360-3016(84)90342-0. [DOI] [PubMed] [Google Scholar]
- 21.Kumar P, Wiebe LI, Asikoglu M, Tandon M, McEwan AJB. Microwave-assisted (radio)halogenation of nitroimidazole-based hypoxia markers. Appl Radiat Isot. 2002;57:697–703. doi: 10.1016/s0969-8043(02)00185-9. [DOI] [PubMed] [Google Scholar]
- 22.Burgman P, O’Donoughue JA, Lews JS, Welch MJ, Humm JL, Ling CC. Cell line-dependent differences in uptake and retention of the hypoxia-selective nuclear imaging agent Cu-ATSM. Nucl Med Biol. 2005;32:623–30. doi: 10.1016/j.nucmedbio.2005.05.003. [DOI] [PubMed] [Google Scholar]
- 23.Engelhardt EL, Schneider RF, Seeholzer SH, Stobbe CC, Chapman JD. The synthesis and radiolabeling of cyclam and their preclinical evaluation as positive markers of tumor hypoxia. J Nucl Med. 2002;43:837–50. [PubMed] [Google Scholar]
- 24.Pugachev A, Ruan S, Carlin Slarson SM, Campa J, Ling CC, Humm JL. Dependence of FDG uptake on tumor microenvironment. Int J Radiat Oncol Biol Phys. 2005;62:545–53. doi: 10.1016/j.ijrobp.2005.02.009. [DOI] [PubMed] [Google Scholar]
- 25.Suehiro M, Vallabhajosula S, Goldsmith SJ, Ballon D. Investigation of the role of the base in the synthesis of [18F]FLT. Appl Radiat Isot. 2007;65:1350–7. doi: 10.1016/j.apradiso.2007.07.013. [DOI] [PubMed] [Google Scholar]
- 26.Iyer RV, Haynes PT, Schneider RF, Movsas B, Chapman JD. -D[βMarking hypoxia in rat prostate carcinomas with [125I]azomycin galactopyranoside and [99mTc]HL-91: correlation with microelectrode measurements. J Nucl Med. 2001;42:337–44. [PubMed] [Google Scholar]
- 27.Moore RB, Chapman JD, Mercer JR, Mannan RH, Wiebe LI, McEwan AJ, McPhee MS. Measurement of PDT-induced hypoxia in Dunning prostate tumors by iodine-123-iodoazomycin arabinoside. J Nucl Med. 1993;34:405–13. [PubMed] [Google Scholar]
- 28.Delacriox D, editor. Radiation protection dosimetry-radionuclide and radiation protection data handbook. Kent, England: Nuclear Technology Publishing; 1998. Nuclide safety data sheet. [Google Scholar]
- 29.Prekeges JL, Rasey JS, Grunbaum Z, Krohn KH. Reduction of fluoromisonidazole, a new imaging agent for hypoxia. Biochem Pharmacol. 1991;42:2387–95. doi: 10.1016/0006-2952(91)90245-z. [DOI] [PubMed] [Google Scholar]
- 30.Rasey JS, Grunbaum Z, Magee S, Nelson NJ, Olive PL, Durand RE, Krohn KA. Characterization of radiolabeled fluoromisonidazole as a probe for hypoxic cells. Radiat Res. 1987;111:292–304. [PubMed] [Google Scholar]
- 31.Wyss MT, Honer M, Schubiger PA, Ametamey SM. NanoPET imaging of [18F]fluoromisonidazole uptake in experimental mouse tumors. Eur J Nucl Med Mol Imaging. 2006;33:311–8. doi: 10.1007/s00259-005-1951-4. [DOI] [PubMed] [Google Scholar]
- 32.Hirst DG, Hazelhurst DG, Brown JM. Changes in misonidazole binding with hypoxic fraction in mouse tumors. Int J Radiat Oncol Biol Phys. 1985;11:1349–55. doi: 10.1016/0360-3016(85)90251-2. [DOI] [PubMed] [Google Scholar]
- 33.Garrecht BM, Chapman JD. The labeling of EMT-6 tumours in BALB/C mice with 14C-misonidazole. Br J Radiol. 1983;56:745–53. doi: 10.1259/0007-1285-56-670-745. [DOI] [PubMed] [Google Scholar]
- 34.Parliament MB, Wiebe LI, Franko AJ. Nitroimidazole adducts as markers for tissue hypoxia: mechanistic studies in aerobic normal tissues and tumour cells. Br J Cancer. 1992;66:1103–10. doi: 10.1038/bjc.1992.418. [DOI] [PMC free article] [PubMed] [Google Scholar]
- 35.Procissi D, Claus F, Burgman P, Koziorowski J, Chapman JD, Thakur SB, Matei C, Ling CC, Koutcher JA. In vivo 19F magnetic resonance spectroscopy and chemical shift if tri-fluoro-nitroimidaziole as a potential hypoxia reporter in solid tumors. Clin Cancer Res. 2007;13:3738–47. doi: 10.1158/1078-0432.CCR-06-1563. [DOI] [PubMed] [Google Scholar]
- 36.Suehiro M, Scheffel U, Dannals RF, Ricaurte GA, Ravert HT, Wagner HN., Jr A PET radiotracer for studying serotonin uptake sites; [11C] McN-5652-Z. J Nucl Med. 1993;34:120–7. [PubMed] [Google Scholar]