Abstract
Purpose: In cardiac PET and PET∕CT imaging, misaligned transmission and emission images are a common problem due to respiratory and cardiac motion. This misalignment leads to erroneous attenuation correction and can cause errors in perfusion mapping and quantification. This study develops and tests a method for automated alignment of attenuation and emission data.
Methods: The CT-based attenuation map is iteratively transformed until the attenuation corrected emission data minimize an objective function based on the Radon consistency conditions. The alignment process is derived from previous work by Welch et al. [“Attenuation correction in PET using consistency information,” IEEE Trans. Nucl. Sci. 45, 3134–3141 (1998)] for stand-alone PET imaging. The process was evaluated with the simulated data and measured patient data from multiple cardiac ammonia PET∕CT exams. The alignment procedure was applied to simulations of five different noise levels with three different initial attenuation maps. For the measured patient data, the alignment procedure was applied to eight attenuation-emission combinations with initially acceptable alignment and eight combinations with unacceptable alignment. The initially acceptable alignment studies were forced out of alignment a known amount and quantitatively evaluated for alignment and perfusion accuracy. The initially unacceptable studies were compared to the proposed aligned images in a blinded side-by-side review.
Results: The proposed automatic alignment procedure reduced errors in the simulated data and iteratively approaches global minimum solutions with the patient data. In simulations, the alignment procedure reduced the root mean square error to less than 5 mm and reduces the axial translation error to less than 1 mm. In patient studies, the procedure reduced the translation error by >50% and resolved perfusion artifacts after a known misalignment for the eight initially acceptable patient combinations. The side-by-side review of the proposed aligned attenuation-emission maps and initially misaligned attenuation-emission maps revealed that reviewers preferred the proposed aligned maps in all cases, except one inconclusive case.
Conclusions: The proposed alignment procedure offers an automatic method to reduce attenuation correction artifacts in cardiac PET∕CT and provides a viable supplement to subjective manual realignment tools.
Keywords: cardiac PET/CT, Radon consistency, attenuation correction, attenuation artifact
INTRODUCTION
The goal of this work is to improve the attenuation-emission alignment in cardiac PET∕CT imaging. Misaligned attenuation correction can result in artifacts and quantitative errors in cardiac PET images. Artifacts from misaligned attenuation-emission scans are common with conventional PET imaging in which attenuation maps are formed over multiple respirations with a transmission rod source (21% of conventional cardiac PET cases have artifacts from attenuation1). The potential for misalignment∕artifacts is further increased in dual modality PET∕CT systems since the CT scan provides the attenuation map. This CT scan is often performed as a rapid helical acquisition imaging a snapshot of the respiratory cycle, whereas the PET image is acquired over multiple respirations. Misalignment of these temporally different scans is common and often occurs in the diagnostic region of interest (along the anterior and lateral free walls of myocardium adjacent to the left lung), leading to moderate to severe perfusion artifacts in 40% of cardiac PET-helical CT acquisitions.2 These misalignment artifacts are well appreciated in cardiac PET∕CT3, 4 and have been shown to cause myocardial uptake errors of up to ±35% over conventional cardiac PET imaging in which attenuation maps are formed over multiple respirations with a transmission rod source.5
Several approaches have been proposed to minimize these artifacts. Groups have explored the option of performing the CT scan at an optimal time during respiration, such as at midexpiration, to minimize potential mismatches.5, 7 Our clinical experience has found that asking a patient to hold his or her breath at a certain point in the respiratory cycle causes highly variable results. Another approach is to acquire multiple helical CT scans for each PET acquisition with the expectation that at least one of the CT scans will be aligned with the PET data.8 A third solution is to form the attenuation map with a cine CT acquisition, which acquires multiple low-dose CT scans over a period of time at each slice in the patient. The average or intensity maximum of these cine images can be used to reduce the potential of artifact-forming mismatches.9, 10
If a mismatch is evident, some vendors offer realignment tools to fix major errors. These realignment tools provide a user interface to manually shift the attenuation map until the user perceives that the attenuation and emission images are aligned. These tools are nonoptimal for two key reasons. First, it is a subjective process to visually align three-dimensional volumes with different intensity values. Some efforts have attempted to perform image-based registration of the CT and PET image based on alignment metrics such as mutual information11 or based on dedicated segmentation and registration schemes.12 These image-based registration methods remove the subjectivity of user intervention. Both the manual and automatic image-based registration methods are nonoptimal because the attenuation image is aligned with the attenuation corrected emission image formed from potentially flawed attenuation correction. The flaws manifest themselves as artifactual boundary regions that are the primary regions of interest for determining alignment. Artifactual regions will confound manual and automatic methods. The main motivation for the effort in this paper is to improve upon the image-based realignment tools with an objective data-driven method, leading to reproducible attenuation correction alignment.
The quality assurance of the attenuation and emission alignment by a trained user is an important step in cardiac PET∕CT imaging. The proposed method could provide an initial improved alignment and more accurate attenuation corrected PET image for the user, who could then ensure acceptable alignment and make minor shift adjustments as necessary. In this “just-enough-information” (JEI) approach, a user interacts with the quality assurance of the alignment as little as possible while still ensuring clinically acceptable results. It has been shown that minimizing user input with JEI approaches reduces processing time and intra- and interoperator variability.13
In this work, we developed and tested a method for automated alignment of attenuation and emission data. The alignment process is driven by the Radon consistency conditions on the emission data and derives from previous work by Welch et al.14 For this process, the optimal rigid-body transformation of the attenuation image volume is found, which results in the most consistent attenuation corrected emission data and improved attenuation-emission alignment. In a follow-up to their original work, Bromiley et al.15 proposed the alignment approach for stand-alone PET systems with attenuation maps from a rotating rod source and presented results with simulation and phantom studies. Our current work extends their efforts by applying the approach to PET∕CT systems and demonstrating efficacy with patient cardiac exams. We test the process with the simulated data and measured patient data from ammonia cardiac PET∕CT exams.
ALIGNMENT METRIC
The attenuation image, formed from scaling the CT image volume to attenuation coefficients at PET energy,16 is aligned with the PET emission image by applying rigid-body transformations until the attenuation corrected PET data minimize an alignment metric based on the two-dimensional (2D) Radon consistency conditions. In this work, we enforce the first three moments of the Helgason–Ludwig consistency conditions on 2D Radon transforms in a method originally proposed by Welch et al.14 Their method uses Natter’s formulation of the consistency conditions
| (1) |
where E(s,ϕ) are the measured data, A(s,ϕ) are the projections of the attenuation image, m≥0 is the moment being computed, and k is Fourier component.17 The radial distance from the center of rotation s and the azimuthal angle of rotation ϕ index the Radon transform space.
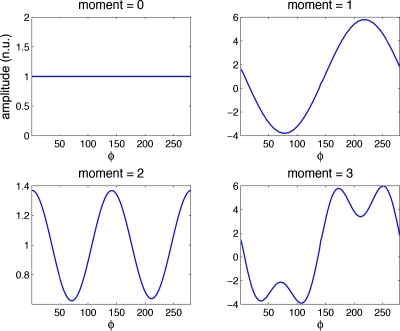
If the attenuation corrected projection data are consistent, Φm,k=0 when k>m or when k+m is odd. This relationship is a result of the fact that the moments of projections through an object are periodic in azimuthal angle. We present a proof of Eq. 1 in the Appendix0; to the best of our knowledge, this is a new proof of this well-accepted relationship. Figure 1 plots the projection moments [inner integral over s in Eq. 1] for noise-free data versus azimuthal angle. The zero-order moment of the consistency conditions states the well known property that the sum of the projection data for each view of a set of parallel-beam projections is a constant, independent of the projection angle. The zeroth moment in Fig. 1 shows that the sum of projections is the same at all angles. The first order moment shows that the projections of the center of mass in the object (a single point) form a sine wave with period one in the sinogram. The second moment plot reveals a sine wave with period 2; the third contains sine waves with periods 1 and 3. Likewise, higher order moments result in combinations of sine waves with greater periodicity. If projections are inconsistent, the moments will contain higher frequency information. The outer integral of Eq. 1 performs the Fourier transform of these moments; if the Fourier coefficients greater than the moment (k>m) have values, then the projections are inconsistent.
Figure 1.
Moments of noise-free projection data versus azimuthal angle bin reveal the periodicity of higher order moments and conceptually support the proposed formulation of the Radon consistency conditions. Curves are presented in normalized units.
Bromiley et al.,15 in a follow-up to their original work, used these conditions to perform attenuation-emission alignment in conventional PET imaging through transformations of a flawed (misaligned) attenuation image. In this work, we modify their method for use with cardiac PET∕CT imaging. We find the CT derived attenuation image which minimizes the objective function defined as
| (2) |
where Φm,k(z) is calculated for each transaxial slice z. The set of coefficients Cm varies for each moment as C0={1,…,9}, C1={0,2,…,9}, C2={1,3,…,9}. The summation range of m and k is a potentially adjustable parameter in this objective function. After application to several patient PET data sets, we determined that the optimal alignment parameters essentially do not change with the incorporation of larger ranges for moments or Fourier coefficients.
OPTIMIZATION ALGORITHM
The search for the optimally aligned attenuation map is performed with a simplex algorithm.18 In our method, the algorithm is optimized over six rigid-body transformation variables: Volume translations in x,y,z and rotations around the x,y,z axes. A single PET field of view (FOV) spans approximately 15 cm in the z direction. In this work, we enforce the consistency conditions over the central 12 cm (central slices) to apply alignment in the problematic regions for cardiac imaging (mediastinum and right diaphragm) and to allow for errors at the edge of the axial FOV as the attenuation image is translated and rotated out of the FOV. Furthermore, most mismatch of attenuation∕emission images in PET∕CT occurs because of respiratory motion, which is primarily a z axis translation. We modified the simplex optimization to preferentially search the z translation space and allow for greater variation in the z translation than the other variables. As the attenuation map is shifted out of axial slices, we replace voxels with replicates of the nearest slice to ensure that there is an attenuation map for all slices.
METHODS
NCAT simulations
In order to evaluate the performance of the alignment algorithm at different noise levels and different initial misaligned attenuation maps, we performed PET simulations based on the NURBS-based cardiac torso (NCAT) phantom.19 We generated emission and attenuation maps. Voxelized realizations of the activity and attenuation were forward projected into 2D PET data with a geometry and sampling similar to clinical PET scanners. Photon attenuation was added to the emission data and 20% scattered and random coincidences were modeled as a uniform additive term. The resulting emission distribution was scaled to five different levels before adding Poisson noise to model acquisitions with 1×10⁸, 5×10⁷, 2.5×10⁷, 1×10⁷, and 1×10⁶ total events. The maximum event number roughly matches the number of events in a typical clinical cardiac PET ammonia acquisition with 10 mCi injected and imaged 5 min postinjection for 15 min. As a result, these event levels represent typical clinical levels down to 1∕100 the typical number of events. To evaluate reproducibility of alignments, we simulate five independent and identically distributed noise realizations of each noise level.
We attempted to align three variations in the attenuation map with the simulated emission data. First, we start with a matched attenuation map to ensure that the alignment procedure does not estimate an erroneous transformation. We also applied rigid transformations to the map consisting of an x translation=10 mm and z translation of +15 mm (mistmatch 1) and an x translation=−10 mm and z translation of −15 mm (mistmatch 2).
The attenuation maps were automatically aligned with the simulated emission data with the proposed method. In total, the three different attenuation maps were aligned with the five noise realizations of five different event levels for a total of 75 different scenarios. The root mean square error (RMSE) of the three translation dimensions and the error in the z axis translation in the resulting aligned attenuation map are reported.
Single patient studies
To explore the basic behavior of the proposed method, we applied the method to a few single patient studies. We first tested the alignment process with two sets of patient data from N13-ammonia cardiac perfusion PET∕CT studies. These studies were performed on a General Electric Healthcare (Waukesha, WI) DSTE PET∕CT scanner in 2D mode. The attenuation map and emission projection data were extracted for offline processing. The emission data were corrected for all physical effects (random, normalization, dead time, and scatter) except attenuation using the product estimates. The scatter estimate was derived from the initial attenuation map. Considering that scatter is very smoothly varying, we assume that the initial estimate will not change significantly for the up to 2 cm transformations that will be applied, so we use the initial estimate for the entire alignment process. All image transformations and reconstructions were performed with custom software (not with the product reconstruction engine).
Patient A is a study with “correct” attenuation-emission alignment, as deemed by visual inspection of attenuation and emission images. With this realistic noise study, we first evaluated the behavior of the objective function with multiple transformations. There are six transformation dimensions to explore; we performed exhaustive searches of the value of the objective function for z translations (our experience shows that this is the dimension with greatest frequency of misalignment), x translations, and rotation around the z axis. To assess the values of different orders of moments, we forced a 16 mm inferior translation on the attenuation map and evaluated the objective function to determine the presence of local minimum. Second, we forced an arbitrary (x,y,z) translation=(−16.4,−10.9,19.6) mm and rotation around (x,y,z) axis=(3°,0°,1°) for the attenuation map. This misaligned map was the starting map for the simplex search for the optimal transformation.
Patient B is a study with initially misaligned attenuation and emission images, as determined by visual inspection. We performed the simplex search for 70 iterations to find an “aligned” attenuation map.
Multiple patient studies
To evaluate reproducibility, we tested the proposed method with the patient data from six N13-ammonia cardiac PET∕CT exams. In this study approved by the University of Washington Institutional Review Board, we enrolled patients (98±28 kg) referred for cardiac PET perfusion exams for routine clinical evaluation. Five patients received both a rest and stress PET exam and one patient received only a rest exam (total of 11 exams). Each rest∕stress exam had two separate cine CT scans (one exam had only one cine CT scan) (total of 21 CT acquisitions). The average and intensity maximum10 of these cine acquisitions lead to n=42 separate emission-attenuation combinations. All exams were performed with quiet tidal breathing. These combinations were evaluated by three independent reviewers, who scored the alignment as unacceptable (visible emission artifacts due to attenuation mismatch), borderline (possible artifacts), or acceptable (no artifacts). Through this scoring procedure, eight combinations from five different patients were scored acceptable and eight combinations from four different patients were scored as unacceptable by all reviewers.
Similar to patient A above, the eight acceptable combinations were tested by forcing a known transformation on the attenuation map, evaluating the ability of the automatic algorithm to return the map back to the acceptable alignment. We applied a (x,y,z) translation=(10.9,−10.9,13.1) mm and rotation around (x,y,z) axis=(0°,0°,−3°) on the attenuation maps. We compared the sum of the RMSE of each transformation dimension after the proposed realignment. Therefore, each case started with a known RMSE error of 11.7 mm and 3°. Using custom reorientation and segmentation software based on prior work,6 we generated polar maps of the reoriented PET images attenuation corrected with the original acceptable map, the forced misaligned map, and the automatically aligned map. The polar maps were divided into 17 segments.20 In each segment, we computed the ratio of the misaligned AC PET polar map with the original AC PET polar map and the ratio of the automatically aligned AC PET polar map with the original AC PET polar map. Since nuclear perfusion images are evaluated clinically based on the relative perfusion of each segment, this ratio comparison provides a clinically relevant evaluation of the quantitative impact of misaligned attenuation.
Similar to patient B above, the eight unacceptable combinations were aligned with the proposed algorithm. We reconstructed images with the original unacceptable attenuation map and with the attenuation map after the proposed algorithm. Two independent observers reviewed the originally unacceptable emission∕attenuation images and the automatically aligned emission∕attenuation imaged. In a custom review software, both the original and autoaligned emission and attenuation images were presented simultaneously in a blinded fashion. The observer selected the preferred alignment combination.
RESULTS
NCAT simulations
Figure 2 presents attenuation maps and attenuation corrected reconstructions (filtered backprojection with 12 mm Hanning filter) of one simulation study with 2.5×10⁷ events. The proposed method improved the alignment of the emission and attenuation images and removed the artifacts due to attenuation errors, particularly in the mediastinum.
Figure 2.
Coronal views of simulations of cardiac PET/CT study. The attenuation images (row 1) provided attenuation correction for the PET images (row 2) simulated with 2.5×10⁷ events (roughly 1/4 typical number of events). Column (a) contains true attenuation correction. Column (b) contains mismatched attenuation correction that was aligned with the proposed method to generate results in column (c) containing reduced artifacts. The attenuation maps have matched colormaps and the PET images have matched colormaps.
Table 1 summarizes the mean alignment errors along with the standard deviation of the error across the five noise realizations for each scenario. The patient studies evaluated in this work had a mean of 2×10⁸ events, as discussed in Sec. 5C below. As a result, 2.5×10⁷–1×10⁸ events can be considered a conservative range for clinically relevant count levels. In this range, the alignment procedure reduced the RMSE to <4.3 mm and the z-axis error to <1.4 mm. When the events levels are an order of magnitude less than clinical, the z-axis error was greater (<2.6 mm) and the standard deviation of the error increased demonstrating that the alignment is less reproducible at higher noise levels. In the case of extreme noise (1×10⁶ events), the RMSE is not improved, although the z-axis error is reduced to <4.4 mm on average. For all cases, the error in the rotation variables was less than 1°, which can be considered negligible.
Table 1.
Error in alignment parameter estimates for NCAT simulations of multiple initial misalignments and noise levels. Mean (std) across five noise realizations.
| Initial AC map | Initial RMSE (mm) | RMSE (mm) of aligned AC map—Different count levels | ||||
|---|---|---|---|---|---|---|
| 1×10⁸ events | 5×10⁷ events | 2.5×10⁷ events | 1×10⁷ events | 1×10⁶ events | ||
| Matched | 0 | 0.4(0.3) | 0.4(0.1) | 0.8(0.2) | 2.8(1.1) | 6.4(3.5) |
| Mismatch 1 | 10 | 0.9(0.4) | 1.0(0.3) | 0.9(0.0) | 5.1(1.3) | 11.2(2.0) |
| Mismatch 2 | 10 | 3.8(0.9) | 4.2(0.0) | 4.3(0.1) | 4.9(0.7) | 9.3(6.9) |
| Initial Z error (mm) | Z (mm) error of aligned AC map | |||||
| Matched | 0 | 0.2(0.3) | 0.3(0.1) | 0.3(0.3) | 1.8(0.9) | 3.7(3.8) |
| Mismatch 1 | 15 | 0.7(0.8) | 1.1(0.4) | 1.4(0.3) | 1.2(0.6) | 4.4(1.0) |
| Mismatch 2 | −15 | 0.3(0.7) | 0.5(0.2) | 0.8(0.3) | 2.6(0.6) | 3.7(0.1) |
Single patient studies
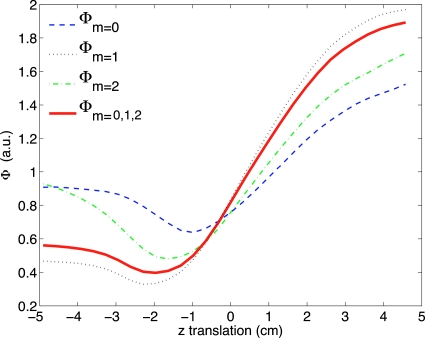
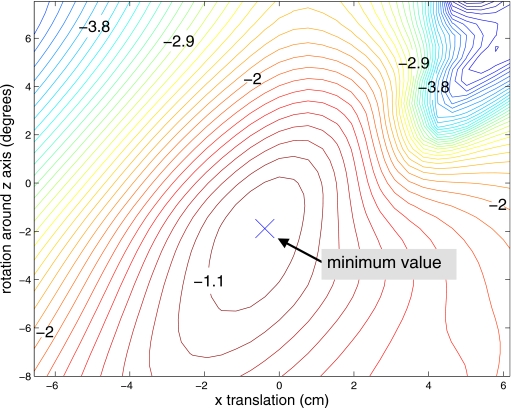
For patient A with a 16 mm forced z translation, the value of as a function of z translation of the attenuation image is presented in Fig. 3. The value of the objective function across two transformation parameters, with the other parameters fixed, appears in Fig. 4. This offers some insight into the behavior of the objective function for a single patient but does not take into account the effect of the other transformation dimensions. For this example, the objective function is well behaved with no local minimum in the range of interest. The variation in slope as the minimum is approached from different directions suggests that the choice of initial values for the transformation will affect the rate of convergence for this application.
Figure 3.
Objective function values for patient A as a function of translation in axial location with the other transformation dimensions fixed. Plots the values of Eq. 2 for different moments and for the sum of moments m=0,1,2. These curve shows that the objective function is well-behaved for this patient and for this dimension. The minimum should occur at approximately −1.6 cm since we forced a translation of 1.6 cm on the original aligned data.
Figure 4.
Contours of objective function values for patient A as a function of rotation around z and translation in x with the other transformation dimensions fixed. This case started with the original aligned data and the minimum should occur at approximately (0,0).
We also performed the full alignment optimization for patient A when the attenuation map was given a known misalignment. After 150 iterations, the simplex algorithm had fully converged to the estimated alignment transformation of (x,y,z)translation=(21.8,7.1,−25.7) mm and rotation around (x,y,z) axis=(−1.1°,1.5°,−0.5°). These values have a difference of (x,y,z) translation=(5.3,−3.8,−6.1) mm and rotation (x,y,z)=(1.9°,1.5°,0.5°) with the forced misalignment, representing an improved alignment. Furthermore, assessment of the images in Fig. 5 show that the automatically aligned attenuation map reduces artifacts in the attenuation corrected PET image, particularly along the lateral wall.
Figure 5.
Coronal views of a cardiac ammonia PET/CT study from patient A. The PET images (row 2) were attenuation corrected with the corresponding attenuation images from row 1. The original CT scan provided reasonable attenuation correction, as deemed by visual inspection and is labeled correct (a). We shifted the attenuation image to force a mismatch (column b). The alignment process successfully aligned the attenuation image (column c) with the emission data. Note that in column (b) the PET myocardium appears in the CT lung space and chest wall, leading to artifacts throughout the lateral wall in the PET image.
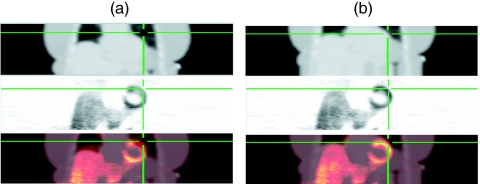
In patient B, the proposed method successfully aligned the attenuation image as presented in Fig. 6. Note the major artifacts in the emission image when using a mismatched attenuation image and the lack of these errors in the aligned image.
Figure 6.
Coronal views of reconstructed images from patient B ammonia PET/CT study. Column (a) presents the original attenuation map (row 1), attenuation corrected PET image (row 2), and fused PET/CT image. Column (b) presents the images after alignment with the proposed method. The alignment process reduced the incorrect attenuation correction values along the lateral free wall, removing the artifactual perfusion defect in the PET image. The cross hairs are triangulated to the same location in all images highlighting the lateral free wall of the myocardium.
Multiple patient studies
In all patient combinations representing a range of patient sizes and noise levels, the proposed method reproducibly converged to single solutions of aligned attenuation maps. The patient cohort enrolled in this study had a weight of 96±28 kg, a BMI of 32±7 kg∕m2, and included 5 males and 1 female. For the originally acceptable attenuation∕emission studies with a known forced transformation, the proposed algorithm was able to reduce the error of the forced transformation. When the known translation was applied, the RMSE of the translation parameters was 11.7 mm for all patients (all patients received same transformation). The average of the RMSE of the translation parameters across patients after proposed alignment was 6.6 mm. Table 2 summarizes the alignment errors. In one case (combination 3), the proposed algorithm estimated a rotation in the wrong direction (4.3° error), but reduced the error in the translations and resulting PET image as discussed below.
Table 2.
Error in alignment parameter estimates and AC PET polar map values for patient combinations with initially acceptable attenuation maps that were transformed a known amount and then automatically aligned.
| Patient combination | Error transformation | Ratio AC PET to initial AC PET | ||||||
|---|---|---|---|---|---|---|---|---|
| Number events | z rotation (deg) | Translation (mm) | Mean (std) of 17 segments | |||||
| x | y | z | RMSE | Autoalign AC | Misaligned AC | |||
| 1 | 4.8×10⁸ | −2.3 | −3.8 | −3.9 | 4.5 | 4.1 | 1.01 (0.02) | 0.84 (0.09) |
| 2 | 7.0×10⁷ | −2.4 | 2.2 | −4.6 | 8.6 | 5.8 | 0.96 (0.04) | 0.92 (0.15) |
| 3 | 2.0×10⁸ | −4.3 | −0.3 | −14.0 | 8.0 | 9.3 | 1.00 (0.04) | 0.92 (0.11) |
| 4 | 6.7×10⁷ | 0.5 | −5.5 | 11.7 | −0.9 | 7.5 | 1.00 (0.03) | 0.97 (0.05) |
| 5 | 8.6×10⁷ | −3.0 | 0.5 | −7.7 | 5.4 | 5.4 | 1.01 (0.06) | 0.86 (0.21) |
| 6 | 2.0×10⁸ | −2.9 | −3.7 | −10.1 | 4.7 | 6.8 | 1.01 (0.04) | 0.92 (0.11) |
| 7 | 1.4×10⁸ | −2.8 | 15.1 | 4.2 | 10.1 | 10.8 | 1.06 (0.07) | 0.95 (0.11) |
| 8 | 3.2×10⁸ | −0.4 | −3.9 | 2.6 | 1.5 | 2.9 | 0.98 (0.05) | 0.89 (0.11) |
| Mean | 2.0×10⁸ | −2.2 | 0.1 | −2.7 | 5.3 | 6.6 | 1.00 (0.03) | 0.91 (0.04) |
| Applied transformation | −3.0 | 10.9 | −10.9 | 13.1 | 11.7 | |||
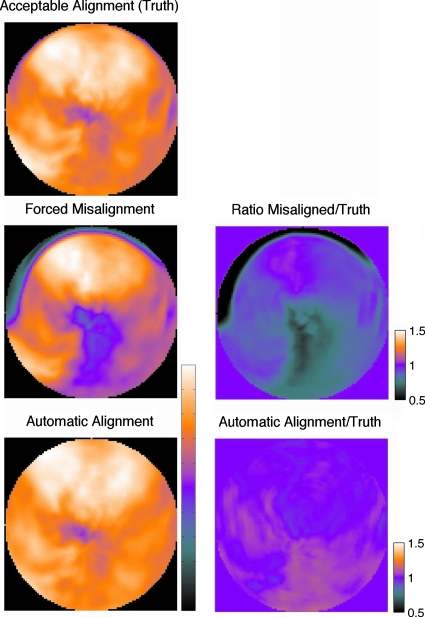
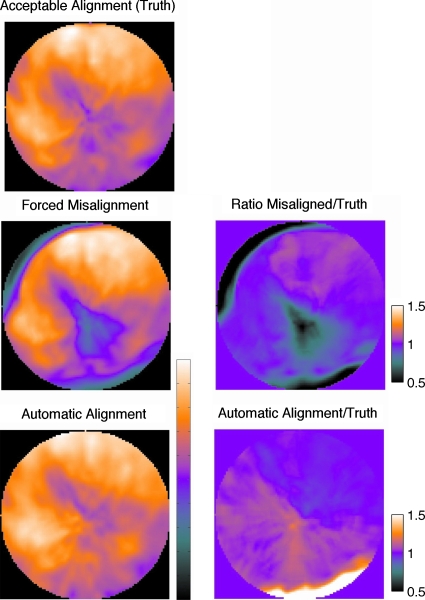
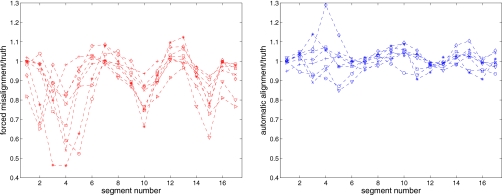
The polar maps for two representative patients are shown in Figs. 78. The PET image formed with the original acceptable aligned AC appears in the top row, followed by the map after a forced misalignment and the map after the automatic alignment. Assuming that the PET image formed with the original AC is truth, the ratio of the PET image formed with alternate AC to the original quantifies the relative error. The ratio images show that the forced misalignment caused an inferior wall artifact, with a 30% reduction in the apparent uptake. The automatic alignment resolved this artifact. Figure 8 presents polar maps for the patient with the most realignment error. Despite the realignment error and the introduction of a mild basal inferior error, there is no clinically relevant difference between the autoaligned AC image and the original AC image. The average across the eight studies for each segment is shown in Fig. 9 along with the complete segmental values plotted in Fig. 10. The misaligned AC PET image had, on average, a 30% reduction in the inferior wall, which would be considered an artifactual mild perfusion defect. All of the alignment methods removed this artifact. The average and standard deviation of the ratio images are presented in Table 2, confirming that the error and variation in error is reduced for all patients with the automatic method.
Figure 7.
Polar maps for a patient combination 1 showing the AC PET data with originally aligned map, after forced misalignment (row 2), and after proposed alignment (row 3). Ratio maps in the second column show that forced misalignment causes a clear AC artifact. After proposed alignment, there are no AC artifacts. In the first column, each polar map has its color range scaled to its maximum value to correspond to clinical qualitative presentation of a polar map.
Figure 8.
Polar maps for a patient combination 7, showing the AC PET data with originally aligned map, after forced misalignment (row 2), and after proposed alignment (row 3). Ratio maps in the second column show that forced misalignment causes a clear AC artifact. This study had the most realignment error (RMSE of 10.8 mm) with the known transformation. The alignment resolved the apical and basal anteroseptal errors, but reversed the basal inferior error.
Figure 9.
(a) Seventeen segment nomenclature. (b) Ratio polar plots of the misaligned to truth and (c) automatic alignment to truth values. The plots present the average ratio in each segment across the eight combinations. On average, the alignment method returned all segments to the original true value.
Figure 10.
Plot of the ratio of misaligned to truth (left) and automatic aligned to truth (right) for 17 segments for all eight patient combinations. The left plot reveals artifact causing defects particularly in mid- and basal inferior segments. Alignment method removes defects as shown in the right plot.
For the side-by-side blinded comparison of the eight originally unacceptable attenuation∕emission combinations, the two reviewers preferred the combination after the proposed algorithm in all cases, except one in which a single observer was unable to see a significant difference between the original and proposed. This evidence supports the argument that the proposed algorithm provides improved alignment.
Algorithm computation performance
The current implementation of the proposed alignment algorithm has not been optimized for computational complexity. The steps for each evaluation of the objective function include (1) rigid-body transform the attenuation volume, (2) forward project, (3) apply attenuation correction to emission data, (4) compute moments of AC emission data, (5) FFT the moments in ϕ, and (6) compute the objective function value. In the clinical patient studies presented here using 8×10⁵ image voxels and a projection space with 4×10⁶ entries, each function evaluation took 3 s on a 2.3 GHz PowerPC G5. A total optimization with 150 simplex iterations required 8 min.
DISCUSSION
Simulation and patient data demonstrate the efficacy of the proposed alignment scheme. A reasonable concern with the proposed method is whether the consistency criterion offers a sufficiently strong metric to drive an optimization of transformation parameters in the presence of the noise levels in cardiac PET exams. In simulation studies with a clinical range of count levels [(2.5–10)×107 events], the proposed algorithm reduced the misalignment to less than 5 mm RMSE. Likewise, in all patient studies, the proposed algorithm converged to improved alignment parameters, showing that the method works across a range of data noise levels and patient sizes. We choose to simulate very low count studies, such as 1∕100 the clinical level (1×10⁶ events), to demonstrate that the algorithm will eventually fail to improve alignment in the presence of extreme noise.
In multiple patients with originally acceptable alignment, we showed that the proposed method can recover known rigid-body translations and attenuation correction artifacts in the emission images. The automatic alignment procedure reduced the RMSE in the translation parameters by, on average, 40%. These results are not the true reduction in misalignment because we are using a potentially flawed truth based on the visual perception. As a result, the quantitative reduction in translation errors should not be accepted as absolute.
The simulation and patient evaluation does not test the ability to recover from potentially more realistic nonrigid misalignments. In practice, we assume that the attenuation image is relatively well-aligned with the emission data and simple rigid-body changes account for most of the mismatch errors. This assumption is not accurate in some extreme cases, such as this full inspiration to full expiration alignment. At present, the clinically accepted solution for misalignment is manual rigid-body translations. The proposed method could complement this manual procedure.
For patient cases with unacceptable alignment, the proposed method can automatically improve alignment between attenuation and emission data according to human observers. These results suggest that the proposed method could supplement the current standard of practice which is a manual alignment tool requiring subjective user intervention. We were unable to rigorously prove that the proposed method is superior to the manual tool because our initial subjective evaluation of attenuation-emission alignment with multiple observers led to highly variable results. For example, in the initial read of the acceptability of attenuation-emission combinations by three independent viewers, the interobserver variability in the scores was >40%. These observations confirm visually rating alignment is highly subjective and that a subjective manual alignment tool can lead to highly variable attenuation-emission alignments. This variability supports the need for an automatic approach such as the one proposed here that could at least provide an initial improved alignment to reduce the variability inherent with user interaction. Furthermore, the proposed method leads to an attenuation corrected PET image with reduced attenuation misalignment artifacts that could serve as a better image for attenuation-emission quality control.
The consistency conditions for the Radon transform are only accurate for continuous data with zero-width lines of response with uniform sensitivity. Herraiz et al.21 showed that small animal PET systems with their finite width, asymmetric responses are not “ideal” and that the consistency conditions are only approximately valid. We assert that our proposed use of the consistency conditions is still valid because we are ranking the consistency of projection data with different attenuation corrections. The consistency metric, with its slight flaws from being calculated on nonideal data, will still lead to the correct ranking of attenuation corrections. Furthermore, PET data from whole-body PET scanners have less asymmetry and are more “ideal” than data from small animal systems since intercrystal penetration and scatter is less of a concern with the larger detectors.22
CONCLUSION
We developed an automated attenuation correction alignment method for use with cardiac PET∕CT imaging. We demonstrated the proof of principle of the proposed method with simulation studies and measured patient data. Evaluation of the optimization shows that it converges to transformation parameters at a global minimum, leading to improved attenuation correction for cardiac PET imaging. We demonstrated improved alignment with the method across multiple patient studies with known mismatches and with initially unacceptable alignments. The proposed method provides an automatic, objective approach to align attenuation and emission images to provide an improved initial alignment. The images from the initial alignment could be used with manual quality assurance to potentially reduce user interaction.
ACKNOWLEDGMENTS
This work was supported by the NIH under Grant Nos. HL086713 and CA115870. The authors thank Dr. Kelley Branch for helping review initial attenuation-emission alignments.
APPENDIX: CONDITIONS FOR Φ=0
Proof that consistent attenuation corrected projection data have certain zero-valued Φm,k from Eq. 1. Let , , and . The Radon transform of a function h:R2→R is given by
Let f:R2→R be the activity concentration and μ:R2→R be the attenuation map. Then, the emission and attenuation data are given by
respectively. Now we set out to show that
for k>m or k+m odd. Then,
where we let x=sθ+tθ⊥. Now we have that
We will now show that the inner integral is zero for k>m and k+m odd, which will conclude our proof. Now with the help of the binomial theorem we have
Since δ2l+k−m=0 for l=0,…,m and k>m or k+m odd, the proof follows.
References
- Loghin C., Sdringola S., and Gould K., “Common artifacts in PET myocardial perfusion images due to attenuation-emission misregistration: Clinical significance, causes, and solutions,” J. Nucl. Med. 45, 1029–1039 (2004). [PubMed] [Google Scholar]
- Gould K., Pan T., Loghin C., Johnson N., Guha A., and Sdringola S., “Frequent diagnostic errors in cardiac PET/CT due to misregistration of CT attenuation and emission PET images: A definitive analysis of causes, consequences, and corrections,” J. Nucl. Med. 48, 1112–1121 (2007). 10.2967/jnumed.107.039792 [DOI] [PubMed] [Google Scholar]
- Le Meunier L., Maass-Moreno R., Carrasquillo J. A., Dieckmann W., and Bacharach S. L., “PET/CT imaging: Effect of respiratory motion on apparent myocardial uptake,” J. Nucl. Cardiol. 13, 821–830 (2006). 10.1016/j.nuclcard.2006.09.003 [DOI] [PMC free article] [PubMed] [Google Scholar]
- Lautamäki R., Brown T., Merrill J., and Bengel F., “CT-based attenuation correction in 82Rb-myocardial perfusion PET/CT: Incidence of misalignment and effect on regional tracer distribution,” Eur. J. Nucl. Med. 35, 305–310 (2008). 10.1007/s00259-007-0607-y [DOI] [PubMed] [Google Scholar]
- Goerres G., Burger C., Kamel E., Seifert B., Kaim A., Buck A., Buehler T., and von Schulthess G., “Respiration-induced attenuation artifact at PET/CT: Technical considerations,” Radiology 226, 906–910 (2003). 10.1148/radiol.2263011732 [DOI] [PubMed] [Google Scholar]
- Germano G., Kiat H., Kavanagh P. B., Moriel M., Mazzanti M., Su H. T., Van Train K. F., and Berman D. S., “Automatic quantification of ejection fraction from gated myocardial perfusion SPECT,” J. Nucl. Med. 36, 2138–2147 (1995). [PubMed] [Google Scholar]
- Nakamoto Y., Osman M., Cohade C., Marshall L. T., Links J. M., Kohlmyer S., and Wahl R. L., “PET/CT: Comparison of quantitative tracer uptake between germanium and CT transmission attenuation-corrected images,” J. Nucl. Med. 43, 1137–1143 (2002). [PubMed] [Google Scholar]
- Eisner R. L. and Patterson R. E., “Attenuation correction for stress and rest PET 82Rb myocardial perfusion images,” J. Nucl. Med. 48, 1912–1913 (2007). 10.2967/jnumed.107.045468 [DOI] [PubMed] [Google Scholar]
- Pan T. et al. , “Attenuation correction of PET images with respiration-averaged CT images in PET/CT,” J. Nucl. Med. 46, 1481–1487 (2005). [PubMed] [Google Scholar]
- Alessio A., Kohlmyer S., Branch K., Chen G., Caldwell J., and Kinahan P., “Cine CT for attenuation correction in cardiac PET/CT,” J. Nucl. Med. 48, 794–801 (2007). 10.2967/jnumed.106.035717 [DOI] [PMC free article] [PubMed] [Google Scholar]
- Martinez-Moller A., Souvatzoglou M., Navab N., Schwaiger M., and Nekolla S. G., “Artifacts from misaligned CT in cardiac perfusion PET/CT studies: Frequency, effects, and potential solutions,” J. Nucl. Med. 48, 188–193 (2007). [PubMed] [Google Scholar]
- Khurshid K., McGough R. J., and Berger K., “Automated cardiac motion compensation in PET/CT for accurate reconstruction of PET myocardial perfusion images,” Phys. Med. Biol. 53, 5705–5718 (2008). 10.1088/0031-9155/53/20/009 [DOI] [PubMed] [Google Scholar]
- Pathak S., Chalana V., Haynor D., and Kim Y., “Edge-guided boundary delineation in prostate ultrasound images,” IEEE Trans. Med. Imaging 19, 1211–1219 (2000). 10.1109/42.897813 [DOI] [PubMed] [Google Scholar]
- Welch A. et al. , “Attenuation correction in PET using consistency information,” IEEE Trans. Nucl. Sci. 45, 3134–3141 (1998). 10.1109/23.737676 [DOI] [Google Scholar]
- Bromiley A. et al. , “Attenuation correction in PET using consistency conditions and a three-dimensional template,” IEEE Trans. Nucl. Sci. 48, 1371–1377 (2001). 10.1109/23.958358 [DOI] [Google Scholar]
- Kinahan P. E., Hasegawa B. H., and Beyer T., “X-ray-based attenuation correction for positron emission tomography/computed tomography scanners,” Semin Nucl. Med. 33, 166–179 (2003). 10.1053/snuc.2003.127307 [DOI] [PubMed] [Google Scholar]
- Natterer F., The Mathematics of Computerized Tomography (Wiley, New York, 1986). [Google Scholar]
- Lagarias J., Reeds J. A., Wright M. H., and Wright P. E., “Convergence properties of the Nelder-Mead simplex method in low dimensions,” SIAM J. Optim. 9, 112–147 (1998). 10.1137/S1052623496303470 [DOI] [Google Scholar]
- Segars W. and Tsui B., “Study of the efficacy of respiratory gating in myocardial SPECT using the new 4-D NCAT phantom,” IEEE Trans. Nucl. Sci. 49, 675–679 (2002). 10.1109/TNS.2002.1039548 [DOI] [Google Scholar]
- Cerqueira M. D. et al. , “Standardized myocardial segmentation and nomenclature for tomographic imaging of the heart,” Circulation 105, 539–542 (2002). 10.1161/hc0402.102975 [DOI] [PubMed] [Google Scholar]
- Herraiz J., Espana S., Vicente E., Herranz E., Vaquero J., Desco M., and Udias J., “Revised consistency conditions for PET data,” IEEE Nuclear Science Symposium Conference Record, 2007, Vol. 5, pp. 3865–3870 (unpublished).
- Alessio A. M. and Kinahan P. E., “Improved quantitation for PET/CT image reconstruction with system modeling and anatomical priors,” Med. Phys. 33, 4095–4103 (2006). 10.1118/1.2358198 [DOI] [PubMed] [Google Scholar]


