Abstract
Purpose: To investigate the effect of monitor unit (MU) constraints on the dose distribution created by intensity modulated proton therapy (IMPT) treatment planning using single-field optimization (SFO).
Methods: Ninety-four energies between 72.5 and 221.8 MeV are available for scanning beam IMPT delivery at our institution. The minimum and maximum MUs for delivering each pencil beam (spot) are 0.005 and 0.04, respectively. These MU constraints are not considered during optimization by the treatment planning system; spots are converted to deliverable MUs during postprocessing. Treatment plans for delivering uniform doses to rectangular volumes with and without MU constraints were generated for different target doses, spot spacings, spread-out Bragg peak (SOBP) widths, and ranges in a homogeneous phantom. Four prostate cancer patients were planned with and without MU constraints using different spot spacings. Rounding errors were analyzed using an in-house software tool.
Results: From the phantom study, the authors have found that both the number of spots that have rounding errors and the magnitude of the distortion of the dose distribution from the ideally optimized distribution increases as the field dose, spot spacing, and range decrease and as the SOBP width increases. From our study of patient plans, it is clear that as the spot spacing decreases the rounding error increases, and the dose coverage of the target volume becomes unacceptable for very small spot spacings.
Conclusions: Constraints on deliverable MU for each spot could create a significant distortion from the ideally optimized dose distributions for IMPT fields using SFO. To eliminate this problem, the treatment planning system should incorporate the MU constraints in the optimization process and the delivery system should reliably delivery smaller minimum MUs.
Keywords: spot scanning proton therapy, IMPT, treatment planning, single-field optimization, monitor unit constraints
INTRODUCTION
The greatest advantage of using a proton beam for radiation therapy is that healthy tissues beyond the range of the proton beam can be spared due to the rapid falloff of the distal side of the depth dose of the Bragg peak.1 The most common method of delivering proton beam therapy is the passive scattering approach, which uses scattering devices to expand the pencil beam laterally, and a range-modulation device to create a spread-out Bragg peak (SOBP). In the form of scanning beam delivery, a pencil beam (spot) can be magnetically scanned in both directions lateral to the beam direction to create a large field without introducing scattering elements into the beam path.2, 3 Monoenergetic pencil beams with different energies from a synchrotron can be used to create the desired dose distribution.4 It is possible to modulate the intensity of each pencil beam to deliver intensity modulated proton therapy (IMPT).5, 6, 7, 8, 9 At The University of Texas M. D. Anderson Cancer Center (MDACC), the delivery and planning systems for the scanning proton nozzle have been commissioned and have been used to treat patients since May 2008.10 To date, we have only treated IMPT patients using a single-field optimization (SFO) method.5, 8 This option was chosen because it allows each field to deliver a uniform dose to the entire target volume and is, therefore, less sensitive to the proton range uncertainties.9 The scanning nozzle delivers the IMPT treatment “spot-by-spot” and “layer-by-layer.”4, 10 There are monitor unit (MU) constraints in terms of the minimum and maximum deliverable amounts for each spot. In the current version of the planning system, the MU constraints are not considered during optimization and are only dealt with during postprocessing, converting the raw optimized spots to deliverable spots that have MUs within the range defined by the minimum and maximum values. In this work, we studied the effect of MU constraints on the dose distributions in a homogeneous phantom as a function of target dose, SOBP width, range, and spot spacing.
We also studied the effect of MU constraints on the planned dose distribution for four prostate cancer patients as a function of spot spacing. The results of this study will help in the development of guidelines for selecting parameters for IMPT treatment planning using SFO.
While this work is specific for the discrete spot scanning delivery system at MDACC, any other discrete spot scanning system would encounter a similar problem if the planning system does not properly take care of the minimum MU constraint during optimization.
MATERIALS AND METHODS
Delivery and treatment planning systems
Proton pencil beams with 94 energies between 72.5 and 221.8 MeV, corresponding to proton ranges of 4.0–30.6 g∕cm2, generated by the synchrotron of the proton therapy facility at MDACC are available for IMPT treatment delivery using a scanning nozzle (Hitachi, Ltd., Tokyo, Japan and Hitachi America Ltd., Tarrytown, NY).4 The spot size, in terms of full width at half maximum (FWHM) of the single spot in air, varies with proton energy and ranges from approximately 12 mm for the 221.8 MeV beam to approximately 34 mm for the 72.5 MeV beam.10 For the scanning nozzle, a MU is based on a fixed number of output pulses from the main dose monitor ion chamber. Each pulse is related to a specific amount of charge collected in the monitor ion chamber. The number of pulses defining a MU was determined by using the International Atomic Energy Agency TRS 398 protocol11 under the following reference conditions: A 217 cGy uniform dose delivered to a 1 L volume of water using pencil beams with a maximum range of 30.6 g∕cm2, and a nominal SOBP width of 10 cm, a 10×10 cm2 field size, and a total of 217 MU.10
The minimum and maximum MU values for delivering each spot are 0.005 and 0.04, respectively. The resolution is 0.0001 MU, which is 1∕50 of the minimum MU. The minimum MU was chosen based on the following two considerations: (1) The spot dose should be greater than the expected delayed dose and (2) the accuracy of the spot position measurement would be reduced with a lower minimum MU. The delayed dose is the dose delivered after the beam spot termination signal is sent by the main dose monitor to the RF kicker. The RF kicker cannot terminate the extraction instantaneously after receiving the termination signal from the main dose monitor, and a small dose, up to 0.0025 MU, would be delivered. The spot position measurement error by the profile monitor and the spot position monitor would increase as the spot MU decreases. This is especially true for lower energies because of the lower signal-to-noise ratio, providing less reliable measurements for spots with very small MUs.
The delayed dose would only affect the delivery of the first spot for each field because the beam-off signal for each spot is triggered by the total accumulated MU starting from the first spot. For example, a treatment field has a series of spots of 0.005 MU each, and the delayed dose is 0.0025 MU for each spot. The beam-off signal would be triggered by the planned total accumulated MU: 0.005, 0.01, and 0.015 for the first, second, and third spots, and so on. With delayed dose, the beam would actually be turned off at 0.0075, 0.0125, and 0.0175 MU, and so on. Thus, the actual spot dose delivered would be 0.0075 MU for the first spot and 0.005 MU for the consecutive spots. In this approach, the beam is turned off slightly early to compensate for the delayed dose for all spots except the first one.
The maximum dose to be delivered is 0.04 MU, which is established before the location and size of the spot are determined. This is an important safety feature of our delivery system. The maximum spot MU value is also necessary to achieve a precise measurement of the spot position and size with the spot position monitor, as the gain setting for the spot position monitor is fixed for each energy layer, and a dynamic range of the spot dose (MUs) in a layer that is too large causes saturation in the output.10
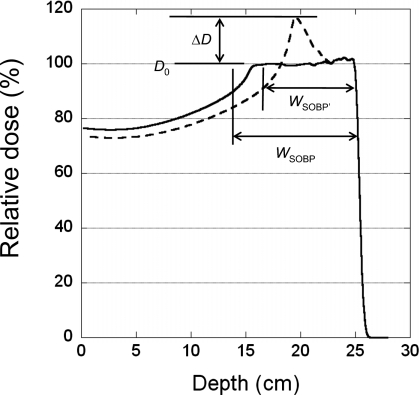
In this work, we used a treatment planning system with a proton module for passive scattering and scanning beams (Eclipse version 8.1, Varian Medical Systems, Palo Alto, CA). A proton pencil beam convolution dose algorithm was used by the planning system to calculate the dose distributions.12 The SFO option with simultaneous spot optimization was used in this work.13 In the current version of Eclipse, the spot spacing for each field can be determined as the fraction of the FWHM of the spot in air at the isocenter for the highest energy used for the field, SS=α×FWHMair, where α, which is a number less than 1, is specified during beam model configuration. The spot spacing can also be entered as a planning parameter for all fields by the planner. Once the spot spacing is determined for the field, it will be the same regardless of whether lower energies are used for the proximal layers. The deliverable minimum (0.005) and maximum (0.04) MU values were specified during beam model configuration of the treatment planning system. The MU constraints are not considered during optimization and are only dealt with during postprocessing by the treatment planning system when converting to deliverable spots with MU values within the range of 0.005–0.04 MU. Spots with MU values less than 0.005 but greater than 0.0025 were rounded up to 0.005; spots with MU values less than 0.0025 were rounded down to 0, i.e., turned off. For spots with MU values greater than 0.04, each spot was split into one or more spots with values of 0.04 MU and a remaining spot with a MU value less than 0.04. If the MU value of the remaining spot was less than 0.005 MU, the same rounding strategy was applied, as discussed above. The effects of rounding the minimum deliverable MU on the uniform SOBP created by the scanning beam are illustrated in Fig. 1.
Figure 1.
Definition of the parameters used for characterizing the distortion of the depth-dose curve. The dashed and solid lines are curves with and without rounding errors, respectively.
Phantom planning study
We used a rectangular target volume in a homogeneous mathematical phantom to study the impact of MU constraints on the dose distribution. Single-field plans were generated to create a uniform dose to the target volume with a range of 25 g∕cm2 and a field size of 10×10 cm2 with a constant MU per spot at each energy for three different spot spacings (5, 7, and 9 mm). Assuming a typical fraction dose of 200 cobalt centi-Gray equivalent (CcGE), we used individual fields with 100, 67, and 40 CcGE target doses, corresponding to equally weighted two-field, three-field, and five-field treatment plans, respectively, to study how the MU rounding effect changes with the prescribed dose for a 10 cm SOBP width (integer SOBP values are nominal SOBP widths, as defined by the treatment planning system). A field with a 20 CcGE target dose was also included to test the extreme situation in which a low-weight beam might be used to supplement the other beams. We then studied the dependence of the MU rounding error on the SOBP width at a dose of 100 CcGE. Finally, we tested how the rounding error would change with the range for a field with a 4 cm SOBP width, 10×10 cm2 field size, and 5 mm spot spacing. To characterize the distortion of the depth doses along the center of the field caused by MU rounding, we defined the relative height of the distorted peak in the depth dose as
| (1) |
where ΔD is the maximum dose increase above the uniform dose Do of the SOBP, as shown in Fig. 1. We also defined the change in SOBP width (W)
| (2) |
where WSOBP′ is the width for the distorted depth-dose curve due to the rounding error and WSOBP is the width for the depth-dose curve without the rounding error. The SOBP width is defined as the width between the distal 90% and proximal 95% of the depth-dose curve. The WSOBP used in Eq. 2 may not have the same numerical value as indicated by the nominal SOBP.
Patient planning study
In this work, we studied four prostate cancer patients previously treated with IMPT using SFO, including the patient with the smallest, the two patients with medium, and the patient with the largest prostate glands (Table 1) that we have treated to date. The clinical target volume (CTV) included the entire prostate gland and the proximal seminal vesicles (typically the first cm).14 All prostate cancer patients receiving proton therapy at MDACC are currently treated with parallel opposed right and left lateral fields for a prescribed dose of 76 cobalt Gray equivalent (CGE) in 38 fractions. The distal margin in cm used for each beam is given by
| (3) |
where R is the most distal range in cm for the CTV. In Eq. 3, we used 0.1 cm for the beam range uncertainty for accelerator energy only, instead of 0.3 cm, as used by Moyers et al.15 for a passive scattering beam, which includes uncertainties in the accelerator energy, variable scattering system thickness, and compensator thickness. Typically, the distal margin dm for the prostate is 0.9–1.1 cm. An optimization volume for scanning proton beam treatment planning, called the scanning target volume (STV), was defined for each prostate cancer patient using the distal margin for the patient’s lateral anatomic expansion, 0.6 cm for the posterior expansion, and 0.8 cm for the expansion from the CTV to everywhere else. The patient’s lateral anatomic expansion defined by Eq. 3 includes the range uncertainties for the lateral beam used for the prostate treatment. Expansions in other directions are based on our experience of setup uncertainties, which are similar to margins used for x-ray-based intensity modulated radiation therapy16 (IMRT) and passive scattering proton therapy17 for prostate patients. Treatment plans for each patient, with spot spacings of 3–9 mm in 1 mm increments, were created using SFO. The field lateral margin in the beam-eye-view was set equal to the spot spacing, i.e., we allowed one spot to be outside the STV. The prescription-isodose line was fixed for each patient at 97% or 97.5% (Table 1).
Table 1.
Patient-specific information for the four prostate cancer patient plans included in this study.
| Patient | CTV (cc) | STV (cc) | Prescription isodose line (%) | Right lateral field | Left lateral field | ||||
|---|---|---|---|---|---|---|---|---|---|
| Max Energy (MeV) | Nominal range (g∕cm2) | Nominal SOBP width (cm) | Max Energy (MeV) | Nominal range (g∕cm2) | Nominal SOBP width (cm) | ||||
| 1 | 25.5 | 107.1 | 97.0 | 201 | 26.0 | 8.9 | 201 | 25.4 | 8.6 |
| 2 | 45.8 | 145.3 | 97.0 | 185.8 | 22.3 | 9.8 | 185.8 | 22.8 | 11.2 |
| 3 | 61.0 | 187.7 | 97.0 | 185.8 | 22.4 | 11.0 | 185.8 | 22.5 | 11.3 |
| 4 | 130.4 | 313.7 | 97.5 | 206.3 | 27.0 | 12.3 | 206.3 | 26.9 | 12.2 |
Dose volume histogram (DVH) parameters were used to compare different plans. The percentages of total volumes receiving at least 76 CGE, V76, for targets (STV and CTV) and the percentages of total volumes receiving at least 70 CGE, V70, for bladder and rectum were used to compare the plans. We also used the percentages of total volumes receiving at least 20 and 30 CGE, V20 and V30, respectively, for bladder and rectum to compare the plans.
Analysis of the distribution of spot MU values
For each plan, we also calculated the ideal dose distribution using the treatment planning system by removing the minimum and maximum MU constraints in the beam configuration. Each treatment plan (with or without MU constraints) was exported from the planning system in DICOM-RT-ION format. A software tool written in MATLAB (The MathWorks, Inc., Natick, MA) was developed to analyze the MU distributions. The following quantities were of particular interest: The number of spots rounded down to zero (MU<0.0025) and the number rounded up to the minimum MU value of 0.005 MU (0.0025≤MU<0.005). We also tracked the number of spots that were split (original MU value >0.04). The software tool is also capable of calculating the histogram for the entire range of spot MU values for each plan.
RESULTS
Phantom planning study
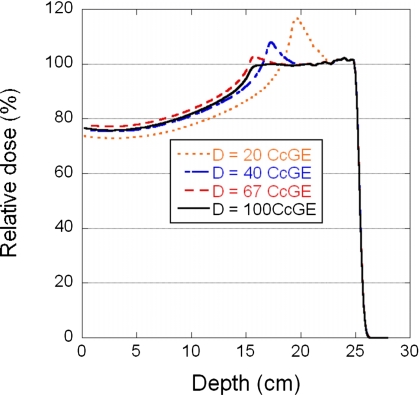
Shown in Fig. 2 are the relative central-axis depth doses for four different doses (20, 40, 67, and 100 CcGE) using a single field to deliver a uniform dose to a volume with a range of 25 g∕cm2, SOBP width of 10 cm, field size of 10×10 cm2, and spot spacing of 7 mm. Table 2 summarizes the relative peak height and changes in the SOBP width for three spot spacings (5, 7, and 9 mm) as a function of dose.
Figure 2.
Depth-dose curves for four different doses, 20, 40, 67, and 100 CcGE, normalized to the 100 CcGE curve. The field parameters are a range of 25.2 g∕cm2 range, SOBP width of 10 cm, field size of 10×10 cm2, and spot spacing of 7 mm.
Table 2.
Distortion peak height (H) and change in SOBP width (ΔWSOBP) of the depth dose as a function of dose for a 10 cm nominal SOBP width (SOBP width without rounding error is equal to 10 cm).
| Dose (CcGE) | H (%) | ΔWSOBP (cm) | ||||
|---|---|---|---|---|---|---|
| Spot spacing (mm) | Spot spacing (mm) | |||||
| 5 | 7 | 9 | 5 | 7 | 9 | |
| 20 | 23.3 | 16.8 | 8.0 | −6.1 | −2.4 | −1.1 |
| 40 | 17.2 | 7.5 | 2.6 | −3.1 | −0.7 | 0.5 |
| 67 | 10.5 | 2.7 | 0.0 | −0.7 | 0.5 | 0.1 |
| 100 | 7.9 | 0.0 | 0.0 | 1.4 | 0.0 | 0.0 |
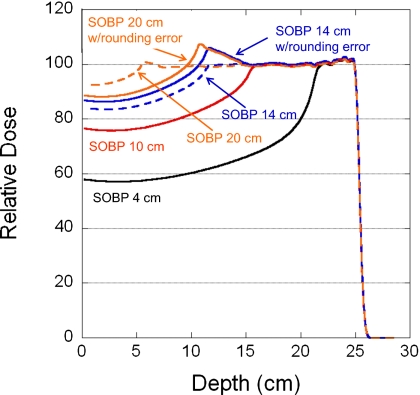
Figure 3 displays the relative central-axis depth doses for four SOBP widths (4, 10, 14, and 20 cm) using a single field to deliver a uniform dose of 100 CcGE to a volume with a range of 25 g∕cm2, field size of 10×10 cm2, and spot spacing of 7 mm. Also included in Fig. 3 are the ideal depth doses without MU constraints. The dose distortion parameters H and ΔWSOBP, as a function of SOBP width, are compiled in Table 3.
Figure 3.
Depth-dose curves for four nominal SOBP widths 4, 10, 14, and 20 cm. The field parameters are a range of 25.2 g∕cm2 range, field size of 10×10 cm2, and spot spacing of 7 mm. The solid and dashed lines are curves with and without rounding errors, respectively.
Table 3.
Distortion peak height (H) and change in SOBP width (ΔWSOBP) of the depth dose as a function of nominal SOBP width at a dose of 100 CcGE.
| Nominal SOBP width (cm) | H (%) | SOBP width (cm) without rounding error | ΔWSOBP (cm) | ||||
|---|---|---|---|---|---|---|---|
| Spot spacing (mm) | Spot spacing (mm) | ||||||
| 5 | 7 | 9 | 5 | 7 | 9 | ||
| 4 | 0.0 | 0.0 | 0.0 | 3.7 | 0.0 | 0.0 | 0.0 |
| 6 | 0.0 | 0.0 | 0.0 | 5.9 | 0.0 | 0.0 | 0.0 |
| 8 | 0.0 | 0.0 | 0.0 | 7.9 | 0.2 | 0.0 | 0.0 |
| 10 | 7.9 | 0.0 | 0.0 | 10.0 | 1.3 | 0.0 | 0.0 |
| 12 | 9.6 | 2.2 | 0.0 | 12.2 | 0.1 | 0.4 | 0.0 |
| 14 | 9.7 | 6.1 | 0.0 | 14.4 | −2.1 | 1.5 | 0.0 |
| 16 | 9.6 | 7.8 | 2.4 | 16.4 | −4.2 | 0.9 | 0.4 |
| 18 | 10.1 | 8.2 | 5.8 | 18.7 | −6.3 | −1.3 | 2.1 |
| 20 | 18.2 | 7.5 | 6.9 | 21.2 | −6.0 | −4.1 | 1.4 |
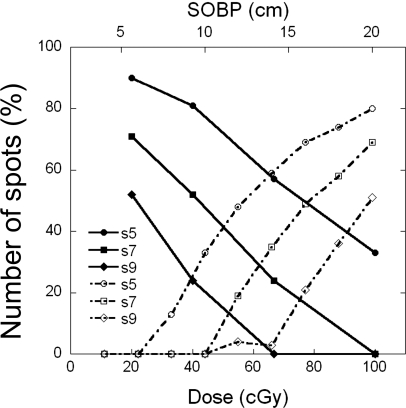
Plotted in Fig. 4 are the percentage of spots that had rounding errors for spot spacings of 5, 7, and 9 mm as a function of target dose for the 10 cm SOBP width and as a function of SOBP width for the 100 CcGE target dose. Table 4 provides details about the percentage of spots that were rounded down to zero and the percentage rounded up to the minimum deliverable MU value (0.005) as a function of SOBP width.
Figure 4.
Percentage of spots that had rounding errors for spot spacings of 5, 7, and 9 mm. Solid points represent data as a function of dose for a 10 cm nominal SOBP width; empty points represent data as a function of nominal SOBP width for a dose of 100 CcGE.
Table 4.
Percentage of spots that had rounding errors as a function of nominal SOBP width at a dose of 100 CcGE, range of 25 g∕cm2, and field size of 10×10 cm2 in the phantom planning study.
| Nominal SOBP width (cm) | Percentage of spots rounded down | Percentage of spots rounded up | ||||
|---|---|---|---|---|---|---|
| Spot spacing (mm) | Spot spacing (mm) | |||||
| 5 | 7 | 9 | 5 | 7 | 9 | |
| 4 | 0 | 0 | 0 | 0 | 0 | 0 |
| 6 | 0 | 0 | 0 | 0 | 0 | 0 |
| 8 | 0 | 0 | 0 | 13 | 0 | 0 |
| 10 | 0 | 0 | 0 | 33 | 0 | 0 |
| 12 | 19 | 0 | 0 | 30 | 19 | 4 |
| 14 | 35 | 0 | 0 | 24 | 35 | 3 |
| 16 | 45 | 14 | 2 | 24 | 35 | 19 |
| 18 | 58 | 30 | 0 | 15 | 28 | 36 |
| 20 | 69 | 47 | 17 | 11 | 21 | 34 |
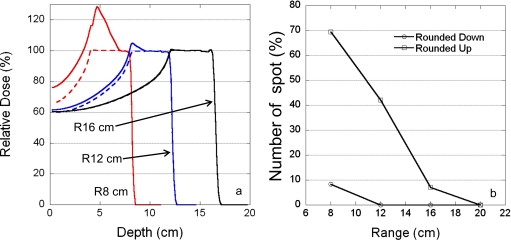
Figure 5 shows the effect of proton range on the MU rounding errors; the rounding error increased as the proton range decreased. Also included in Fig. 5 are the ideal depth doses without MU constraints.
Figure 5.
Dependence of rounding errors on the proton range. (a) Depth-dose curves for three different ranges: 8, 12, and 16 cm. Solid and dashed lines are curves with and without rounding errors, respectively. (b) Percentage of spots with rounding errors as a function of proton range. The field parameters are 4 cm SOBP width, 10×10 cm2 field size, and 5 mm spot spacing. Circles and squares represent the percentage of spots rounded up and down, respectively.
Patient planning study
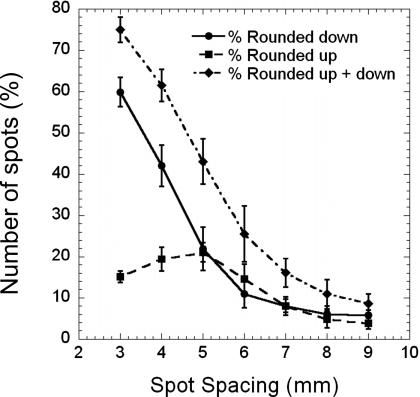
Shown in Fig. 6 is the average percentage of spots that were rounded up, rounded down, or both as a function of spot spacing in the treatment plans for the patients listed in Table 1. The standard deviations were calculated from eight different fields (4 patients×2 fields). The results in Fig. 6 were derived from analyzing the treatment plans calculated without MU constraints.
Figure 6.
Percentage of spots with rounding errors as a function of spot spacing for four prostate cancer patients planned with two parallel opposed lateral fields. Squares and circles represent the percentage of spots rounded up and down, respectively; diamonds represent the total percentage of spots with rounding errors. Error bars are ±1 standard deviation.
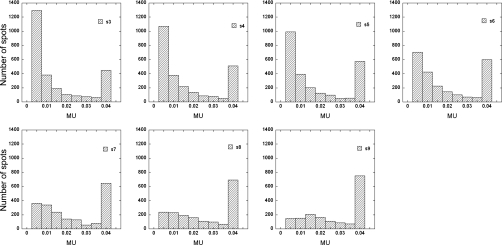
Figure 7 shows the histograms of spot MU values for the right lateral field of patient 3 for spot spacings from 3 to 9 mm. The results in Fig. 7 were from treatment plans calculated with MU constraints.
Figure 7.
Examples of spot distributions as a function of MU value for spot spacings of 3 to 9 mm in 1-mm increment for the right lateral field of patient 3.
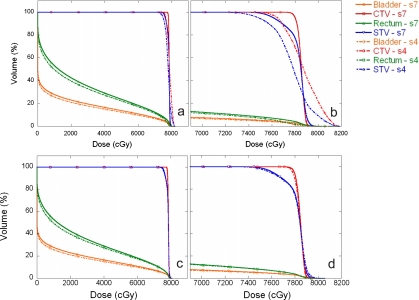
We compared the DVHs between treatment plans generated using spot spacings of 4 and 7 mm for patient 4, both with and without MU constraints (Fig. 8). Table 5 is a summary of the average DVH parameters, including V76 for the CTV and STV, V70 for bladder and rectum, and spot spacings between 3 and 9 mm, with and without MU constraints. The standard deviations were calculated from the four patients included in this study.
Figure 8.
Comparisons of DVHs between treatment plans generated using spot spacings of 4 and 7 mm for patient 4. The solid lines represent the treatment plan with a 7 mm spot spacing and the dashed-dotted lines represent the treatment plan with a 4 mm spot spacing. Panels (a) and (b) are with MU constraints. Panels (c) and (d) are without MU constraints. Panels (b) and (d) are expanded views of the DVHs.
Table 5.
Comparison of DVH parameters for STV, CTV, bladder, and rectum for treatment plans with and without MU constraints.
| Spot spacing (mm) | STV (V76) | CTV (V76) | Bladder (V70) | Rectum (V70) | ||||
|---|---|---|---|---|---|---|---|---|
| Const. | No Const. | Const. | No Const. | Const. | No Const. | Const. | No Const. | |
| 3 | 36±15 | 94±1 | 36±15 | 100±0 | 6.8±1.9 | 7.6±2.3 | 8.3±1.1 | 9.9±1.7 |
| 4 | 88±2 | 94±2 | 99±1 | 100±0 | 7.4±2.1 | 7.7±2.3 | 9.6±1.6 | 10.1±1.9 |
| 5 | 96±1 | 96±0 | 100±0 | 100±0 | 8.3±2.3 | 8.1±2.4 | 10.5±1.9 | 10.4±1.8 |
| 6 | 97±1 | 97±1 | 100±0 | 100±0 | 8.3±2.5 | 8.2±2.5 | 11.0±1.6 | 10.9±1.6 |
| 7 | 96±1 | 96±1 | 100±0 | 100±0 | 8.3±2.5 | 8.3±2.5 | 10.7±1.9 | 10.6±1.9 |
| 8 | 96±1 | 96±1 | 100±0 | 100±0 | 8.3±2.3 | 8.2±2.3 | 11.2±1.6 | 11.2±1.7 |
| 9 | 96±1 | 96±1 | 100±0 | 100±0 | 8.4±2.6 | 8.4±2.6 | 11.0±1.6 | 11.0±1.6 |
DISCUSSION
We have shown that rounding errors caused by MU delivery constraints could create significant distortions from ideally optimized dose distributions depending on the intended target dose, SOBP width, spot spacing, and proton range. The observed distortions can be attributed to the minimum MU constraint. These distortions are caused by “MU starvation,” i.e., there are not enough MUs to be shared by many pencil beams under certain conditions. For SFO, in general, the weights of the proximal spots are smaller than the weights of the distal spots due to the doses contributed by the distal spots to the proximal end. After the onset of MU starvation, there is a general trend in affected SOBPs. Proximal spots are mostly rounded down giving lower doses than expected from the entrance to the start of the plateau. This is followed by a midplateau region that is mostly rounded up, increasing the dose in this region, and finally by the distal region that is unaffected by the rounding process. With the current implementation, the maximum MU constraints indirectly contribute to the rounding errors when, after splitting the raw spot into one or more spots with the maximum deliverable MU value (0.04), the MU value of the remaining spot is less than the minimum. However, the effect of the maximum MU constraint is very small and is not visible on the prostate cases tested in this study. Nevertheless, the rounding error due to the maximum MU constraints can be completely eliminated if a different splitting strategy is used. For example, if, after splitting N times, the remaining spot is less than the minimum MU value, one can simply split the raw spot into N+1 equally weighted spots.
The number of spots that have rounding errors increases as the dose decreases. For the 7 mm spot spacing, when the dose per field was reduced to 67 CcGE, a small distortion peak (<3%, Fig. 2 and Table 2) was observed at the proximal end of the SOBP, and also, the SOBP width was slightly larger. These distortions are caused by rounding up, which has a larger effect than rounding down under this condition. For the 40 CcGE dose, the distortion peak height is larger (∼7.5%, Table 2) and the SOBP width is slightly smaller (0.7 cm smaller for the 7 mm spot spacing) than that of the ideal dose distribution. In this case, both rounding up and down contribute to the dose distortion, but rounding up has a larger effect. For the 20 CcGE dose, the distortion peak height is much larger (∼17%, Table 2, 7 mm spot spacing), and the SOBP width is significantly smaller (2.4 cm smaller, Table 2) than that of the ideal dose distribution. In this situation, the error due to rounding down becomes larger than the rounding up error. This observation is found to be true, in general, for other spot spacings, except that the magnitude of the rounding error increases as the spot spacing decreases (Table 2).
The number of spots that have rounding errors increases as the SOBP width increases. For the 7 mm spot spacing, the distortion of the peak starts to appear at the 12 cm SOBP width (∼2%) and its height increases to about 8% at larger SOBP widths (Fig. 3. and Table 3). The distorted SOBP width initially increases somewhat with the nominal SOBP width and is followed by a rapid decrease. The distortion peak height and change in SOBP width do not depend proportionally on the SOBP width. This is most likely due to the fact that, while the total number of rounded spots and the number of spots rounded down are more or less proportional to the SOBP width, the number of spots rounded up does not monotonically increase with SOBP width (Table 4). For larger SOBP widths, the spots in the deeper layers (higher energies) contribute most of the dose. There may not be enough MUs to be shared by the spots in the proximal layers. Therefore, more spots have rounding errors in the delivered MU at larger SOBP widths.
It is important to note that the dependence of MU rounding on the dose, SOBP width, spot spacing, and range are interrelated. For smaller SOBP widths, for example, the effect of rounding at the same dose, spot spacing, and range will be less than that for larger SOBP widths.
For the prostate cancer patient plans studied here, the dose per field was fixed based on the prescribed dose and number of fields used, and the range and SOBP width were set depending on the patient’s anatomy and range uncertainty. The only variable is the spot spacing. We have observed that as the spot spacing is reduced to below 5 mm, the percentage of spots with rounded down MU values increases rapidly (Fig. 6). On the other hand, the percentage of spots with rounded up MU values initially increases as the spot spacing decreases, reaches a maximum at the 5 mm spot spacing, and then slightly decreases as the spot spacing is reduced. The percentage of spots with MU values rounded up does not continuously increase with decreasing spot spacing because as the spot spacing decreases, more spots have MU values that are less than half of the minimum MU value and, thus, are turned off.
From the DVH comparison of prostate plans without MU constraints (Fig. 8 and Table 5), the target volume coverage is acceptable independent of spot spacing. For bladder and rectum, smaller spot spacings provide slightly lower V70 (Table 5) and lower V20 and V30 values (Fig. 8). Therefore, without MU constraints and not considering delivery-related issues, the smaller spot spacing provides better treatment plans.
For prostate plans with MU constraints (Fig. 8 and Table 5), it is clear that 3 and 4 mm spot spacings are not adequate for target volume coverage. For example, the average V76 for STV are only 36±15% and 88±2% for spot spacing of 3 and 4 mm, respectively. For bladder and rectum, smaller spot spacings provide slightly lower V70 values and V20 and V30 values that are a few percent smaller. Thus, for treatment plans with MU constraints, we need to use a spot spacing of at least 5 mm. The plans with 5 mm or larger spot spacing also meet the gamma 3% and 3 mm requirement18 with MU constraints vs without MU constraints.
For the 5 mm spot spacing, on average, more than 40% of spots had MU rounding errors, and more than 20% were rounded up and down. For example, the interval between 0.005 and 0.01 MUs had the largest number of spots with 5 mm spot spacings for the right lateral field of patient 3 (Fig. 7). Among these spots, more than 600 were rounded up to 0.005. Too many spots with small MU values can also create various problems for treatment planning and treatment delivery. For example, the time required for optimization and dose calculation would become very long for treatment planning, and dosimetric and positional accuracy would be reduced when delivering many very small MUs. Therefore, a spot spacing of at least 6 mm should be used for prostate cancer patients treated with two lateral beams using the current planning and delivery systems at our institution. A 6 mm spot spacing translates to a spot spacing that is approximately 0.33 of the FWHM of the Bragg peak in water at the highest energies normally used for prostate patients. In our current clinical practice, a spot spacing of approximately 9 mm is used for prostate patients, which is about 0.5 of the FWHM of the Bragg peak in water. We are currently studying optimal spot spacings considering both delivery constraints (spot MU constraints, and spot position and dose accuracy) and dosimetric advantages (smaller penumbra).19, 20
Although the beam is turned off slightly early to compensate for the delayed dose for all spots except the first one, we could not reduce the minimum MU value without reducing the delayed dose. If the minimum MU value is reduced to less than the delayed dose MU value, the next spot with a MU value equal to or less than the delayed dose MU value would be skipped and irradiation would be aborted due to the spot position error in the current implementation of the Hitachi delivery system. Therefore, it would be desirable to reduce the delayed dose in our delivery system. One might use a variable extraction rate from a synchrotron; for spots with small MU values, the extraction rate could be reduced, lowering the delayed dose. With a smaller minimum MU value, the uncertainty in spot weights may increase for the spots with small MU values. With smaller minimum MU values, the signal-to-noise ratio would decrease in the spot position monitors. Therefore, the uncertainty in the spot position measurement would also increase. The allowed tolerances for deviations in spot positions from the prescribed positions would also need to increase in order to deliver these spots with smaller MU values. The dosimetric impact of larger uncertainties in spot weights and positions for spots with very small MU values might be acceptable simply because these spots have small weights. However, this requires further investigation.
The treatment delivery advantage of turning off spots with small MU values is faster overall irradiation times. In the current implementation, spots with MU values less than 0.0025 are removed. However, in the extreme situation where there are too many spots removed, the dose distribution would be distorted (Figs. 23 and Table 5).
Incorporating machine-dependent dose delivery constraints imposed by the multileaf collimator into the optimization process has been widely used for patients treated with x-ray IMRT.21, 22 The MU constraints for scanning proton pencil beam delivery should be incorporated into the treatment plan optimization process to eliminate, or at least minimize, the distortions in dose distributions. For example, the planning system could turn off all spots with MU values less than the minimum MU value after optimization and reoptimize the plan after setting these small MU spots to 0 MU. This process could be carried out iteratively for the optimization process.5 Before such an optimization algorithm becomes available for the planning system used in our clinic, we could reduce the effect of the deliverable spot MU constraints by carefully selecting planning parameters. First, we could use no more than three or four fields per fraction and avoid fields with low-dose weights. In general, this should not be a problem, since we can use 50 cGy or more per field with 200 cGy per fraction and three to four fields for a typical proton plan. Next, we could avoid selecting beam directions that have very large SOBP widths. Lastly, we could select the proper spot spacing.
CONCLUSIONS
We have conducted phantom and patient treatment plan studies to understand the impact of MU delivery constraints on the quality of IMPT plans using SFO. Constraints on deliverable MU values for each spot could create significant distortions from the ideally optimized dose distributions for a scanning proton beam. These potential distortions in the dose distribution could be reduced by carefully selecting planning parameters. For prostate patients treated with two lateral fields, using the current version of Eclipse planning system and Hitachi delivery system, we recommend that the spot spacing be at least 6 mm or 0.33 of the FWHM of the Bragg peak at the highest energy used for the field. To eliminate the distortions in dose distributions, the treatment planning system should incorporate the MU constraints in the optimization process and the delivery system should use smaller minimum MU value. We have clearly demonstrated a real need for a better coordination between the treatment delivery and planning systems.
ACKNOWLEDGMENTS
The authors greatly appreciate Kate J. Newberry, Ph.D., in the Department of Scientific Publications at The University of Texas M. D. Anderson Cancer Center for her editorial review of this manuscript. The authors would like to thank Koji Matsuda of Hitachi Power Systems for helpful discussions about the minimum MU constraints for the Hitachi scanning beam delivery system. This work was partially supported by National Institutes of Health Grant No. P01-CA21239.
References
- DeLaney T. F. and Kooy H. M., Proton and Charged Particle Radiotherapy (Lippincott Williams & Wilkins, Philadelphia, 2008). [Google Scholar]
- Pedroni E., Bacher R., Blattmann H., Bohringer T., Coray A., Lomax A., Lin S., Munkel G., Scheib S., Schneider U., and Tourovsky A., “The 200-MeV proton therapy project at the Paul Scherrer Institute: Conceptual design and practical realization,” Med. Phys. 22, 37–53 (1995). 10.1118/1.597522 [DOI] [PubMed] [Google Scholar]
- Haberer T., Becher W., Schardt D., and Kraft G., “Magnetic scanning system for heavy ion therapy,” Nucl. Instrum. Methods Phys. Res. A 330, 296–305 (1993). 10.1016/0168-9002(93)91335-K [DOI] [Google Scholar]
- Smith A. R., Gillin M. T., Bues M., Zhu X. R., Suzuki K., Mohan R., Woo S., Lee A., Komaki R., Cox J., Hiramoto K., Akiyama H., Ishida T., Sasaki T., and Matsuda K., “The M. D. Anderson proton therapy system,” Med. Phys. 36, 4068–4083 (2009). 10.1118/1.3187229 [DOI] [PubMed] [Google Scholar]
- Lomax A. J., “Intensity modulation methods for proton radiotherapy,” Phys. Med. Biol. 44, 185–205 (1999). 10.1088/0031-9155/44/1/014 [DOI] [PubMed] [Google Scholar]
- Lomax A. J. et al. , “Intensity modulated proton therapy: A clinical example,” Med. Phys. 28, 317–324 (2001). 10.1118/1.1350587 [DOI] [PubMed] [Google Scholar]
- Lomax A. J., Bohringer T., Bolsi A., Coray D., Emert F., Goitein G., Jermann M., Lin S., Pedroni E., Rutz H., Stadelmann O., Timmermann B., Verwey J., and Weber D. C., “Treatment planning and verification of proton therapy using spot scanning: Initial experiences,” Med. Phys. 31, 3150–3157 (2004). 10.1118/1.1779371 [DOI] [PubMed] [Google Scholar]
- Lomax A. J., “Intensity modulated proton therapy and its sensitivity to treatment uncertainties 1: The potential effects of calculational uncertainties,” Phys. Med. Biol. 53, 1027–1042 (2008). 10.1088/0031-9155/53/4/014 [DOI] [PubMed] [Google Scholar]
- Lomax A. J., “Intensity modulated proton therapy and its sensitivity to treatment uncertainties 2: The potential effects of inter-fraction and inter-field motions,” Phys. Med. Biol. 53, 1043–1056 (2008). 10.1088/0031-9155/53/4/015 [DOI] [PubMed] [Google Scholar]
- Gillin M. T., Sahoo N., Bues M., Ciangaru G., Sawakuchi G., Poenisch F., Arjomandy B., Martin C., Titt U., Suzuki K., Smith A. R., and Zhu X. R., “Commissioning of the discrete spot scanning proton beam delivery system at The University of Texas M. D. Anderson Cancer Center, Proton Therapy Center, Houston,” Med. Phys. 37, 154–163 (2010). 10.1118/1.3259742 [DOI] [PMC free article] [PubMed] [Google Scholar]
- Andreo P., Burns D. T., Hohfeld K., Huq M. S., Kanai T., Laitano F., Smyth V. G., and Vynckier S., “Absorbed dose determination in external beam radiotherapy: An international code of practice for dosimetry based on standards of absorbed dose to water,” IAEA Report No. TRS-398 (International Atomic Energy Agency, 2000).
- Varian Medical Systems, “Proton algorithm reference guide. Chapter 4: Dose model,” P/N B500299R01C, April, 2007.
- Varian Medical Systems, “Proton algorithm reference guide, Chapter 6: Eclipse proton optimizer for modulated scanning,” P/N B500299R01C, April, 2007.
- Meyer J., Bluett J., Amos R., Levy L., Choi S., Nguyen Q., Zhu X. R., Gillin M., and Lee A., “Scanning proton beam therapy for prostate cancer: Treatment planning technique and analysis of consequences of rotational and translational alignment errors,” Int. J. Radiat. Oncol., Biol., Phys. (in press). [DOI] [PubMed] [Google Scholar]
- Moyers M. F., Miller D. W., Bush D. A., and Slater J. D., “Methodologies and tools for proton beam design for lung tumors,” Int. J. Radiat. Oncol., Biol., Phys. 49, 1429–1438 (2001). 10.1016/S0360-3016(00)01555-8 [DOI] [PubMed] [Google Scholar]
- O’Daniel J. C., Dong L., Zhang L., De Crevoiser R., Wang H., Lee A. K., Cheung R., Tucker S. L., Kudchadker R. J., Bonnen M. D., Cox J. D., Mohan R., and Kuban D. A., “Dosimetric comparison of four target alignment methods for prostate cancer radiotherapy,” Int. J. Radiat. Oncol., Biol., Phys. 66, 883–891 (2006). 10.1016/j.ijrobp.2006.06.044 [DOI] [PubMed] [Google Scholar]
- Zhang X., Dong L., Lee A. K., Cox J. D., Kuban D. A., Zhu X. R., Wang X., Li Y., Newhauser W. D., Gillin M., and Mohan R., “Effect of anatomic motion on proton therapy dose distributions in prostate cancer treatment,” Int. J. Radiat. Oncol., Biol., Phys. 67, 620–629 (2007). 10.1016/j.ijrobp.2006.10.008 [DOI] [PMC free article] [PubMed] [Google Scholar]
- Low D. A., Harms W. B., Mutic S., and Purdy J. A., “A technique for the quantitative evaluation of dose distributions,” Med. Phys. 25, 656–661 (1998). 10.1118/1.598248 [DOI] [PubMed] [Google Scholar]
- Robertson D., Zhang X., Li Y., Lee A., Gillin M., Zhu X. R., and Mohan R., “Optimizing spot spacing and margin for intensity-modulated proton therapy planning,” Med. Phys. 36, 2554 (2009). [Google Scholar]
- Li H., Zhu X. R., Ciangaru C., Sahoo N., Suzuki K., Lee A., and Gillin M., “Spot position uncertainty of scanning proton pencil beam,” Med. Phys. 36, 2587 (2009). [Google Scholar]
- Shepard D. M., Earl M. A., Li X. A., Naqvi S., and Yu C., “Direct aperture optimization: A turnkey solution for step-and-shoot IMRT,” Med. Phys. 29, 1007–1018 (2002). 10.1118/1.1477415 [DOI] [PubMed] [Google Scholar]
- Dobler B., Pohl F., Bogner L., and Koelbl O., “Comparison of direct machine parameter optimization versus fluence optimization with sequential sequencing in IMRT of hypopharyngeal carcinoma,” Radiat. Oncol. 2, 33 (2007). 10.1186/1748-717X-2-33 [DOI] [PMC free article] [PubMed] [Google Scholar]


