

Abstract
Bone marrow-derived mesenchymal stem cells (BM-MSC) can be induced to differentiate into myogenic cells. Despite their potential, previous studies have not been successful in producing a high percentage of cardiac-like cells with a muscle phenotype. We hypothesized that cardiac lineage development in BM-MSC is related to cell passage, culture milieu, and enrichment for specific cell subtypes before and during differentiation. Our study demonstrated that Lin- BM-MSC at an intermediate passage (IP; P8-P12) expressed cardiac troponin T (cTnT) after 21 days in culture. Cardiac TnT expression was similar whether IP cells were differentiated in media containing 5-azacytidine + 2% FBS (AZA; 14%) or 2% FBS alone (LS; 12%) and both were significantly higher than AZA + 5% FBS. This expression was potentiated by first enriching for CD117/Sca-1 cells followed by differentiation (AZA, 39% and LS, 28%). A second sequential enrichment for the dihydropyridine receptor subunit α2δ1 (DHPR-α2) resulted in cardiac TnT expressed in 54% of cultured cells compared to 28% of cells after CD117/Sca-1+ enrichment. Cells enriched for CD117/Sca-1 and subjected to differentiation displayed spontaneous intracellular Ca2+ transients with an increase in transient frequency and a 60% decrease in the transient duration amplitude between Days 14 and 29. In conclusion, IP CD117/Sca-1+ murine BM-MSC display robust cardiac muscle lineage development that can be induced independent of AZA but is diminished under higher serum concentrations. Furthermore, temporal changes in calcium kinetics commensurate with increased cTnT expression suggest progressive maturation of a cardiac muscle lineage. Enrichment with CD117/Sca-1 to establish lineage commitment followed by DHPR-α2 in lineage developing cells may enhance the therapeutic potential of these cells for transplantation.
1. Introduction
Bone marrow-derived mesenchymal stem cells (BM-MSC) exhibit neurogenic, chondrogenic, adipogenic, osteogenic, and myogenic properties under specific differentiating conditions in vitro. Although these cells have contributed to improvement in overall cardiac performance in studies of myocardial regeneration, the mechanisms responsible for their therapeutic effects are not well established. BM-MSC are characterized as a small percent of lineage negative (Lin-) adherent cells and their myogenic lineage potential is highly dependent on the enrichment for specific markers following harvesting. Published results have shown that further enrichment of Lin- cells for the CD117 and Sca-1 membrane surface markers may improve BM-MSC ability to differentiate into cardiomyoctes [1-5]. Furthermore, cell surface markers such as CD117 change over time [2, 6] and from passage to passage in cultured cells. Thus, we hypothesize that in murine BM-MSC, differentiation into cardiomyocytes is dependent on cell passage and the potential for differentiation is greater in early passage cells (P≤12) compared to late passage cells (P≥20).
Previous studies indicate that there is no well-defined and consistent myogenic differentiation method. Some methods involve the use of 5-azacytidine, (AZA) a methyltransferase inhibitor. Although this reagent induces myogenic development [7-9], it has limited use in human cell therapy. Other differentiation protocols that induce myogenic commitment in BM-MSC include the use of TGF-beta [6] and neonatal or adult cardiomyocyte co-cultures [10-13]. A recent report on human embryonic stem cells (hESC) demonstrated that hESC cardiomyocyte differentiation increased when the cells were cultured in serum-free media compared to 20% serum in the media [14]. Thus, we also propose to evaluate BM-MSC differentiation in low serum (LS) media and compare it to AZA treatment.
We demonstrate here for the first time that CD117/Sca-1 enrichment following passage 10 in Lin- murine BM-MSC results in increased sarcomeric protein expression and spontaneous calcium transients that change over time in culture when differentiated in low serum. Furthermore, we show that a subsequent second enrichment for the dihydropyridine receptor subunit α2δ1 (DHPR-α2) and cell re-plating induces a greater expression of cardiac TnT expression than with CD117/Sca-1 enrichment alone. Thus we defined specific steps that allow an enhanced differentiation of BM-MSC into cardiomyocytes.
2. Materials and Methods
2.1 Animals
Mice were housed in the Biological Resources Laboratory at UIC (AAALAC accredited) and maintained in accordance with the Guide for the Care and Use of Laboratory Animals (National Research Council, revised 1996). Experimental protocols were approved by the Institutional Animal Care and Use Committee (IACUC) at UIC.
2.2 Bone Marrow Mesenchymal Stem Cell (BM-MSC) Characterization and Culture
Bone marrow was isolated from FVB.Cg-Tg(GFPu)5Nagy/J mice (Jackson Laboratory) as previously described [15]. Tibia and femur bones were stripped of muscle and placed in ice cold PBS + 2% FBS. The epiphyseal ends were removed and the bones were centrifuged at 4,000 × g for 1 minute in a microfuge tube. The bone marrow cells were suspended in ice cold PBS + 2% FBS, passed through a 70 μm filter and counted with a hemocytometer.
Filtered bone marrow cells were suspended in PBS + 2% FBS + 0.1 g/L phenol red and enriched for lineage negative (Lin-) cells using the SpinSep system (Stem Cell Technologies). The cells were incubated with Murine Progenitor Enrichment Cocktail (anti-CD5, anti-CD45R, anti-CD11b, anti-Gr-1, anti-TER119, and anti-7/4; Stem Cell Technologies) on ice for 30 minutes and, after washing, incubated with dense particles on ice for 20 minutes. The cells were layered on density medium, centrifuged at 1200 × g for 10 minutes, and the layer of cells at the density medium/PBS interface was collected, washed and counted.
Enriched bone marrow cells were seeded on tissue culture treated plates at a density of 0.1 × 10⁶ cells/cm2 in murine Mesencult media (Stem Cell Technologies) with 100 units/ml penicillin, 100 μg/ml streptomycin and 0.25 μg/ml amphotericin B added. The media was changed after 48 hrs and adherent cells were maintained in culture with twice weekly media changes. After 4 weeks the confluent cells were detached with trypsin and split 3:1. Lin- MSC were characterized for surface antigens using flow cytometry. Antibodies were obtained from BD Pharmigen unless otherwise noted. Cultured cells were detached with trypsin and incubated with1 μl mouse Fc block (1:50 dilution; clone 2.4G2, rat anti-mouse CD16/CD32) for 5 min on ice. Cells were then incubated with 1 μl fluorescent-conjugated antibodies (1:50 dilution) for 1 hr on ice, washed and analyzed.
The following mouse monoclonal antibodies were used: anti-CD45-Cy5 (clone 30-F11), anti-Sca1-PE (clone E13-161.7), anti-Sca1-Cy5 (clone D7; eBioscience), anti-CD34-PE (clone RAM34), anti-CD90.1-PE (clone HIS51), anti-CD117(cKit)-PE (clone 2B8), anti-CD105-biotin (clone MJ7/18; eBioscience) and anti-CD184-biotin (clone 2B11/CXCR4). Those treated with biotinylated antibodies were washed and incubated 20 minutes at room temperature with 1 μl streptavidin-PE or streptavidin-Cy5. Control samples were treated with immunoglobulin of the appropriate isotype. Cells were analyzed in a (FACS) Calibur flow cytometer or in a Beckman Coulter FC500 equipped with one (Calibur) or two lasers (Beckman) for multiparametric and multicolor analysis, including a 488 nm argon laser for measurement of forward light scatter (FSC) and orthogonal scatter (SSC), and three to five colors.
2.3 BM-MSC Cardiomyocyte Differentiation
BM-MSCs were plated (BD Falcon slides 354112 and Bioptech T-dish 0420041500B) at a density of 8000 cells per well for early passage cells (EP: P0-P2). All intermediate passages (IP: P8-P12) and late passage (LP: P20 and above) cells were plated at a density of 3000 cells per well (4 cm2). Cells were allowed to attach to the plate by culturing them for 24 hours in Mesencult with supplements. After adhering, cells were treated with one of five differentiating media for 19-21 days, (Figure S1). AZA treated cells were cultured with 1.2 μM AZA in Eagle's MEM with 2% FBS for 72 h (Sigma: 5-azacytidine, A2385, MEM, M0643 with 2.2 g sodium bicarbonate Invitrogen: Certified Fetal Bovine Serum 16000-044). Low serum (LS) treated cells were cultured in Eagle's MEM with 2% FBS for 72 h. Cells were also treated for 72 h with AZA alone and AZA with 5% serum. After 72 h, the media in the four AZA and/or LS groups was replaced every two to three days using MEM with 5% FBS and 5 μg/ml of Insulin and Transferrin, 5 ng/ml of sodium selenite (Sigma: ITS, I1884 prepared as recommended). A fifth group of cells was treated with MEM and 5% FBS for the entire 19-21 days.
2.4 CD117/Sca-1 FACS Analysis and Enrichment
Following the differentiation period, cells were detached with 0.25% trypsin and incubated in FACS buffer (PBS with 2 mM EDTA and 0.25% BSA) with 1 μl anti-mouse IgG (Sigma: M0284, Fc block, 1:50 dilution) for 5 min on ice. Cells were then incubated with 1 μl fluorescent-conjugated antibodies for Sca-1 (Bioscience: PE-Cy5 Ly-6A/E 155981-81) and CD117 (BD Pharmingen: PE anti-mouse CD117 clone 2B8) for 1 hr on ice, washed and analyzed. EP, IP, and LP cells were analyzed for the presence of CD117 and Sca-1 and their results are shown in Figure S2 A, B, and C respectively. Although EP cells exhibited the highest percentage of CD117/Sca-1+ cells compared to IP and LP in our initial FACS analysis, we were unable to maintain them as adherent cells in culture and therefore unable to assess the potential of enriched cells from EP to differentiate and express cTnT. LP cells although adherent after differentiation, were negative for CD117/Sca-1. Thus we focused on the IP cell cultures which were both adherent and contained sufficient CD117/Sca-1+ cells to assess the potential for myogenic development. IP cells at P8 were analyzed and enriched for CD117 and Sca-1 and cultured in Mesencult with supplements. The expanded enriched cells (P10) were analyzed a second time for the presence of CD117 and Sca-1 at the time of differentiation and their FACS results are shown in Figure S2 D.
2.5 Immunofluorescent Staining
Differentiated cells were stained for cardiac specific Troponin T, cardiac isoform Ab-1, (cTnT; Thermo Scientific MS-295-P0). The cells were fixed with 2% paraformaldehyde for 20 minutes. We used horse serum (5%) diluted in 0.1% Tween in PBS for blocking and permeabilization for 45 minutes. Additional blocking with Avidin and Biotin agents (Vector Labs, SP2001) was performed for 15 minutes each. The primary cTnT was mixed with ready to use ultra Ab diluent (Thermo Scientific, TA-125-UD) in a ratio of 1:200) and incubated over-night at 4°C. Biotinylated horse anti-mouse IgG (Vector Labs BA-2001) was used as the secondary (1 hr at RT, 1:250) and streptavidin Alexa Fluor 555 or 633 conjugate (Invitrogen: S21381, S21375,1:1000) was used for fluorescent detection (15 min at room temp). After washing, cells were mounted with DAPI (Vector Laboratories, Inc). For the isotype controls, we used IgG1 (R&D Systems: MAB 002, 1:200). For DHPR-α2 staining, we used the same procedure described above except that DHPR-α2 (ABR-Thermo Fisher: MA3-921, 1:300) was used as the primary antibody.
2.6 DHPR-α2 Enrichment of Differentiated Cells
After 26 days in culture, differentiated cells were lifted from the plate with enzyme-free dissociation buffer (Gibco: 1752). Cells were washed and re-suspended in a buffer mixture of 50% MEM and 50% FACS buffer. Cells were incubated for 90 min with the primary antibody (ABR-Thermo Fisher: mouse anti-DHPR-α2, MA3-921) at a concentration of 3 μl per 2 × 10⁶ cells and placed on ice. Cells were washed with the MEM buffer mixture and incubated for 1hr with the secondary antibody (goat anti-mouse-IgG1 Cy5, Jackson Immuno Research, PA No115-175-205) at a concentration of 3μl per 2 × 10⁶ cells on ice. Cells were washed, re-suspended, filtered (70 μm), and FACS selected for DHPR-α2 positive cells. DHPR-α2 enriched cells were plated at the same density as the originally differentiated cells (3000 cells per cm2) and cultured for an additional 30 days. In a separate experiment we added two control groups, one in which we left the differentiated cells in culture for a total of 56 days and a second in which we lifted the cells at Day 26 and re-plated (3000 cells per cm2) them for an additional 30 days. Thus we could examine the effects of both length of time in culture and lifting/replating the cells on cTnT expression.
2.7 Intracellular Calcium (Ca2+) measurements
Differentiated cells plated in 0.17mm thick Bioptechs Delta T dishes and incubated with MEM and 5% FBS media and a calcium sensitive dye (Fluo-4/AM, Invitrogen: F1420, 5 μM). The dye was prepared by dissolving 50 μg of fluo-4/AM in 50 μl of DMSO, and 50 μl of 20% Pluronic F-127 and 400 μl of Tyrode's salt solution [16] (Sigma: T2145, with 1 g of sodium bicarbonate and pH set to 7.4 for 15 min at room temperature). Thereafter, cells were washed and incubated with new MEM media and allowed to rest for 15 min for de-esterification of the dye. For viewing, the media was replaced with Tyrode's salt solution. Calcium cycling cells were identified and selected for line scan analysis (Zeiss LSM 510). The sampling time of the scan was between 3.7 ms and 7.8 ms per line depending on the cycling rate of the selected cell. Fluo-4/AM was excited at 488 nm and the emission was collected above 515 nm. The parameters extracted from the generated curves were: (1) Ca2+ transient frequency in (Hz); (2) Ca2+ transient duration at 50% amplitude in ms, TD50; (3) Ca2+ transient duration at 90% amplitude in ms, TD90.
2.8 cTnT Positive Cell Count and Morphology
For positive cTnT cell count, fields of view within a slide were randomly selected throughout the slide where cells were present. Nucleus (DAPI staining) and cTnT (Alexa Fluor 555) images were taken for each field with a Sony camera (DSC-H9). All images were originally stored in bit map format and filtered utilizing ImageJ (NIH.gov) for cell counting. The percentage of cTnT positive cells was obtained after comparing the number of positive cells with the number of nucleus in a field.
For area measurements, fields of view were randomly selected throughout the slide where cTnT positive cells were present. Nuclei (DAPI staining) and cTnT (Alexa Fluor 633) images were taken for each field with a Zeiss confocal microscope with the cTnT color set to green. Only cells aligned with the surface of the focal plane (those having a defined nucleus) were measured. We used the analyze particles tool from ImageJ, (NIH software) to measure the cell area. The average areas and the standard deviations at each of the time points measured were divided by the average area of cells at Day 5 to compare cell area growth.
2.9 RT-PCR and cDNA Sequencing
Total RNA was obtained from IP CD117/Sca-1 enriched cells differentiated in 2% FBS at Days 5, 15, 20 and 26 and adult cardiac tissue using the Trizol® reagent (Gibco: No 15596) protocol for suspended cells (BM-MSC) and tissue protocol for the adult heart. The RNA eluate was reverse-transcribed using 5 μl of RNA and 200U of M-MLV RT reverse transcriptase and random hexamers (Invitrogen: No 8080127). PCR was performed with Taq DNA Polymerase (Fermentas: No. EP0402) and gene specific primers 18 to 27 nucleotides in length. The total PCR volume was 50 μl, with 1 μl of the amplified cDNA, 1× PCR buffer, 0.2mM of dNTP, 2 mM of MgCl2, 2.5 units of Taq DNA polymerase and 0.4 μM of primer (see sequences below). PCR products were size-fractionated by 2% agarose gel electrophoresis. The primer sequences were: for DHPR-α2 (forward) GGC CGG ATC CGC AAT TGA TCC TAA TGG and (reverse) GAA GGC TGC AGA TCAT TGC AGT ATTC; for cTnT (forward) TGC ACT TTG GAG GGT ACATC and (reverse) GTC TTC ATT CAG GTG GTC GA; for cTnI (forward) GCT CCT CTG CCA ACT ACCGA and (reverse) CAA CGA GTC CTCA GAA CGCG; for GATA-4 (forward) GAA CCT GAA TAA ATC TAA GACGC and (reverse) TCT GAG TGA CAG GAG ATG CATA: GAPDH (forward) TAT GAC AAT GAA TAC GGCT and (reverse) CTC CTG TTA TTA TGG GGG.
2.10 Fluo4/AM-loaded BM-MSCs in the Presence of Nifedipine and Cadmium
DHPR-α2 enriched cells were loaded with Fluo-4/AM and incubated with Tyrode's salt solution. Initial video recordings of Ca2+ cycling were taken while the cells were in Tyrode's salt and electrically stimulated with a 5 ms pulse at 80V and a frequency of 1.0 Hz. After 10 seconds, 40 μM nifedipine (Sigma: No. 7624) dissolved in Tyrode's solution was applied drop wise while removing the original Tyrode's with a peristaltic pump. The video recorded continuously during the test; however, the light source was periodically removed to reduce fluorescence bleaching. Similarly, confocal line scans of selected calcium cycling cells were taken (166 samples per second) at different time periods during the nifedipine application. The transient amplitude TA [(ΔF=Fmax-Fmin)/F0] was calculated, where F is the amplitude value after background subtraction and F0 is the minimum value of the first calcium cycle. An additional video recording was made of DHPR-α2 enriched cells previously loaded with Fluo-4/AM after application of 100 μM CdCl2 (Fisher Scientific: C9-100) dissolved in Tyrode's salt solution.
2.11 Statistical Data Analysis
Values are presented as means ± SEM and n is the number of experiments. The significant differences between groups were evaluated using SigmaStat (Systat Software Inc.). Groups with unequal variances were analyzed using the Kruskal-Wallis Test, and post-hoc multiple comparisons between groups were performed with Dunn's method. For experiments where only two sets of data were compared, we used the Mann-Whitney Rank Sum Test method. A result of p<0.05 was considered statistically significant.
3 Results
3.1 BM-MSC Flow Cytometry and Passage Selection
In preparation for our experiments, MSC were analyzed by flow cytometry for the presence of various surface antigens after negative lineage selection and following two different passages in culture. Negative selection for the lineage markers CD5, CD45R, CD11b, Gr-1, TER119, and 7/4 resulted in a cell population containing CD34 (3%), CD 90.1 (34%), CD105 (23%), CD117 (43%) and Sca-1 (21%). Passage 4 Lin- adherent BM-MSC exhibited an increased Sca-1 and CD105 population (91% and 60%, respectively) while CD34, CD90.1, and CD117 positive cells were low. Passage 17 BM-MSC continued to be strongly Sca-1 positive but CD117 low. There was a dramatic increase in CD34 by passage 17 so that 80% of the cells were positive for this antigen. These data confirm the changing characteristics of MSC in culture and further underscore the importance of FACS analysis and enrichment for specific cell surface receptors prior to beginning interventions with these cells. Previous studies have shown that a small percentage of BM-MSC differentiate into cardiac-like cells. Thus we set up a series of experiments aimed at increasing the cTnT positive cell percentage by evaluating culture milieu and enrichment for specific cell markers in IP cells before differentiation. In the first series of experiments, we determined whether BM-MSC passage selection would influence the expression of cTnT in cells when subjected to myogenic differentiation. Three Lin- BM-MSC passages were used: Early passage (EP: P0-P2), intermediate passage (IP: P8-12), and late passage (LP: P20) utilizing AZA or LS treatment. EP cells were very slow to proliferate, and the few cells that remained attached were cTnT- after three weeks of AZA or LS differentiation treatment. Differentiating IP cells were cTnT+ within three weeks of treatment (AZA: 14 ± 1%, LS: 12 ± 2%, n= 53 and 46 respectively) while LP cells were cTnT- over the three week period of AZA or LS treatment. Figure S3 A, B, and C illustrate cTnT staining results of EP, IP and LP cells after LS differentiation treatment.
Since it has been demonstrated that Sca-1+ cells possess stem-progenitor properties [17, 18] and that CD117+ cells have the potential to differentiate into a cardiac lineage [12], we used FACS analysis to evaluate the amount of CD117/Sca-1 initially present on EP, IP, and LP. The results indicated that approximately 10% of EP cells were positive for CD117/Sca-1, whereas IPs exhibited approximately 1% of CD117/Sca-1+, and LPs only 0.01% of CD117/Sca-1+ cells, Figure S2 A, B, and C show the FACS results of EP, IP, and LP respectively.
3.2 CD117/Sca-1 Enrichment and Differentiation Media
In our second series of experiments, we enriched both EP and IP cells for CD117/Sca-1. EP cells were not adherent following enrichment. Although our FACS results indicated that EP cells have the highest number of CD117/Sca-1+ cells, their differentiation might be attenuated due to their low proliferation rate and attachment. To further evaluate the differentiation potential of murine BM-MSC, we therefore focused on the IP cells in the remaining series of experiments.
To improve the percentage of cTnT positive cells we enriched IP cells for CD117/Sca-1 and used the five differentiation conditions described in the Methods section (see also Figure S1). IP Lin- BM-MSC were enriched for CD117/Sca-1 at passage 8, seeded and then cultured with differentiation media until passage 10. By passage 10, these cells were 40% CD117+ and 99% Sca-1+ as shown in supplemental Figure S2 D and E. IP CD117/Sca-1+ cells and IP control (non-enriched) cells were cultured for differentiation for up to 21 days in different combinations of AZA or LS. Figure 1 provides a summary of the overall series of experiments performed based on cell passage and enrichment for CD117/Sca-1. Cell counts of microscopic fields of these differentiated cells revealed that the enriched cells had 39 ± 3 % and 28 ± 2% cTnT positive expression compared to the non-enriched control cells which had 14 ± 1% and 12 ± 2% after treatment with AZA and LS, respectively as shown in Figure 2. A magnification of IP cTnT+ cell staining is shown in Figure S4. Separately, IP CD117/Sca-1+ cells that were treated with control culture medium (MEM and 5% FBS) only exhibited 18% ± 3% cTnT positive cells, significantly less than in AZA or LS treated cultures, (see Figure S5). These results support the hypothesis that CD117/Sca-1 enrichment of murine BM-MSC increases their differentiation potential in specific media. The percent of cTnT+ cells in the AZA + 0% and 5% FBS groups were expressed as a ratio of the AZA + 2% FBS group used in our experiments. There was no difference between AZA with 0% FBS and AZA with 2% FBS. AZA with 5% FBS had a significantly lower ratio of cTnT+ cells compared to the AZA + 2% FBS group (Figure S6). Thus, we concluded AZA did not significantly improve cTnT expression compared to 2% FBS alone but that serum levels above 2% in the differentiating media significantly decreased the expression of cTnT.
Figure 1.
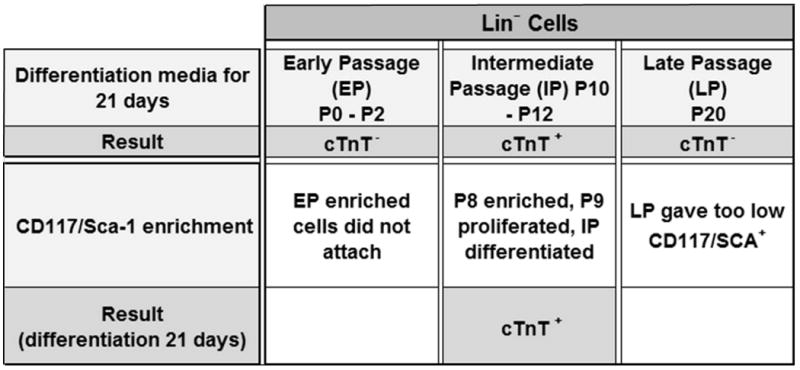
Description of first and second series of differentiation experiments: In the first experiment (EXP1) only IP cells expressed cTnT. In the second experiment (EXP2) following CD117/Sca-1 enrichment, EP cells did not adhere and LP cells contained negligible CD117/Sca-1+ cells. Only IP cells were adherent and contained CD117/Sca-1+ cells and thus were used for the remaining experiments.
Figure 2.
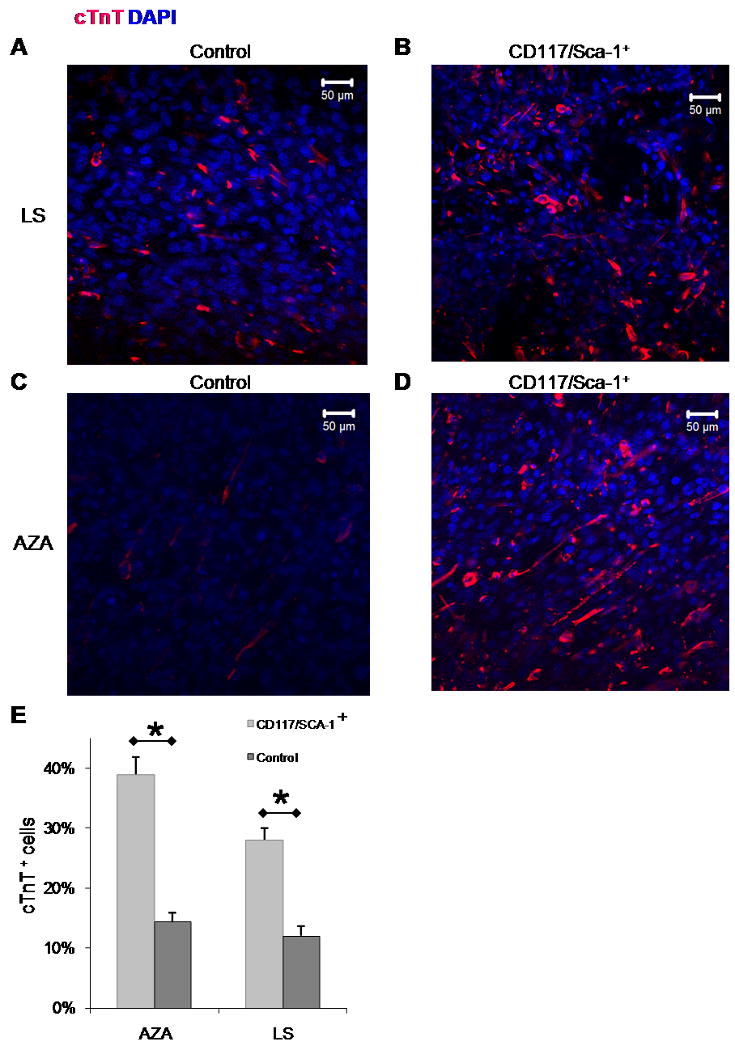
Immunofluorescence from cTnT stained IP CD117/Sca-1 enriched cells compared to IP unenriched (control) cells cultured for up to 21 days: A. cTnT staining of control cells treated with LS. B. cTnT staining of CD117/Sca-1+ cells treated with LS. C. cTnT staining of control cells treated with AZA. D. cTnT staining of CD117/Sca-1+ cells treated with AZA. E. Mean cTnT positive cells for enriched and control fractions cultured in AZA or LS. The number of sampled fields, n, from left to right was 31, 53, 33, and 46 respectively. Values represent mean ± SEM, and significant differences (*) are P<0.05. There was no significant difference between the two enriched groups treated with AZA or LS.
3.3 Temporal Changes in Expression of cTnT and BM-MSC Morphology
To determine how differentiated BM-MSC change in size over time, we fixed IP CD117/Sca-1+ cells differentiated in LS at different intervals of time in culture. Figure 3 A-D illustrates representative immunofluorescent images of cTnT staining observed on Day 5, Day 9, Day 15, and Day 21 respectively. Figure 3 E shows the area growth of the cTnT positive cells relative to Day 5. It can be seen that there was near zero increase in the area growth of the cells between Day 5 and Day 15; however, there was a 1.83 ± 0.21 fold increase in the cell area between Day 15 and Day 21. These results suggest that the maturation process of differentiated cTnT+ cells includes a period of cell area expansion after 15 days in culture.
Figure 3.
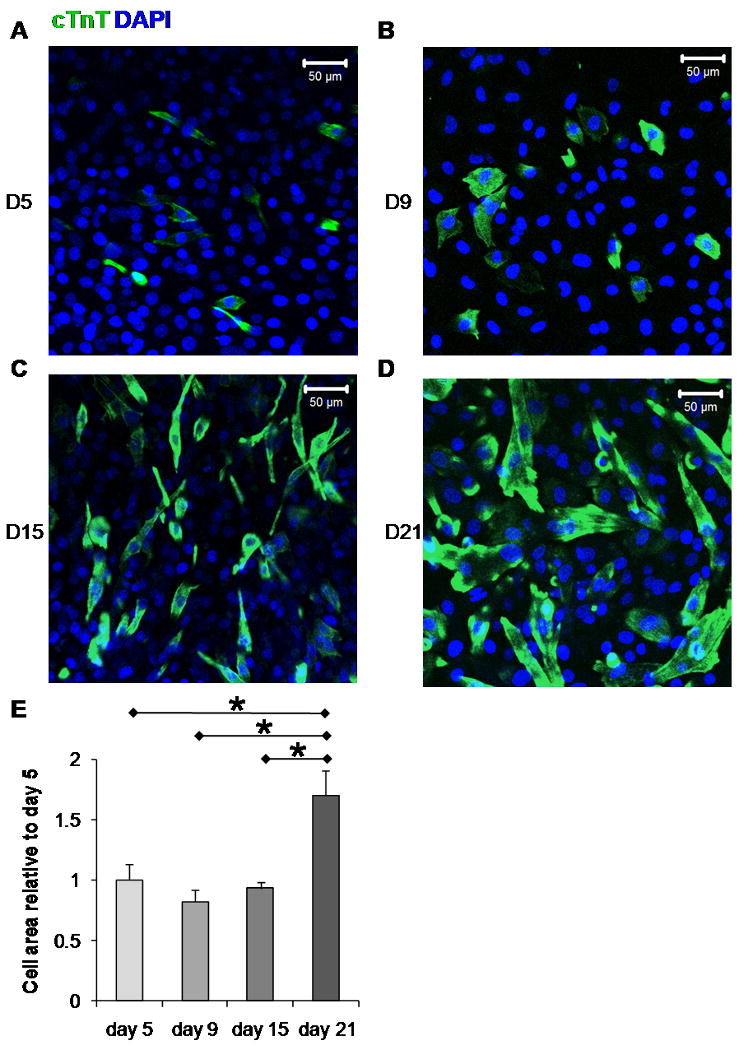
Temporal expression of cTnT and changes in BM-MSC Morphology: Representative immunofluorescent images of cTnT staining observed in IP CD117/Sca-1 enriched cells following differentiation treatment in LS. A. Day 5, B. Day 9, C. Day 15, D. Day 21. E. cTnT+ cells area relative to Day 5. The average number of fields and the number of cells imaged per field was (10, 17), (6, 20), (3, 33), (4, 41) for Day 5, 9, 15, and 21 respectively.
3.4 Temporal Changes in Intracellular Ca2+ Transients
It has been previously reported that differentiating stem cell derived cardiomyocytes early on exhibit spontaneous oscillations in their intracellular Ca2+ concentration [16]. To determine if LS differentiated IP CD117/Sca-1+ cells exhibited the same properties, we monitored the cells [Ca2+]i with laser scanning confocal microscopy. By Day 12, cells exhibited intermittent transients with short durations (see Figure S8) whereas by Day 14, the recorded transients were consistent in rhythm and duration. We chose Day 14 as our baseline and recorded confocal line scans again at Day 19 and 29 of differentiation and evaluated their characteristics to determine temporal changes in the intracellular Ca2+ transients. Figure 4 A and B show representative line scans at Day 14 and Day 29. Analyses of spontaneous intracellular Ca2+ transients show a decrease in the transient duration at 50% amplitude (TD50) over time. Figure 4 C shows that the average TD50 was 1.17 ± 0.11 s by Day 14 compared to 0.66 ± 0.08 s by Day 19 and 0.46 ± 0.02 s by Day 29. Similarly, Figure 4 D shows that there was a decrease in transient duration at 90% (TD90) for the same time periods; the average TD90 was 2.12 ± 0.24 s, 1.15 ± 0.12 s, and 0.86 ± 0.04 s for Day 14, 19 and 29 respectively. Conversely, Figure 4 E shows that there was an increase in the average Ca2+ transient frequency resulting in 0.62 ± 0.08 Hz, 1.08 ± 0.12 Hz, and 1.14 ± 0.06 Hz for Day 14, 19 and 29, respectively. The number of cells and the corresponding cycles analyzed were (10, 42), (7, 27), and (9, 76) for Days 14, 19, and 29 respectively.
Figure 4.
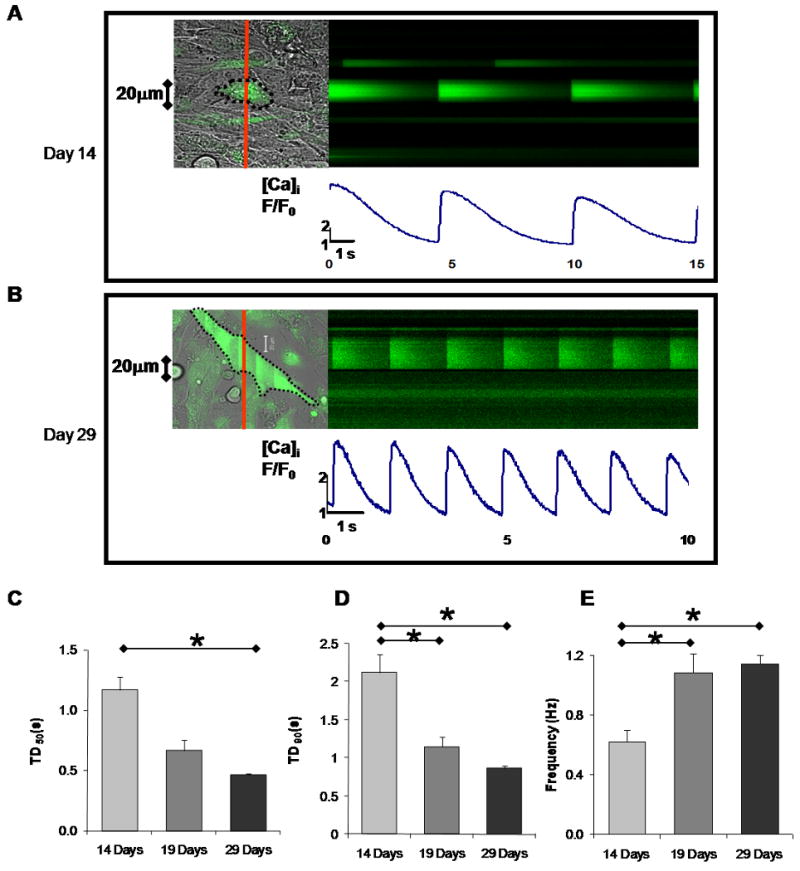
Confocal line scan images of IP CD117/Sca-1+ cells loaded with Fluo-4/AM showing spontaneous intracellular Ca2+ transients: A. Representative Ca2+ cycling by Day 14 of culture. B. Representative Ca2+ cycling by Day 29. See also supplemental Video-1. C-E. Intracellular Ca2+ transients of spontaneously cycling cells at Day 14, 19, and 29 in LS differentiating media: (C) Transient duration at 50% amplitude (TD50). (D) Transient duration at 90% amplitude (TD90). (E) Mean Ca2+ transient frequency. The number of cells and the corresponding cycles analyzed were (10, 42), (7, 27), and (9, 76) for days 14, 19, and 29 respectively. Values represent mean + SEM and significant differences (*) are p<0.05.
Cells used for line scan Ca2+ transient measurements were fixed and stained for cTnT and when possible the same cell was identified on the slide for both measurements. Figure 5 shows an example of a cell with spontaneous Ca2+ transients stained positive for cTnT. These data support the hypothesis that spontaneous Ca2+ oscillations originate from cells exhibiting a cardiac lineage.
Figure 5.
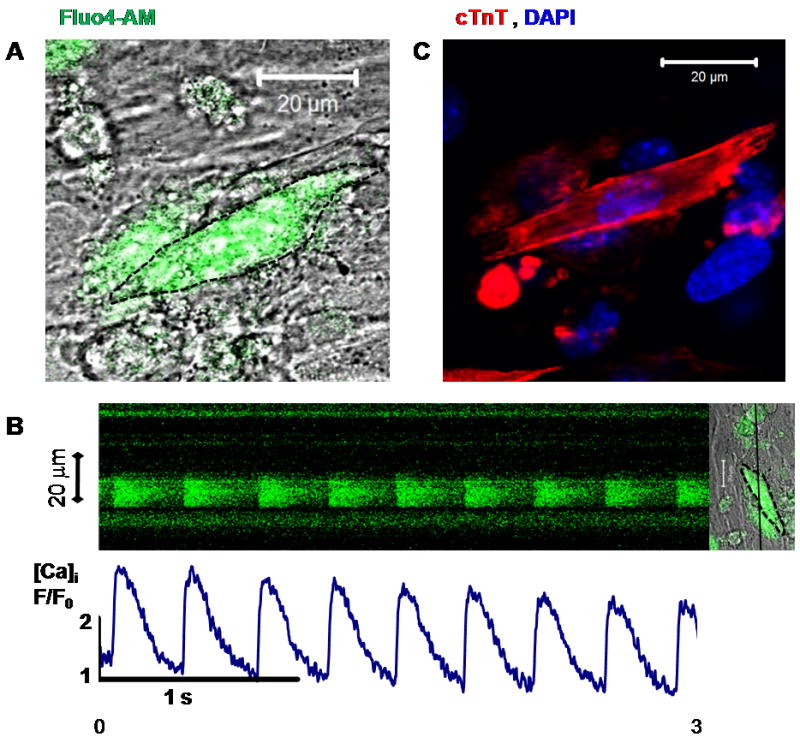
IP CD117/Sca-1+ cell differentiated with LS for 26 days: A. Fluo-4 AM loaded cell. B. Line scan of intracellular Ca2+ transient of cell on (A) showing spontaneous changes in [Ca]i. C. After fixation and staining, cell on (A) was indentified on the plate and verified to be cTnT+.
3.5 cTnT Expression is Enhanced after DHPR-α2 enrichment
DHPR-α2 is a membrane protein present in cardiac as well as skeletal and neuronal cells. The expression of L-type Ca2+ channels is an early event in the development of cardiac myocytes [19]. To further increase the number of cTnT positive cells in our in vitro differentiation studies, we proposed to include a DHPR-α2 positive selection step as a second enrichment process, thus eliminating most non-myogenic cells. This step was performed at Day 26, after the cells had differentiated into a cardiac muscle lineage (cTnT positive). Figure 6 A illustrates the PCR results of the IP CD117/Sca-1 enriched cells during differentiation. These data demonstrate that amplicons for several cardiac specific and developmental genes are observed during the early stage of differentiation. DHPR-α2 is also observed during differentiation and suggests that this transmembrane subunit of the L-type calcium channel is expressed commensurate with the cardiac-specific genes. We noted that there was a doublet amplicon for the DHPR-α2 subunit in our RT-PCR analysis. The primers used for the PCR did not distinguish between cardiac and skeletal muscle forms of the subunit suggesting that myogenic development for both skeletal and cardiac muscle probably occurred in our cultures. Figure 6 B shows the results of DHPR-α2 staining of CD117/Sca-1+ cells after 20 days in differentiating media and B shows the DHPR-α2 FACS analysis of CD117/Sca-1 enriched cells for the same time period. After having sorted the differentiated cells described in Figure 6 C, the cells were re-plated and cultured in MEM with 5%FBS and ITS, the sorted cells recovered and easily adhered to the plate within the first 24 hrs.
Figure 6.
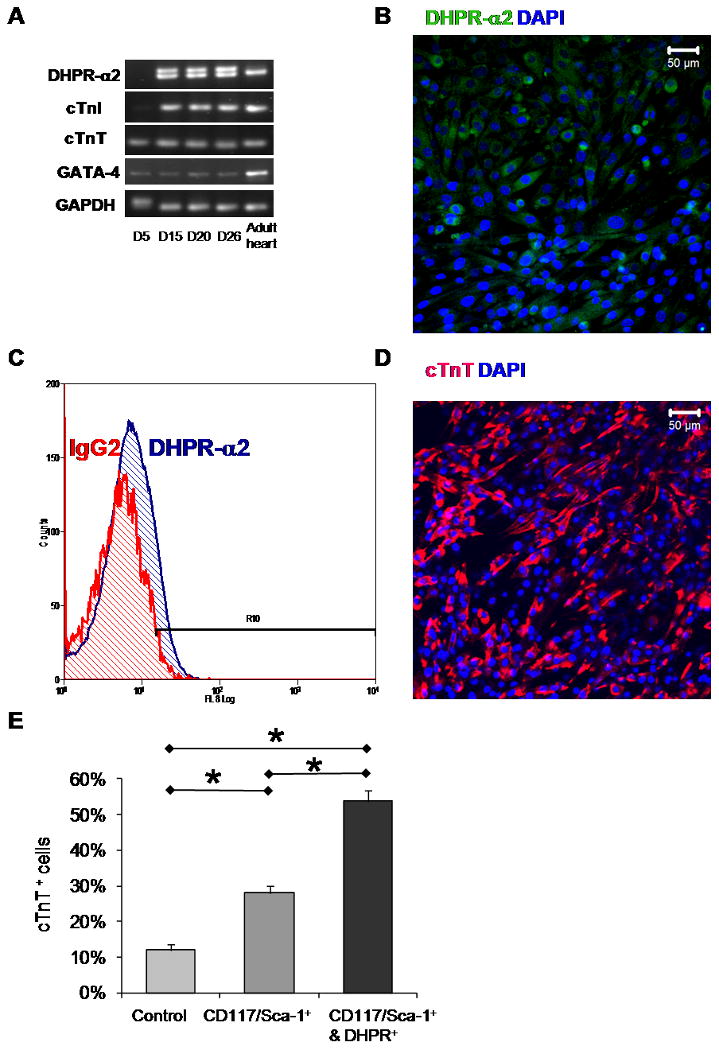
DHPR-α2 enrichment increased the percent of cTnT+ cells in LS differentiating media: A. RT-PCR analysis for gene expression evaluation of DHPR-α2, cTnT, cTnI, GATA-4, and GAPDH of IP cells differentiated after day 5, day 15, day 20 and day 26 respectively. An adult heart was used for positive control. B. DHPR-α2 staining of CD117/Sca-1+ enriched cells after 20 days in differentiating media. C. DHPR-α2 flow cytometry analysis of CD117/Sca-1+ enriched cells after 26 days in differentiating media. D. Representative immunofluorescent image of cTnT staining of IP CD117/Sca-1 and DHPR-α2 enriched cells. E. Mean cTnT positive cells 30 days after DHPR-α2 enrichment (n=45) compared to control (n=46) and CD117/Sca-1+ (n=33) cells. Values represent Mean + SEM, and significant differences (*) are P<0.05.
These DHPR-α2 enriched cells were cultured for an additional 30 days and fixed for immunofluorescent cTnT staining (Figure 6 D). Cell counts show that there was a significant increase in the percent of cTnT positive cells 54 ± 3 % (n=45) for the DHPR-α2 enriched compared to 28 ± 2% (n=33) in the CD117/Sca-1 enriched and 12 ± 2% (n=46) in the control cells shown in Figure 6 E. Our control experiments (Figure S7) show that if differentiated cells with 2% FBS are kept in culture for 56 days, or if they are lifted at Day 26 and re-plated for an additional 30 days the level of cTnT expression is unchanged but is still significantly lower than the cTnT expression observed in DHPR-α2 enriched cells.
We observed spontaneous Ca2+ oscillations in the DHPR-α2+ cells and were able to identify spontaneously Ca2+ transients in cTnT positive cells. It is interesting to note that we were able to observe spontaneous synchronized cycling and movement on some DHPR-α2 cultured plates 30 days after seeding. Supplemental Video-1 shows a group of differentiated DHPR-α2 enriched cells in motion and spontaneously cycling Ca2+ and Figure S10 shows positive cTnT staining of the same moving cells. In addition, Video-2 shows another group of differentiated DHPR-α2 enriched cells in motion after stimulated with a 1 ms pulse of 80 V after 30 days in LS culture (for viewing purposes the video speed was increased compared to actual time).
3.6 Intracellular Ca2+ Transients in DHPR-α2 enriched Cells
The L-type Ca2+ channel is activated by depolarizing voltage change during the upstroke of the cardiac action potential. To determine if the DHPR-α2 enrichment process and the re-plating affected the functional performance of the cells, we measured their intracellular Ca2+ transients 30 days after the enrichment. Cells exhibited Ca2+ transients upon field stimulation supporting the hypothesis that the DHPR-α2 enriched cells are electrically excitable cells. We compared the spontaneous Ca2+ transients previously recorded to frequency matched stimulated Ca2+ transients. Figure 7 shows the results of the statistical analysis of spontaneous and stimulated intracellular Ca2+ transients of CD117/Sca-1 and DHPR-α2s enriched cells after differentiation in LS and cultured for 30 days in MEM + 5%FBS and ITS media. The average TD50 was 0.57 ± 0.05 s for the spontaneously cycling cells and 0.43 ± 0.02 s for the stimulated cells. The average TD90 was 0.99 ± 0.09 s and 0.72 ± 0.03 s for the spontaneous and stimulated cells respectively. The average TA (ΔF/F0) was 3.44 ± 0.4 and 2.84 ± 0.3 for spontaneous and stimulated cells respectively. Ca2+ transient examples are given in supplemental Figure S9. Overall the Ca2+ transient duration compares well with those described for embryonic mouse cardiomyocytes [16]. Fluo-4/AM-loaded DHPR-α2 enriched BM-MSCs were also electrically stimulated in culture and sequentially incubated with either 40 μm nifedipine to specifically block the L-type Ca2+ channel or 100 μm cadmium to block calcium entry via both the L-type and T-type Ca2+channels. Our data demonstrate (Figure 8 and supplemental Video-3) that some of the differentiated and enriched cells were sensitive to the addition of nifedipine suggesting that BM-MSCs did develop functional L-type calcium channels while transients in other cells persisted. When exposed to cadmium, all fluo-4/AM generated calcium transients were abolished (Supplemental Video-4).
Figure 7.
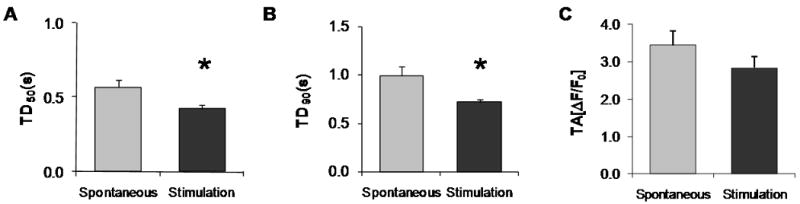
Intracellular Ca2+ transients of spontaneously cycling and stimulated cells after CD117/Sca-1 and DHPR-α2 enrichment in LS differentiating media. A. Transient duration at 50% amplitude (TD50). B. Transient duration at 90% amplitude (TD90). C. Mean transient amplitude (TA, ΔF/F0). Values represent Mean ± SEM and significant differences (*) are p<0.05. The number of cells and the corresponding cycles analyzed were (6, 32), and (5, 26). Refer to supplemental data for representative Ca2+ transient examples.
Figure 8.
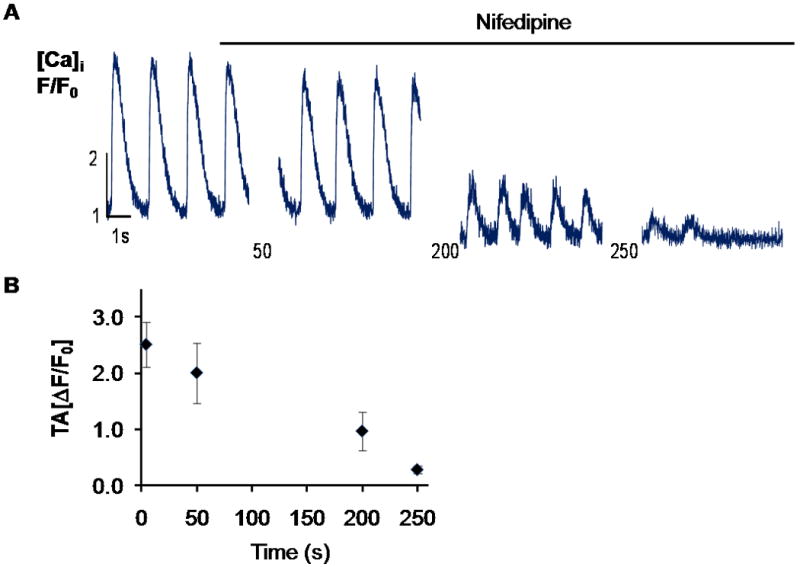
Nifedipine inhibition of Ca2+ transients. A. Representative line scan of one cell from CD117/Sca-1 and DHPR-α2 enriched cells in differentiating media after application of 40 μM nifedipine. Cells were continuously stimulated with 0.7 Hz, 80V, 5ms electrical pulse. B. Mean transient amplitude (TA, ΔF/F0) at sequential time points following application of nifedipine. Values represent Mean + SEM, n=3 cells. Supplemental Video-3 demonstrates that not all calcium transients were inhibited by the L-type calcium channel blocker.
4 Discussion
We have demonstrated that cardiomyogenesis in adherent bone marrow derived Lin- cells is greatly enhanced when differentiation is initiated in intermediate passage cells (P8-P12) in low serum following enrichment for the stem cell markers CD117/Sca-1. The percent of cells expressing cardiac specific TnT was significantly elevated compared to those previously reported for bone marrow derived mesenchymal cells [20]. Most strikingly, a large number of these myogenic cells also displayed spontaneous calcium transients by Day 12 in culture and reduced transient amplitude durations between Days 14 and 29. This temporal change in calcium transients also correlated with the most significant changes in cell morphology (between Days 15 and 21 in culture). CD117/Sca-1+ cells cultured in differentiating media also expressed DHPR-α2 by Day 15. When these cells were further enriched for DHPR-α2 and re-seeded for an additional 30 days in culture, the percent of cells expressing cTnT doubled compared to CD117/Sca-1+ BM-MSC enriched cells alone. We observed that the number of cTnT+ cells did not increase when we extended the time in culture for an additional 30 days without DHPR-α2 enrichment. Similarly, lifting and replating the cells for an additional 30 days in culture did not improve the expression of cTnT of CD117/Sca-1+ cells. Therefore, we conclude that further enrichment of cells for a muscle specific protein (DHPR-α2) establishes a culture of highly differentiated cells that are more likely to exhibit a myogenic lineage. Previous studies demonstrate that induction of the myogenic program can be initiated in bone marrow derived mesenchymal stem cells but this has been limited to changes in protein expression [6-9, 20-23] or studies in which expression of muscle specific proteins in MSC have been induced by TGF-β [6], Wnt-mediated signaling [20] and co-culturing with cardiac myocytes [10-13, 22].
The protocol in the present study included an enrichment step after Lin- BM-MSC were in culture for an extended period of time (P8-12). In contrast, enrichment for CD117/Sca-1+ at the time of bone marrow harvest results in a significant population of hematopoietic stem cells that have been shown to lack myogenic potential [24-26]. Furthermore, CD117 expression decreases over time and passage in culture [2, 6] due either to decreased expression of the receptor or loss of non-adherent cells with passage. We observed these same changes in both our EP and LP cells. EP cells did not adhere well to the culture plate containing our differentiation media and LP cells lost expression of CD117/Sca-1 over time. Thus we cannot conclude from our experiments that passage number has an effect on the potential for CD117/Sca-1+ cells to develop into a myogenic lineage.
Observations of differentiated cells revealed large growth areas with tubular-shaped cell formation and multi-nucleated cells together with large growth areas of non-myogenic cells. Thus after testing for the presence of DHPR-α2 in the differentiated cultures, we reasoned that further enrichment for DHPR-α2 protein might produce cultures with higher myogenic potential than CD117/Sca-1 enriched cells alone. This second enrichment step resulted in an increase in cTnT positive cells. We also noted that there was a doublet amplicon for the DHPR-α2 subunit in our RT-PCR analysis. The primers used for the PCR did not distinguish between cardiac and skeletal muscle forms of the subunit suggesting that myogenic development for both skeletal and cardiac muscle probably occurred in our cultures.
The presence of calcium channels and ionic currents in undifferentiated bone marrow mesenchymal stem cells has been previously reported [27, 28]. We were able to identify a nifedipine-sensitive isoform of the L-type Ca2+ channel in cells enriched for the CD117/Sca-1 cell surface markers and demonstrated that differentiated cells displayed spontaneous Ca2+ transients. This is the first observation, to our knowledge, in which differentiated BM-MSC displayed persistent and robust Ca2+ oscillations in a large percentage of BM-MSC cultured in the absence of cardiomyocytes or cardiomyocyte-conditioned media. Kawano et al., 2002 demonstrated that undifferentiated human mesenchymal stem cells displayed spontaneous Ca2+ oscillations but that the primary pathway of Ca2+ entry into the cell was from voltage-independent Ca2+ channels which are found in non-excitable cells.
We have demonstrated evidence of L-type Ca2+ channels, with our observations of DHPR-α2 in enriched and differentiated BM-MSC. Furthermore, our Ca2+ transients could be initiated by electrical stimulation in cells enriched for the channel protein (Figure S9). In addition, we have demonstrated that a population of our DHPR-α2 enriched cells has functional L-type Ca2+ channels because we were able to inhibit the Ca2+ transients with application of nifedipine, a specific L-type Ca2+ channel blocker. Taken together, these data suggest that Ca2+ entry into cells in the present study could have been directed by voltage-sensitive L-type Ca2+ channels, characteristic of cells undergoing myogenic differentiation.
One of the most striking findings in our study is that the frequency of the Ca2+ transients increased over time and that the transient amplitude duration of CD117/Sca-1 enriched cells decreased from 14 to 29 days in culture. Evidence from studies in embryonic-derived cardiomyocytes [16] and developing heart [19, 29] suggests that as the cardiomyocyte matures from neonatal to adult, Ca2+ entry, storage, and release is altered by synthesis and maturation of SR-Ca2+ release channels and voltage sensitive channels. The change in Ca2+ kinetics observed in our cells over time is consistent with the observed changes in the maturing cardiomyocyte.
In conclusion, we found that differentiating media containing low serum media was equally effective in inducing cTnT expression and spontaneous calcium transients compared to the DNA methyltransferase inhibitor, 5-azacytidine. In addition, cTnT expression and spontaneous calcium transients in BM-MSC were more prevalent in IP cells following CD117/Sca-1 enrichment compared to unenriched Lin- cells and variability in the calcium transients decreased as length of time in differentiating media increased. The increase in spontaneous calcium cycling frequency, decrease in transient duration with time, and identification of enriched cells with functional L-type Ca2+ channels suggests a progressive maturation of the calcium regulatory mechanisms of the cell and thus greater myogenic development. Taken together, these data demonstrate that specific cell enrichment steps and early cardiac lineage development in culture may improve the potential of BM-MSC for regenerative therapy.
Supplementary Material
Five independent differentiating media treatments: Cells were seeded in Mesencult plus supplements (StemCell Technologies) on the first day and differentiation started the following day. Groups of cells were treated with or without AZA (1.2 μM in Eagles MEM) and with different concentrations of FBS for 72 h. Thereafter, the cells were cultured in MEM with 5% FBS and ITS. A control group of cells was subjected to MEM and 5% FBS only.
FACS data for EP, IP, LP and IP enriched cells: A. EP cell total cell count was 300.5 × 10³, and on R10 were 29.1 × 10³. B. IP un-enriched cells total count was 355.7 × 10³, and on R10 were 4.4 × 10³ C. LP cell total cell count was 328.1 × 10³, and on R10 were 29. D. IP CD117/Sca-1+ enriched cells total count was 16.7 × 10³, and on R10 were 6.7 × 10³. E. FACS results of the percentages of CD117, Sca-1, and CD117/Sca-1 in EP, IP, LP, and IP enriched cells.
cTnT staining results after 21 days in LS differentiation media (EP plates were initially seeded with 8000 cells per well, IP and LP plates were seeded with 3000 cells per well). A. early passage cells; B. intermediate passage cells; C. late passage cells
Magnification of cTnT staining of IP CD117/Sca-1+ cells differentiated after 21 days in LS (top) and AZA (bottom). All lines are 20 μm long.
A. cTnT staining of IP CD117/SCA-1+ cells differentiated in MEM with 5% FBS. B. Comparison of cTnT positive results for IP-enriched cells differentiated in AZA, LS, and MEM. Values represent mean ± SEM, and significant differences (*) are P<0.05. The number of sampled fields from left to right was 31, 33, and 28 respectively.
cTnT+ comparison of IP CD117/SCA-1+ cells differentiated for 21 days in AZA with 0% 2%, and 5% FBS respectively. Values were normalized with respect to AZA+2%. Values represent mean + SEM, and significant differences (*) are P<0.05. The number of sampled fields from left to right was 38, 44, and 41 respectively.
A. cTnT+ cells comparison of IP CD117/SCA-1+ cells differentiated in MEM with 2% FBS after 56 days (D56), lifted after 26 days, replated (D56 replate) and cultured for an additional 30 days. Values represent mean + SEM, and significant differences (*) are P<0.05. The number of sampled fields from left to right was 39 and 40 respectively.
Intracellular Ca2+ transients at day 12 demonstrated variability in rhythm and amplitude.
Ca2+ transient of IP CD117/Sca-1 and DHPR enriched cells (30 days after the DHPR enrichment): A. Line scans of spontaneously cycling cell. B. Line scans of stimulated cell (stimulation: 1 Hz, 80V and 2ms duration pulse).
cTnT staining of cell group exhibiting spontaneous Ca2+ cycling and motion on supplemental Movie-1 file (30 days after the DHPR enrichment): A. Fluo-4 loaded cells. B. cTnT staining of the same group of cells. C. cTnT staining of the same group of cells at 23 μm above B in the Z-axis. Arrows indicate the presence of multiple cTnT positive cells within the moving group
Acknowledgments
The authors thank Nidhi Kapur for her initial assistance with the Fluo-4 AM Ca2+ transient measurements and Jose Carlos Lopez Dominguez for his assistance with statistical analysis of the data. This work was funded by the Illinois Department of Public Health (P.I. D.L. Geenen), NHLBI (R01 HL071046; P.I. D.L. Geenen), and MDA (P.I. J. García). Dr. Grajales is the recipient of a 2008 American Heart Association CVD Student Scholarship.
Footnotes
Publisher's Disclaimer: This is a PDF file of an unedited manuscript that has been accepted for publication. As a service to our customers we are providing this early version of the manuscript. The manuscript will undergo copyediting, typesetting, and review of the resulting proof before it is published in its final citable form. Please note that during the production process errors may be discovered which could affect the content, and all legal disclaimers that apply to the journal pertain.
References
- 1.Cimini M, Fazel S, Zhuo S, Xaymardan M, Fujii H, Weisel RD, et al. c-kit dysfunction impairs myocardial healing after infarction. Circulation. 2007;116(11 Suppl):I77–82. doi: 10.1161/CIRCULATIONAHA.107.708107. [DOI] [PubMed] [Google Scholar]
- 2.Li M, Naqvi N, Yahiro E, Liu K, Powell PC, Bradley WE, et al. c-kit is required for cardiomyocyte terminal differentiation. Circ Res. 2008;102(6):677–85. doi: 10.1161/CIRCRESAHA.107.161737. [DOI] [PMC free article] [PubMed] [Google Scholar]
- 3.Lutz M, Rosenberg M, Kiessling F, Eckstein V, Heger T, Krebs J, et al. Local injection of stem cell factor (SCF) improves myocardial homing of systemically delivered c-kit + bone marrow-derived stem cells. Cardiovasc Res. 2008;77(1):143–50. doi: 10.1093/cvr/cvm027. [DOI] [PubMed] [Google Scholar]
- 4.Okada S, Nakauchi H, Nagayoshi K, Nishikawa S, Miura Y, Suda T. In vivo and in vitro stem cell function of c-kit- and Sca-1-positive murine hematopoietic cells. Blood. 1992;80(12):3044–50. [PubMed] [Google Scholar]
- 5.Thoren LA, Liuba K, Bryder D, Nygren JM, Jensen CT, Qian H, et al. Kit regulates maintenance of quiescent hematopoietic stem cells. J Immunol. 2008;180(4):2045–53. doi: 10.4049/jimmunol.180.4.2045. [DOI] [PubMed] [Google Scholar]
- 6.Li TS, Komota T, Ohshima M, Qin SL, Kubo M, Ueda K, et al. TGF-beta induces the differentiation of bone marrow stem cells into immature cardiomyocytes. Biochem Biophys Res Commun. 2008;366(4):1074–80. doi: 10.1016/j.bbrc.2007.12.095. [DOI] [PubMed] [Google Scholar]
- 7.Hakuno D, Fukuda K, Makino S, Konishi F, Tomita Y, Manabe T, et al. Bone marrow-derived regenerated cardiomyocytes (CMG Cells) express functional adrenergic and muscarinic receptors. Circulation. 2002;105(3):380–6. doi: 10.1161/hc0302.102593. [DOI] [PubMed] [Google Scholar]
- 8.Makino S, Fukuda K, Miyoshi S, Konishi F, Kodama H, Pan J, et al. Cardiomyocytes can be generated from marrow stromal cells in vitro. J Clin Invest. 1999;103(5):697–705. doi: 10.1172/JCI5298. [DOI] [PMC free article] [PubMed] [Google Scholar]
- 9.Shiota M, Heike T, Haruyama M, Baba S, Tsuchiya A, Fujino H, et al. Isolation and characterization of bone marrow-derived mesenchymal progenitor cells with myogenic and neuronal properties. Exp Cell Res. 2007;313(5):1008–23. doi: 10.1016/j.yexcr.2006.12.017. [DOI] [PubMed] [Google Scholar]
- 10.Li Z, Gu TX, Zhang YH. Hepatocyte growth factor combined with insulin like growth factor-1 improves expression of GATA-4 in mesenchymal stem cells cocultured with cardiomyocytes. Chin Med J (Engl) 2008;121(4):336–40. [PubMed] [Google Scholar]
- 11.Muscari C, Bonafe F, Carboni M, Govoni M, Stanic I, Gamberini C, et al. Difluoromethylornithine stimulates early cardiac commitment of mesenchymal stem cells in a model of mixed culture with cardiomyocytes. J Cell Biochem. 2008;103(4):1046–52. doi: 10.1002/jcb.21683. [DOI] [PubMed] [Google Scholar]
- 12.Rota M, Kajstura J, Hosoda T, Bearzi C, Vitale S, Esposito G, et al. Bone marrow cells adopt the cardiomyogenic fate in vivo. Proc Natl Acad Sci U S A. 2007;104(45):17783–8. doi: 10.1073/pnas.0706406104. [DOI] [PMC free article] [PubMed] [Google Scholar]
- 13.Yoon J, Choi SC, Park CY, Choi JH, Kim YI, Shim WJ, et al. Bone marrow-derived side population cells are capable of functional cardiomyogenic differentiation. Mol Cells. 2008;25(2):216–23. [PubMed] [Google Scholar]
- 14.Passier R, Oostwaard DW, Snapper J, Kloots J, Hassink RJ, Kuijk E, et al. Increased cardiomyocyte differentiation from human embryonic stem cells in serum-free cultures. Stem Cells. 2005;23(6):772–80. doi: 10.1634/stemcells.2004-0184. [DOI] [PubMed] [Google Scholar]
- 15.Boomsma RA, Swaminathan PD, Geenen DL. Intravenously injected mesenchymal stem cells home to viable myocardium after coronary occlusion and preserve systolic function without altering infarct size. Int J Cardiol. 2007;122(1):17–28. doi: 10.1016/j.ijcard.2006.11.022. [DOI] [PubMed] [Google Scholar]
- 16.Kapur N, Mignery GA, Banach K. Cell cycle-dependent calcium oscillations in mouse embryonic stem cells. Am J Physiol Cell Physiol. 2007;292(4):C1510–8. doi: 10.1152/ajpcell.00181.2006. [DOI] [PubMed] [Google Scholar]
- 17.Epting CL, King FW, Pedersen A, Zaman J, Ritner C, Bernstein HS. Stem cell antigen-1 localizes to lipid microdomains and associates with insulin degrading enzyme in skeletal myoblasts. J Cell Physiol. 2008;217(1):250–60. doi: 10.1002/jcp.21500. [DOI] [PMC free article] [PubMed] [Google Scholar]
- 18.van de Rijn M, Heimfeld S, Spangrude GJ, Weissman IL. Mouse hematopoietic stem-cell antigen Sca-1 is a member of the Ly-6 antigen family. Proc Natl Acad Sci U S A. 1989;86(12):4634–8. doi: 10.1073/pnas.86.12.4634. [DOI] [PMC free article] [PubMed] [Google Scholar]
- 19.Snopko RM, Aromolaran AS, Karko KL, Ramos-Franco J, Blatter LA, Mejia-Alvarez R. Cell culture modifies Ca2+ signaling during excitation-contraction coupling in neonate cardiac myocytes. Cell Calcium. 2007;41(1):13–25. doi: 10.1016/j.ceca.2006.04.033. [DOI] [PubMed] [Google Scholar]
- 20.Bedada FB, Braun T. Partial induction of the myogenic program in noncommitted adult stem cells. Cells Tissues Organs. 2008;188(12):189–201. doi: 10.1159/000112831. [DOI] [PubMed] [Google Scholar]
- 21.Martin-Rendon E, Sweeney D, Lu F, Girdlestone J, Navarrete C, Watt SM. 5-Azacytidine-treated human mesenchymal stem/progenitor cells derived from umbilical cord, cord blood and bone marrow do not generate cardiomyocytes in vitro at high frequencies. Vox Sang. 2008;95(2):137–48. doi: 10.1111/j.1423-0410.2008.01076.x. [DOI] [PubMed] [Google Scholar]
- 22.Shim WS, Jiang S, Wong P, Tan J, Chua YL, Tan YS, et al. Ex vivo differentiation of human adult bone marrow stem cells into cardiomyocyte-like cells. Biochem Biophys Res Commun. 2004;324(2):481–8. doi: 10.1016/j.bbrc.2004.09.087. [DOI] [PubMed] [Google Scholar]
- 23.Tokcaer-Keskin Z, Akar AR, Ayaloglu-Butun F, Terzioglu-Kara E, Durdu S, Ozyurda U, et al. Timing of induction of cardiomyocyte differentiation for in vitro cultured mesenchymal stem cells: a perspective for emergencies. Can J Physiol Pharmacol. 2009;87(2):143–50. doi: 10.1139/Y08-111. [DOI] [PubMed] [Google Scholar]
- 24.Agbulut O, Menot ML, Li Z, Marotte F, Paulin D, Hagege AA, et al. Temporal patterns of bone marrow cell differentiation following transplantation in doxorubicin-induced cardiomyopathy. Cardiovasc Res. 2003;58(2):451–9. doi: 10.1016/s0008-6363(03)00281-5. [DOI] [PubMed] [Google Scholar]
- 25.Murry CE, Soonpaa MH, Reinecke H, Nakajima H, Nakajima HO, Rubart M, et al. Haematopoietic stem cells do not transdifferentiate into cardiac myocytes in myocardial infarcts. Nature. 2004;428(6983):664–8. doi: 10.1038/nature02446. [DOI] [PubMed] [Google Scholar]
- 26.Scherschel JA, Soonpaa MH, Srour EF, Field LJ, Rubart M. Adult bone marrow-derived cells do not acquire functional attributes of cardiomyocytes when transplanted into peri-infarct myocardium. Mol Ther. 2008;16(6):1129–37. doi: 10.1038/mt.2008.64. [DOI] [PMC free article] [PubMed] [Google Scholar]
- 27.Heubach JF, Graf EM, Leutheuser J, Bock M, Balana B, Zahanich I, et al. Electrophysiological properties of human mesenchymal stem cells. J Physiol. 2004;554(Pt 3):659–72. doi: 10.1113/jphysiol.2003.055806. [DOI] [PMC free article] [PubMed] [Google Scholar]
- 28.Kawano S, Shoji S, Ichinose S, Yamagata K, Tagami M, Hiraoka M. Characterization of Ca(2+) signaling pathways in human mesenchymal stem cells. Cell Calcium. 2002;32(4):165–74. doi: 10.1016/s0143416002001240. [DOI] [PubMed] [Google Scholar]
- 29.Escobar AL, Ribeiro-Costa R, Villalba-Galea C, Zoghbi ME, Perez CG, Mejia-Alvarez R. Developmental changes of intracellular Ca2+ transients in beating rat hearts. Am J Physiol Heart Circ Physiol. 2004;286(3):H971–8. doi: 10.1152/ajpheart.00308.2003. [DOI] [PubMed] [Google Scholar]
Associated Data
This section collects any data citations, data availability statements, or supplementary materials included in this article.
Supplementary Materials
Five independent differentiating media treatments: Cells were seeded in Mesencult plus supplements (StemCell Technologies) on the first day and differentiation started the following day. Groups of cells were treated with or without AZA (1.2 μM in Eagles MEM) and with different concentrations of FBS for 72 h. Thereafter, the cells were cultured in MEM with 5% FBS and ITS. A control group of cells was subjected to MEM and 5% FBS only.
FACS data for EP, IP, LP and IP enriched cells: A. EP cell total cell count was 300.5 × 10³, and on R10 were 29.1 × 10³. B. IP un-enriched cells total count was 355.7 × 10³, and on R10 were 4.4 × 10³ C. LP cell total cell count was 328.1 × 10³, and on R10 were 29. D. IP CD117/Sca-1+ enriched cells total count was 16.7 × 10³, and on R10 were 6.7 × 10³. E. FACS results of the percentages of CD117, Sca-1, and CD117/Sca-1 in EP, IP, LP, and IP enriched cells.
cTnT staining results after 21 days in LS differentiation media (EP plates were initially seeded with 8000 cells per well, IP and LP plates were seeded with 3000 cells per well). A. early passage cells; B. intermediate passage cells; C. late passage cells
Magnification of cTnT staining of IP CD117/Sca-1+ cells differentiated after 21 days in LS (top) and AZA (bottom). All lines are 20 μm long.
A. cTnT staining of IP CD117/SCA-1+ cells differentiated in MEM with 5% FBS. B. Comparison of cTnT positive results for IP-enriched cells differentiated in AZA, LS, and MEM. Values represent mean ± SEM, and significant differences (*) are P<0.05. The number of sampled fields from left to right was 31, 33, and 28 respectively.
cTnT+ comparison of IP CD117/SCA-1+ cells differentiated for 21 days in AZA with 0% 2%, and 5% FBS respectively. Values were normalized with respect to AZA+2%. Values represent mean + SEM, and significant differences (*) are P<0.05. The number of sampled fields from left to right was 38, 44, and 41 respectively.
A. cTnT+ cells comparison of IP CD117/SCA-1+ cells differentiated in MEM with 2% FBS after 56 days (D56), lifted after 26 days, replated (D56 replate) and cultured for an additional 30 days. Values represent mean + SEM, and significant differences (*) are P<0.05. The number of sampled fields from left to right was 39 and 40 respectively.
Intracellular Ca2+ transients at day 12 demonstrated variability in rhythm and amplitude.
Ca2+ transient of IP CD117/Sca-1 and DHPR enriched cells (30 days after the DHPR enrichment): A. Line scans of spontaneously cycling cell. B. Line scans of stimulated cell (stimulation: 1 Hz, 80V and 2ms duration pulse).
cTnT staining of cell group exhibiting spontaneous Ca2+ cycling and motion on supplemental Movie-1 file (30 days after the DHPR enrichment): A. Fluo-4 loaded cells. B. cTnT staining of the same group of cells. C. cTnT staining of the same group of cells at 23 μm above B in the Z-axis. Arrows indicate the presence of multiple cTnT positive cells within the moving group