

Abstract
The aim of the study was to assess whether 11C-choline PET/CT could identify high-risk primary adenocarcinoma of the prostate.
Methods
11C-choline PET/CT and transpelvic MR imaging were performed in 14 patients with untreated localized primary adenocarcinoma of the prostate followed by radical prostatectomy as form of primary monotherapy within 14 days of in vivo imaging. In order to allow accurate co-registration of whole mount histology with in vivo imaging, additional ex vivo MR images of the prostatectomy specimen were obtained. Nonlinear 3D image deformations were employed for registrations of PET/CT, MR imaging and histology. Volumes of interest from tumor and benign tissue were defined based on histology and were transferred into co-registered 11C-choline PET/CT volumes to calculate the mean (T(mean)/B) and maximum (T(max)/B) tumor-to-benign prostate background ratio. We assessed whether of 11C-choline uptake correlated with local Gleason score and tumor proliferation based on MIB-1/Ki-67 expression in tumor tissues represented on a tissue microarray.
Results
Histology confirmed 42 tumor nodules with Gleason scores between 3+2 and 4+4, with volumes ranging from 0.03 to 12.6 cm3. T(mean)/B (p < 0.01) and T(max)/B (p < 0.001) ratios were significantly increased in high Gleason score (≥4+3) lesions vs. 3+4 and lower disease, but failed to distinguish between 3+4 disease vs. 3+3 and lower. T(mean)/B and T(max)/B ratios were significantly increased in tumors with MIB-1/Ki-67 labeling index ≥ 5% (p < 0.01).
Conclusion
Based on our preliminary data utilizing tumor-to-benign prostate background ratios, 11C-choline preferentially identified aggressive primary prostate cancer.
Keywords: 11C-Choline, PET/CT, PET/MRI, Primary prostate cancer, Image fusion
INTRODUCTION
There is no consensus on what criteria should be used as to “trigger” definitive treatment (such as surgery or radiation therapy) in men undergoing active surveillance for known localized adenocarcinoma of the prostate. A recent update on the results of the randomized trial comparing radical prostatectomy versus watchful waiting in localized prostate cancer performed by the Scandinavian Prostate Cancer Group (Study Number 4) indicated that prostatectomy did not prolong survival unless patients were younger than 65 years of age (1). However, this study also showed that in those patients who received prostatectomy the disease related mortality clearly increased with high Gleason scores. Identifying aggressive disease early in the disease process could therefore be beneficial for therapeutic decision making (2).
The current diagnostic situation is, however, unsatisfactory since many prostate cancers represent clinically irrelevant disease and the diagnosis poses the risk for overtreatment. Especially in the light of the known side effects of localized treatment, this is a difficult clinical and ethical dilemma. Standard of care is repeated random prostate biopsy, which because of sampling errors frequently under- or overestimate the true Gleason pattern as determined from prostatectomy specimens (3, 4). Due to this dilemma, the initiation of treatment is often influenced by individual preferences of the patient, but generally includes palpable tumors with a Gleason score of at least 7 in several biopsies, or any tumor biopsy with a Gleason score >7.
Hybrid positron emission tomography and x-ray computed tomography (PET/CT) imaging with 11C-choline has shown promise in the detection of primary prostate cancer associated with upregulated choline kinase activity and increased choline retention. Choline is incorporated into phosphatidylcholine, a major component of cell membranes. Malignant tumors show increased proliferation and metabolism of cell membrane components and, accordingly, an increased choline uptake (5). Thus far, studies evaluating 11C-choline for the detection of primary prostate cancer have been inconclusive (6-9). Some encouraging recent reports from Scher et al. (10) and Krause et al. (11) indicated that detection rates in recurrent disease are related to the disease burden as assessed by PSA values. However, to date all studies comparing 11C-choline imaging results with histology, whether from biopsies or prostatectomy specimens, suffer from considerable uncertainty about the true location of disease in relation to the imaging findings they are felt to represent.
In order to minimize these technical limitations, we compared 11C-choline PET/CT with histological truth using a rigorous, non-biased, co-registration method using a standard mutual information cost function algorithm and thin-plate spline warping (12). This registration technique - utilizing high-resolution ex vivo magnetic resonance (MR) imaging of the prostatectomy specimen and whole mount histology - allowed us to assess the ability to detect primary prostate cancer and evaluate whether imaging would correlate with histological features associated with tumor aggressiveness. We selected the well-established Gleason score and immunostaining for MIB-1/Ki-67, a nuclear protein complex expressed during cell replication, as surrogate markers for aggressiveness; both have been shown to be reliable prognostic markers in prostatectomized patients (13-15).
MATERIALS AND METHODS
Patient Population
The study was conducted in 14 men (mean age 59.6 y, range 47 – 72) with biopsy-proven, untreated localized adenocarcinoma of the prostate scheduled for prostatectomy (Table 1). Eligible patients received prostate biopsies (6 samples from each lobe) within 16 weeks prior to enrollment which resulted in 3 or more cores positive for a Gleason score 6 or greater cancer from at least one lobe of the prostate. A negative bone scan and CT scan of abdomen pelvis was required if the PSA level was ≥ 15 ng/ml or a biopsy Gleason score of ≥ 8 was obtained. Patients with prior androgen ablation treatment, prostate biopsies performed less than 6 weeks before PET/CT and MR imaging, previous external radiation treatment of the pelvic region, any prior malignancies, active inflammatory bowl disease or evidence of prostatitis were not eligible.
TABLE 1.
Patient Characteristics
| Patient No. |
Age (Years) |
11C-Choline Injected Activity (MBq) |
PSA (ng/ml) |
Prostate Weight (g) |
T-stage (Final Pathology) |
Highest Gleason Score (Biopsy) |
Highest Gleason Score (Final Pathology) |
|---|---|---|---|---|---|---|---|
| 1 | 47 | 706.7 | 10.1 | 27.4 | T2b | 3+4 | 3+4 |
| 2 | 72 | 725.2 | 8.7 | 40.9 | T3a | 4+3 | 3+4 |
| 3 | 60 | 728.9 | 8.5 | 45.1 | T3a | 4+3 | 4+3 |
| 4 | 56 | 669.7 | 7.1 | 52.8 | T2b | 4+4 | 4+3 |
| 5 | 59 | 691.9 | 12.1 | 49.1 | T3b | 3+4 | 4+4 |
| 6 | 59 | 658.6 | 17.9 | 63.0 | T3b | 3+4 | 4+4 |
| 7 | 64 | 684.5 | 2.2 | 64.5 | T2b | 3+3 | 3+4 |
| 8 | 66 | 651.2 | 5.9 | 41.2 | T3a | 3+4 | 4+3 |
| 9 | 67 | 721.5 | 3.9 | 43.8 | T2b | 4+4 | 4+3 |
| 10 | 64 | 691.9 | 10.2 | 47.7 | T3b | 3+4 | 4+3 |
| 11 | 55 | 695.6 | 4.6 | 41.7 | T3a | 3+4 | 3+4 |
| 12 | 63 | 666.0 | 4.4 | 44.9 | T2b | 4+3 | 4+3 |
| 13 | 46 | 699.3 | 6.9 | 39.7 | T2b | 3+4 | 3+4 |
| 14 | 56 | 703.0 | 8.2 | 45.4 | T3a | 3+3 | 4+3 |
| Mean | 59.6 | 692.4 | 7.9 | 46.2 | |||
| SD | 7.3 | 24.4 | 4.0 | 9.4 |
In Vivo Imaging
In vivo imaging was performed within 14 days prior to radical prostatectomy (mean 7.4 days, range 3-14 days). In 11 cases, MR and 11C-choline PET/CT imaging was performed on the same day, while in the remaining 3 cases imaging was completed one day apart. MR imaging was performed to allow for subsequent image co-registration and identification of focal prostate lesions. Therefore, MR imaging included anatomic T2 weighted 3T MR (Achieva, Philips Medical Systems, USA) using a transpelvic coil. Scans were performed in axial orientation using a high-resolution sequence with a repetition time of 3208 ms and echo time of 86 ms. Images were reconstructed in a 720×720×24 pixel matrix resulting in a 0.31×0.31×4 mm3 voxel dimension with TE = 4151 ms and TR = 90ms.
PET/CT was performed on a Siemens Biograph classic scanner which incorporates an ECAT HR+ PET camera with a 2-channel helical CT (n = 12). In 2 cases, PET/CT scanning was performed on a Biograph TrueV HiRez scanner with extended field of view and a 6-channel helical CT (Siemens Medical Solutions, Malvern, PA). The intrinsic axial resolution of these two PET/CT systems (at the center of the field of view) differ with approximately 5.2 mm full-width half maximum (FWHM) for the first (16) and 4.5 mm for the second scanner. After injecting approximately 700 MBq of 11C-choline, a limited body scan of the abdomen and pelvis followed starting 5 minutes after injection (6, 8, 17) at the level of the prostate (7 min. per bed position). Images were reconstructed in a 128×128×210 matrix resulting in a 5.2×5.2×2.4 mm3 voxel dimension using identical iterative (OSEM) algorithms on both scanners (Fourier-rebinning (FORE), 4 iterations, 8 subsets) with a 7 mm Gaussian filter utilizing a low-dose CT without intravenous or oral contrast for attenuation correction. As a result, the effective axial reconstructed resolution was similar on both scanners and determined to be in the range of 9.0 mm FWHM on the first and 8.5 mm FWHM on the second scanner (personal communication, Dr. Robert Koeppe).
Image Co-registration
A standard registration method based on a mutual information cost-function and thin-plate spline deformation was used (18). Registration among in vivo imaging modalities is well established, but accurate registration involving histology is challenging. A detailed description of the applied methodology is available (12). Briefly, our approach separated the difficult direct registration of histology and in vivo imaging (PET/CT, MR imaging) into achievable subregistration tasks involving intermediate ex vivo modalities like block face photography and specimen MR imaging which was performed 2-3 days after prostatectomy. Additional volumetric stacking of block phase photographs (registered with histology) improved registration onto specimen MR volumes. Results of subregistration tasks were combined to compute the intended, final registration between our reference space (T2-weighted MR) and whole mount histology (Figure 1). Registration errors between in vivo imaging and histology were previously determined to be in the range of 2.26 to 3.74 mm (12).
FIGURE 1.

Three dimensional (3D) image registration was performed using a mutual information system and thin-plate spline (TPS) deformation with 6 to 18 points (pt). All registration subtasks (solid arrows) are 3D registrations except for histology onto block face registration. Pictures of registered 11C-choline PET, anatomical MR (references space), ex vivo specimen MR, and the respective histology section are provided in Figure 3.
Histological Assessment and Tissue Microarray Construction
Fresh prostates removed after surgery and fixed overnight in 10% neutral formalin. After specimen MR imaging, the prostate was sectioned at 3-mm intervals perpendicular to the long axis of the gland from the base to apex and processed for histological assessment (hematoxylin/eosin (HE) stain) using a whole-mount technique (19, 20). Tumor maps were generated for each whole-mount slice to determine individual tumor foci in multifocal prostate cancers as previously described (21). Each tumor focus was assigned a primary and secondary Gleason grade and staged according to the 1998 American Joint Committee on Cancer (AJCC) guidelines (22). Benign hyperplasia was diffusely present in almost all benign prostatic regions.
A tissue microarray representing a total of 42 tumor foci from 14 patients (which included an index tumor and any separate secondary tumor) as well as benign tissue was constructed from these prostatectomy specimens. Three cores were taken from each sampled tissue area resulting in a total of 162 cores available for analysis. Proliferation was determined by the % nuclear expression of MIB-1 immunohistochemistry (MIB-1, Dako, Carpinteria, CA) on formalin-fixed, paraffin-embedded tissue and quantified by digital image analysis as previously described (20). An MIB-1/Ki-67 labeling index of 5% or higher was considered positive (14). Histological evaluations (biopsies, prostatectomy specimen, MIB-1/Ki-67 labeling index) were performed by one investigator (R.S.) blinded to the results of PET/CT and MR imaging.
Image Analysis
Image co-registration of 11C-choline PET with pathology enabled us to compare in vivo imaging results with histological truth (including local Gleason score and MIB-1/Ki-67 labeling index). First, volumes of interest (VOI) were defined on co-registered consecutive HE pathological sections contouring the borders of each tumor lesion individually and thereby calculating the tumor volume. Also, at least one standardized VOI (1.5 cm3) was defined in benign tissue in the peripheral zone and central gland avoiding proximity to cancerous lesions. VOI were then evaluated on co-registered 11C-choline PET images to obtain the mean and maximum Standardized Uptake Value (SUV). As a result, the location of the VOI (in 3D space) was defined solely by pathology and not by any imaging feature visually identified on PET or MR images. In order to minimize the impact of differing PET imaging equipment (especially counting efficacy), PET imaging results were normalized by benign prostate tissue before further analysis. As almost all non-malignant regions included areas of diffuse benign hyperplasia, normalization was done based on a mixture of normal and hyperplastic benign prostatic tissues. We calculated the mean (T(mean)/B) and maximum (T(max)/B) tumor-to-benign prostate background ratio using contra-lateral histologically benign tissue as reference. Tumor uptake was normalized according to location, thus peripheral zone tumors were normalized by non-malignant contra-lateral peripheral zone tissue. The 11C-choline uptake in larger tumors involving significant portions of the prostate lobe was normalized by the mean of the benign peripheral and central gland (avoiding the inclusion of the urethra in the VOI).
Statistics
Results are expressed as mean values of parameters ±SD. Parameters were compared by means of 1-way ANOVA using the measured tumor volume (below 1 cm3) as weighting factor, while tumors larger than 1 cm3 were assessed without weighting. As a result, tumor nodules with volumes below 1 cm3 contributed progressively less (with decreasing volume) to the result of statistical testing thereby accounting for a decreasing reliability of the 11C-choline uptake measures with decreasing volume. Homogeneity of group variances were tested using the Levene test at a nominal significance level of 0.1, offering more protection against falsely declaring all variances equal, when in fact they were not. In case of homogeneous group variances, data were compared using a t-test or paired t-test, when appropriate. If variances were not equally distributed, group differences were assessed using the Wilcoxon rank sign test. P < 0.05 was considered statistically significant. Statistical tests were performed with the JMP statistical software package (SAS).
RESULTS
Table 1 summarizes patient data. Patients were staged T2b-T3b at pathology. The mean PSA in our study population was 7.9 ± 4.0 (range 2.2 – 17.9) ng/ml. The weight of the prostate specimen ranged from 27.4 to 65.4 g.
Table 2 summarizes the results of the 42 tumor nodules identified on HE histology. With the exception of a single case, tumors were generally multifocal, with focal nodule volumes ranging from 0.03 to 12.6 cm3. Small tumors, below the reconstructed resolution of 11C-choline PET/CT were in the majority. Therefore, partial volume effects clearly influenced the ability to characterize disease. To minimize these effects, we used the tumor volume (as determined by fusion imaging with pathology) as a weighting factor, thus accounting for greater reliability of imaging results obtained from larger tumor volumes, and down-weighting the effects of unreliable low volume lesions (< 1 cm3) in the statistical analyses. Gleason scoring of the largest tumor lesion per patient varied between 3+3 and 4+4. Multifocal (secondary) tumor lesions were generally scored as Gleason 3+4 and lower, however two separate satellite 4+4 lesions (volumes 0.3 and 0.4 cm3) were found in the vicinity of a larger 4+4 lesion (patient no. 6 in Table 2), thus clearly reducing likelihood of detection by PET.
TABLE 2.
Characteristics of Individual Tumor Nodules
| Tumor No. |
Patient No. |
Tumor Volume (mm3) |
Gleason Score |
MIB-1/Ki-67 Labeling Index |
Tumor SUV(mean) |
Tumor SUV(max) |
T(mean)/B Ratio |
T(max)/B Ratio |
|---|---|---|---|---|---|---|---|---|
| 1 | 1 | 853 | 3+4 | 0 | 3.4 | 4.4 | 1.3 | 1.6 |
| 2 | 1 | 1501 | 3+4 | 0 | 2.0 | 2.2 | 0.7 | 0.8 |
| 3 | 1 | 973 | 3+3 | 3 | 3.1 | 4.4 | 1.2 | 1.6 |
| 4 | 2 | 1741 | 3+4 | 0 | 1.4 | 2.3 | 1.0 | 1.5 |
| 5 | 2 | 64 | 3+3 | 0 | 1.4 | 1.5 | 0.9 | 1.0 |
| 6 | 2 | 255 | 3+3 | 0 | 1.5 | 2.0 | 1.0 | 1.4 |
| 7 | 2 | 66 | 3+3 | 6 | 1.8 | 2.1 | 1.2 | 1.4 |
| 8 | 3 | 2587 | 4+3 | 0 | 3.6 | 5.1 | 1.1 | 2.0 |
| 9 | 3 | 63 | 3+3 | 0 | 2.2 | 2.4 | 0.7 | 0.8 |
| 10 | 3 | 335 | 3+3 | 0 | 4.0 | 4.6 | 1.3 | 1.4 |
| 11 | 3 | 351 | 3+3 | 2 | 2.6 | 3.4 | 0.9 | 1.1 |
| 12 | 4 | 817 | 4+3 | 12 | 3.2 | 3.8 | 1.1 | 1.3 |
| 13 | 4 | 61 | 3+3 | 0 | 2.9 | 3.1 | 1.0 | 1.1 |
| 14 | 5 | 7166 | 4+4 | 24 | 1.7 | 2.8 | 1.0 | 1.7 |
| 15 | 6 | 9861 | 4+4 | 30 | 4.0 | 6.3 | 1.7 | 2.7 |
| 16 | 6 | 340 | 4+4 | 3 | 2.7 | 3.4 | 1.2 | 1.5 |
| 17 | 6 | 399 | 4+4 | 0 | 3.4 | 3.9 | 1.3 | 1.5 |
| 18 | 7 | 3982 | 3+4 | 3 | 1.2 | 1.9 | 0.8 | 1.2 |
| 19 | 7 | 679 | 3+3 | 0 | 2.0 | 2.3 | 0.9 | 1.1 |
| 20 | 7 | 53 | 3+3 | 9 | 0.9 | 1.0 | 0.6 | 0.6 |
| 21 | 7 | 75 | 3+3 | 0 | 1.1 | 1.2 | 0.5 | 0.8 |
| 22 | 8 | 1227 | 4+3 | 9 | 3.3 | 4.6 | 1.2 | 1.7 |
| 23 | 8 | 212 | 3+3 | 0 | 2.4 | 2.6 | 0.9 | 1.0 |
| 24 | 9 | 227 | 3+2 | 0 | 1.7 | 1.8 | 0.9 | 0.9 |
| 25 | 9 | 2469 | 4+3 | 4 | 2.8 | 5.0 | 1.4 | 2.6 |
| 26 | 10 | 12627 | 4+3 | 18 | 2.3 | 4.1 | 2.1 | 3.8 |
| 27 | 10 | 132 | 3+2 | 0 | 1.2 | 1.4 | 1.1 | 1.3 |
| 28 | 11 | 1011 | 3+3 | 0 | 1.7 | 3.1 | 0.7 | 1.3 |
| 29 | 11 | 1980 | 3+4 | 0 | 2.5 | 4.1 | 1.0 | 1.7 |
| 30 | 11 | 224 | 3+4 | 4 | 3.8 | 4.2 | 1.3 | 1.4 |
| 31 | 11 | 34 | 3+3 | 0 | 3.9 | 4.1 | 1.3 | 1.4 |
| 32 | 11 | 1518 | 3+3 | 3 | 2.8 | 4.2 | 1.0 | 1.4 |
| 33 | 12 | 3596 | 4+3 | 3 | 1.7 | 3.3 | 1.2 | 2.3 |
| 34 | 12 | 624 | 3+4 | 0 | 1.1 | 2.3 | 0.5 | 1.0 |
| 35 | 12 | 1330 | 3+3 | 0 | 0.8 | 2.6 | 0.6 | 1.8 |
| 36 | 12 | 612 | 4+3 | 0 | 1.8 | 2.9 | 0.8 | 1.3 |
| 37 | 13 | 1958 | 3+4 | 0 | 7.0 | 10.6 | 1.1 | 1.7 |
| 38 | 13 | 103 | 3+3 | 0 | 8.8 | 10.2 | 1.4 | 1.6 |
| 39 | 13 | 483 | 3+3 | 0 | 7.0 | 9.2 | 1.1 | 1.5 |
| 40 | 14 | 364 | 3+3 | 0 | 4.3 | 6.6 | 1.2 | 1.9 |
| 41 | 14 | 182 | 3+3 | 0 | 7.6 | 8.1 | 1.4 | 1.5 |
| 42 | 14 | 6784 | 4+3 | 12 | 9.5 | 15.6 | 2.7 | 4.4 |
| Mean | 1664.8 | 3.5 | 3.1 | 4.2 | 1.1 | 1.6 | ||
| SD | 2721.2 | 6.7 | 2.1 | 2.9 | 0.4 | 0.7 |
11C-choline uptake was not uniformly distributed within the non-malignant prostate tissues. Using paired comparisons within individual patients, the mean 11C-choline SUV of the non-malignant central gland (mean SUV 3.1 ± 1.4) was significantly higher (p < 0.005) compared to the respective benign peripheral gland (mean SUV 2.5 ± 0.4). In order to account for these distribution differences, we selected the benign background tissue according to the location of the tumor nodule as described in the method’s section.
Focally increased 11C-choline uptake within the prostate was only identified in tumors, thus, no false positive cases were observed. Figure 2 shows the PET/CT images of patient no. 14 with focally increased 11C-choline uptake on the left side of the gland. Figure 3 displays the results of the registrations of ex vivo specimen and in vivo anatomical MR plus 11C-choline PET/CT imaging onto histology for the same patient. The left sided tumor (volume 6.8 cm3) was graded Gleason 4+3 with a MIB-1/Ki-67 labeling index of 12, while 2 right sided low volume lesions graded Gleason 3+3 remained undetected by PET. Note that the axial PET imaging planes in Figure 2 and 3 are not identical, since the respective PET image slice as well as the prostate specimen MR and histology slices underwent non-linear warping to match the transpelvic T2-weighted MR reference slice in Figure 3.
FIGURE 2.

The non-contrast CT (A), 11C-choline PET (B) and rigid fusion image (C) of patient no. 14 with an adenocarcinoma of the prostate on the left side. PET images are scaled to the SUV with a minimum at −0.05 and a maximum at 8. Please note differences of apparent uptake when compared to the registered 11C-choline image in Figure 3.
FIGURE 3.

Registration of specimen MR (B), anatomical transpelvic coil MR (C), and 11C-choline PET (D) imaging onto one gray-scale converted whole mount histology slice (A) for patient 14. Cancerous tissue is encircled in dotted lines on histology by the pathologist (handwritings). In the second row are displayed alternating checkerboard fusion of registered specimen (E) and transpelvic MR (F), and registered PET (G) imaging with histology. On histology, the posterior aspect of the histology slice leaves the imaging plane of MR and PET and is therefore not visualized (black).
Volume-weighted 11C-choline T(mean)/B and T(max)/B ratios were used for further data analyses as these parameters relate to visual identification of potential tumor foci. The T(mean)/B (p < 0.01) and the T(max)/B (p < 0.001) ratios were significantly elevated in lesions with Gleason score of 4+3 or higher (T(mean)/B: 1.5 ± 0.5; T(max)/B: 2.4 ± 0.9) vs. 3+4 and lower (T(mean)/B: 0.9 ± 0.2; T(max)/B: 1.4 ± 0.2). However, there was considerable overlap between these groups. Also, the T(mean)/B and T(max)/B ratios failed to distinguish Gleason 3+4 (T(mean)/B: 0.9 ± 0.2; T(max)/B: 1.4 ± 0.3) vs. ≤ 3+3 disease (T(mean)/B: 0.9 ± 0.1; T(max)/B: 1.4 ± 0.2) as such tumors generally showed 11C-choline uptake similar to benign prostate (Figure 4). On the other hand, the mean SUV of the tumor tissue (Gleason score ≥ of 4+3 T(mean)/B: 4.0 ± 1.8; Gleason score ≤ 3+4 T(mean)/B: 2.8 ± 1.3) did not correlate significantly with Gleason scoring (p = 0.22).
FIGURE 4.

The 11C-Choline T(max)/B ratio differentiated tumors with a Gleason score of 4+3 or higher versus 3+4 and lower (p < 0.001), however failed to distinguish Gleason 3+4 versus 3+3 and lower (NS). Tumor lesions with a MIB-1/Ki-67 labeling index of 5 or higher are shown as triangles, all other lesions as crosses (n = 42).
We repeated this analysis in a subgroup with tumor volumes greater than 1 cm3 (n = 16). Again, the data showed that the T(mean)/B ratio (p < 0.01) and the T(max)/B ratio (p < 0.01) differentiated tumors with a Gleason score of 4+3 or higher (T(mean)/B: 1.6 ± 0.5; T(max)/B: 2.6 ± 1.0) vs. 3+4 and lower (T(mean)/B: 0.9 ± 0.2; T(max)/B: 1.4 ± 0.3), indicating that mere partial volume effects did not explain the overall findings. Tumors with extracapsular extension (T3 lesions: penetration of the prostatic capsule and/or seminal vesicle invasion, n = 11, T(mean)/B: 1.4 ± 0.5; T(max)/B: 2.3 ± 1.0) displayed significantly higher T(mean)/B (p < 0.001) and T(max)/B (p < 0.001) ratios compared to the remaining lesions (T(mean)/B: 1.0 ± 0.3; T(max)/B: 1.3 ± 0.4; n = 31). However, extracapsular extension was never directly identified on 11C-choline PET images.
As can be seen from Table 2, the MIB-1/Ki-67 labeling indices were generally low, however increased with higher Gleason scores. We found significantly higher MIB-1/Ki-67 labeling indices with primary Gleason scores of 4+3 and higher (10.9 ± 9.4) compared to 3+4 and lower (0.8± 0.9; p < 0.01), indicating that both histological markers are linked with each other (n = 42). Also, the 11C-choline T(mean)/B (p < 0.01) as well as the T(max)/B ratio (p < 0.01) were significantly higher in tumors showing elevated MIB-1/Ki-67 labeling indices of ≥ 5 (T(mean)/B: 1.7 ± 0.6; T(max)/B: 2.7 ± 1.1) compared to lesions with an MIB-1/Ki-67 labeling index ≤ 4 (T(mean)/B: 1.0 ± 0.2; T(max)/B: 1.5 ± 0.3). These data indicate that the 11C-choline tumor uptake increased with moderately rising proliferation indices (Figure 5). The mean tumor SUV did not correlate with MIB-1/Ki-67 (p = 0.68). MIB-1/Ki-67 staining was negative in all sampled benign tissues.
FIGURE 5.
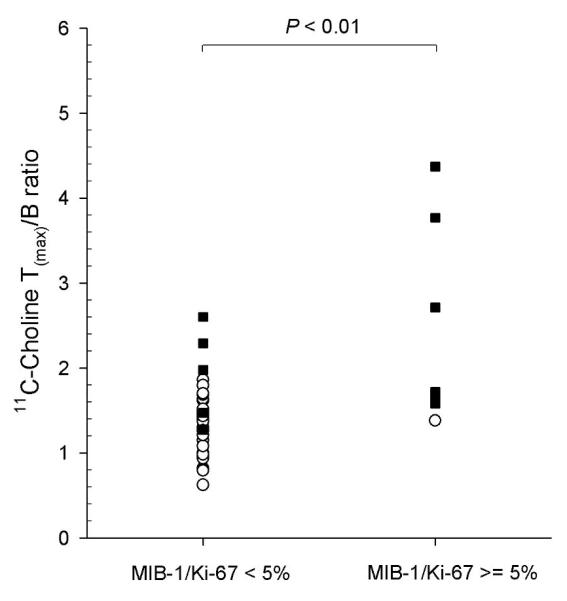
The 11C-Choline T(max)/B ratio differentiated tumor lesions with a MIB-1/Ki-67 labeling index of 5 and higher versus 4 and lower (p < 0.01). Tumor lesions with a Gleason score of 4+3 or higher are shown as black squares, all other lesions as white circles (n = 42).
In addition, we evaluated the value of the prostate biopsies for the prediction of the final Gleason score. Since the true location of the individual prostate biopsy (within a given lobe) was not known, we compared the maximum Gleason score of each prostate lobe obtained from biopsies with the final specimen (n = 27). In 6 cases, no tumor was identified by biopsies in prostate lobes bearing tumor at final pathology. However, these cases were exclusively tumors with a final Gleason score of 3+3 or lower. Nevertheless, the biopsies failed to accurately predict the final primary Gleason score to be 4+3 and higher versus 3+4 and lower (p = 0.16).
DISCUSSION
11C-choline PET has been successfully applied to visualize prostate cancer, bladder cancer as well as several other solid malignancies (6, 23-26). Previous 11C-choline PET studies conducted in patients with primary prostate cancer have lead to conflicting results. While 11C-choline has repeatedly been shown to visualize primary prostate cancer, the observed sensitivity for disease detection varied considerably (6-8, 17, 26, 27). On the other hand, 11C-choline was found to be rather successful for the detection of occult (low volume) recurrent and distant metastatic disease (11, 28, 29). A clear understanding of the mechanisms involved in increased 11C-choline uptake and retention by prostate cancer is still lacking. In the light of these previous findings, our study was conducted to identify whether 11C-choline PET would identify high-risk primary prostate cancer by rigorously comparing the 11C-choline uptake with markers of aggressiveness such as the Gleason score and MIB-1/Ki-67 labeling index using 3D multi-modality fusion with histology.
The major result of the current study indicates that increased 11C-choline uptake in primary prostate cancer is correlated with histological surrogate markers of aggressiveness. For our evaluation, we utilized the well established Gleason score and the MIB-1/Ki-67 labeling index. Extensive literature exists showing that both are reliable prognostic markers for prostatectomized patients (13-15). Many solid malignancies including lung, colon, breast and prostate cancer overexpress choline kinase, which phosphorylates choline to phosphocholine as the first step of choline metabolism (30). Intracellular choline concentrations are therefore determined by both, choline transport as well as choline kinase activity (31, 32). Choline kinase expression has been shown to be increased due to certain cell stresses as well as presence of important oncogenes which therefore influence cell membrane synthesis as choline is a major constituent of mammalian cell membranes (33). As a result, the rapid growth and proliferation of cancer cells may lead to increased membrane/fatty acid demands. Using a panel of tumor cell lines, Yoshimoto et al. confirmed in cell culture experiments that the 14C-choline uptake is positively correlated with DNA synthesis (32).
Our data seem to contradict earlier reports showing that 11C-choline uptake did not differentiate between grade and stage of prostate cancer or even between malignancy and benign prostatic hyperplasia (9, 27) as well the study from Breeuwsma et al. who were the first to directly compare the uptake of 11C-choline with immunohistochemical cell proliferation markers in prostate cancer lesions (34). Lacking true co-localization between PET and histological parameters, which restricted all these studies to investigate exclusively apparently 11C-choline positive lesions, they evaluated whether the intensity of visual uptake and mean tumor SUV obtained from 11C-choline PET correlated with Gleason score, T-stage, and – in case of Breewsma et al. - also nuclear MIB-1/Ki-67 staining. Thus, 11C-choline negative lesions were not included in their analysis. Due to the inability to definitively localize non-malignant prostate tissue on 11C-choline PET, tumor-to-background ratios were also not available for analysis. Considering differences in technique, patient populations as well as small sample sizes in most studies and expected variability of histological and imaging parameters, it is not surprising that previous studies failed to identify significant correlations. In fact, our results do not truly dispute these prior findings as our results merely predict that the majority of 11C-choline positive lesions (as identified by T(mean)/B and T(max)/B ratios) have Gleason score ≥ 4+3 and display moderately increased MIB-1/Ki-67 staining compared to 11C-choline negative lesions.
Reske et al. reported more promising results in 26 patients with pT2a to pT4 primary prostate cancer as they unambiguously located tumor lesions, visually and semi-quantitatively using an SUV threshold of 2.65 (26). While they were unable to demonstrate a correlation of the tumor SUV with the Gleason score, they found a significant correlation with the T-stage. Our results further indicate that the mean tumor SUV (as used by Sutinen et al. (9), Breeusma et al. (34), and Reske et al. (26)), or the maximum tumor SUV (as used by Farsad et al. (17)) are poor predictors of Gleason score and MIB-1/Ki-67 labeling index, while normalization by non-malignant prostate tissue clearly improves lesion characterization. In fact, based on our data it became apparent that the ratio between tumor and normal tissue is the key to identify aggressive disease, while the absolute mean or maximum SUV in a given lesion has less predictive value. This observation is critical, since it highlights the considerable variability of 11C-choline uptake in benign prostate tissues (as seen in our patient population), which raises the possibility of additional (unknown) parameters unrelated to malignant progression systematically influencing prostatic 11C-choline biodistribution or metabolism.
Without co-registered histology, normalization of tumor uptake by non-malignant prostate tissue is difficult since the true location of benign prostate tissue is not definitely known. This is especially problematic given the identified variability of 11C-choline uptake within the benign prostate (central vs. peripheral gland) and when considering that prostatitis and hormonal treatment might have variable effects on the uptake of benign and malignant tissues. Biological characterization of prostate cancer using 11C-choline may however be possible using co-registration with high-resolution anatomical imaging (such as T2-weighted MR). As current state-of-the-art MR imaging of prostate cancer improves (35), it can be speculated that future clinical hybrid PET/MR imaging will benefit lesion characterization by providing reliable anatomical image information verifying (or disproving) the existence of a tumorous lesion at the site of focally increased 11C-choline uptake. If confirmed, such a lesion could – at the same time - be metabolically characterized by 11C-choline as being high or lower risk. Hybrid PET/MR imaging may even include MR spectroscopy which recently has also shown promise in the identification of aggressive disease (36).
Our approach included the registration of multiple imaging modalities (including MR imaging) using a mutual information system and thin plate splines to accomplish 3D, nonlinear (warping) deformations. Additional co-registration of histological information was possible after breaking up the difficult direct registration of histology and in vivo imaging into achievable sub-registration tasks involving intermediate ex vivo block face photography and specimen MR imaging. This methodology was recently introduced and evaluated by our group (12). While such multi-modality registration tasks are not without intrinsic errors (between 2.3 and 3.7 mm as determined earlier in (12)), properly registered fusion images are certainly more accurate than simply comparing 11C-choline PET or PET/CT images with individual histological slices. In fact, given the considerable deformations in specimen extraction and processing, the likelihood that a 2D histological sample maps directly back into a 2D plane of a given in vivo image volume seems incredibly small (37).
Several previous studies investigating primary prostate cancer with 11C-choline PET reported false positive cases, while we did not observe focally increased 11C-choline uptake in benign tissues. Although precise spatial correlation with pathology was not available, earlier studies attributed such false positive foci to overlap of benign tissue with malignancy (10), high-grade prostate intraepithelial neoplasm or prostatitis (17). Since the 11C-choline uptake is known to be influenced by inflammation, false positive results may also have been biopsy-induced when biopsies were performed close to PET imaging (26).
Based on data obtained in this study, important reasons for the failure to characterize primary prostate cancer reliably using 11C-choline PET are the lack of proper co-registration of histology with PET and partial volume effects. Even with normalization of 11C-choline data using T(mean)/B and T(max)/B ratios, we found considerable overlap of 4 aggressive low volume cancers with non-malignant tissues. Most patients were imaged on a PET/CT scanner with a reconstructed resolution of approximately 9 mm (we purposely used identical reconstruction settings on the second high-resolution scanner to maintain comparability). While such performance characteristics are currently not uncommon, they are insufficient to characterize low volume disease. Utilizing partial volume correction algorithms will likely not overcome this limitation and improve lesion detection because the expected uptake differential is relatively low (approximately 2-4 times higher in aggressive lesions compared to contralateral benign tissue as seen in our study). Also, such algorithms assume homogeneous tracer uptake in both, the lesion and its vicinity (38). Systematic information about heterogeneity of 11C-choline uptake in prostate cancer is not available, but our study as well as others (26) demonstrated regional differences of the 11C-choline uptake within benign prostatic tissues. An additional confounding factor for peripheral zone lesions is the temporal variation of extraprostatic activity in the rectum which is not well represented on fusion MR imaging as performed in this study.
Evidence of extracapsular tumor is a strong predictor of metastases and prostate cancer death (1). While we were unable to directly identify capsular penetration or invasion of the seminal vesicles by visual inspection of 11C-choline PET images, the vast majority of 11C-choline positive lesions constituted as T3 disease. Based on our data, T3 (or higher) disease should be suspected if focally enhanced 11C-choline uptake is identified within a known cancer lesion. Co-registration with high-resolution MR imaging might provide further evidence to support the presence of T3 disease.
Definitive treatment cannot be recommended for all patients with localized prostate cancer. Therefore, accurate differentiation between low/intermediate versus highly aggressive prostate cancer early in the disease process is important for clinical decision making. It is clear from the Scandinavian report that prostatectomy mainly benefits men under 65 years of age with higher summed Gleason scores at or above 7 (1), but it does not suggest that definitive treatment would be inappropriate for aggressive early-stage disease above 65 years of age. Due to extensive PSA testing, many men are classified as having Gleason score ≤ 6 prostate cancer at diagnosis, and whether or not such disease requires treatment is a highly controversial issue (2, 39). Accurate identification of aggressive lesions is a requirement for the adoption of active surveillance as described by Dall’Era et al. (40), commonly done by repeated prostate biopsies. However, non-invasive imaging approaches would considerably facilitate such surveillance (“watchful waiting”) if they prove to be equally or more accurate than repeated multiple random biopsies. However, we caution that before 11C-choline (or other molecular markers of prostate cancer aggressiveness) can be integrated into diagnostic algorithms providing guidance for treatment pathways, additional prospective verification is needed to support that bioptic sampling of 11C-choline positive lesions is clinically feasible and at least as accurate as random prostate biopsies. This would necessitate fusion of 11C-choline uptake data with high-resolution anatomical imaging to identify lesions for targeted biopsy.
CONCLUSION
Our preliminary data indicate that increased 11C-choline uptake in primary prostate cancer normalized by non-malignant prostate tissue may serve as a marker of tumor aggressiveness. Even after necessary confirmation of our pilot data in a larger series of patients, the difficulties in identifying benign prostatic tissues without sophisticated fusion techniques will limit clinical applications. It is, however, conceivable that improved imaging equipment offering fusion of 11C-choline PET data with high-resolution anatomical imaging (such as future hybrid PET/MR imaging) may offer the potential to guide targeted prostate biopsies and to non-invasively select high-risk patients for definitive treatments such as surgery or radiotherapy.
ACKNOWLEDGEMENTS
We would like to thank the staff of the PET and MR imaging suites for their excellent technical support. We would also like to honor the late co-investigator Dr. Saroja Adusumilli who died at age 36 in a car accident in March 2007, for her outstanding contributions to this research and dedication to patient care.
This research is supported by P50 CA069568 NIH/NCI (Prostate Cancer SPORE).
REFERENCES
- 1.Bill-Axelson A, Holmberg L, Filen F, et al. Radical prostatectomy versus watchful waiting in localized prostate cancer: the Scandinavian prostate cancer group-4 randomized trial. J Natl Cancer Inst. 2008;100(16):1144–1154. doi: 10.1093/jnci/djn255. [DOI] [PMC free article] [PubMed] [Google Scholar]
- 2.Albertsen PC. A challenge to contemporary management of prostate cancer. Nat Clin Pract Urol. 2009;6(1):12–13. doi: 10.1038/ncpuro1270. [DOI] [PubMed] [Google Scholar]
- 3.Cookson MS, Fleshner NE, Soloway SM, Fair WR. Correlation between Gleason score of needle biopsy and radical prostatectomy specimen: accuracy and clinical implications. J Urol. 1997;157(2):559–562. [PubMed] [Google Scholar]
- 4.Fleshner NE, Cookson MS, Soloway SM, Fair WR. Repeat transrectal ultrasound-guided prostate biopsy: a strategy to improve the reliability of needle biopsy grading in patients with well-differentiated prostate cancer. Urology. 1998;52(4):659–662. doi: 10.1016/s0090-4295(98)00226-x. [DOI] [PubMed] [Google Scholar]
- 5.Podo F. Tumour phospholipid metabolism. NMR Biomed. 1999;12(7):413–439. doi: 10.1002/(sici)1099-1492(199911)12:7<413::aid-nbm587>3.0.co;2-u. [DOI] [PubMed] [Google Scholar]
- 6.Hara T, Kosaka N, Kishi H. PET imaging of prostate cancer using carbon-11-choline. J Nucl Med. 1998;39(6):990–995. [PubMed] [Google Scholar]
- 7.Kotzerke J, Prang J, Neumaier B, et al. Experience with carbon-11 choline positron emission tomography in prostate carcinoma. Eur J Nucl Med. 2000;27(9):1415–1419. doi: 10.1007/s002590000309. [DOI] [PubMed] [Google Scholar]
- 8.de Jong IJ, Pruim J, Elsinga PH, Vaalburg W, Mensink HJ. Visualization of prostate cancer with 11C-choline positron emission tomography. Eur Urol. 2002;42(1):18–23. doi: 10.1016/s0302-2838(02)00129-x. [DOI] [PubMed] [Google Scholar]
- 9.Sutinen E, Nurmi M, Roivainen A, et al. Kinetics of [(11)C]choline uptake in prostate cancer: a PET study. Eur J Nucl Med Mol Imaging. 2004;31(3):317–324. doi: 10.1007/s00259-003-1377-9. [DOI] [PubMed] [Google Scholar]
- 10.Scher B, Seitz M, Albinger W, et al. Value of (11)C-choline PET and PET/CT in patients with suspected prostate cancer. Eur J Nucl Med Mol Imaging. 2007;34(1):45–53. doi: 10.1007/s00259-006-0190-7. [DOI] [PubMed] [Google Scholar]
- 11.Krause BJ, Souvatzoglou M, Tuncel M, et al. The detection rate of [(11)C]Choline-PET/CT depends on the serum PSA-value in patients with biochemical recurrence of prostate cancer. Eur J Nucl Med Mol Imaging. 2008;35(1):18–23. doi: 10.1007/s00259-007-0581-4. [DOI] [PubMed] [Google Scholar]
- 12.Park H, Piert MR, Khan A, et al. Registration methodology for histological sections and in vivo imaging of human prostate. Acad Radiol. 2008;15(8):1027–1039. doi: 10.1016/j.acra.2008.01.022. [DOI] [PMC free article] [PubMed] [Google Scholar]
- 13.Laitinen S, Martikainen PM, Tolonen T, Isola J, Tammela TL, Visakorpi T. EZH2, Ki-67 and MCM7 are prognostic markers in prostatectomy treated patients. Int J Cancer. 2008;122(3):595–602. doi: 10.1002/ijc.23145. [DOI] [PubMed] [Google Scholar]
- 14.May M, Siegsmund M, Hammermann F, Loy V, Gunia S. Prognostic significance of proliferation activity and neuroendocrine differentiation to predict treatment failure after radical prostatectomy. Scand J Urol Nephrol. 2007;41(5):375–381. doi: 10.1080/00365590701224445. [DOI] [PubMed] [Google Scholar]
- 15.Aaltomaa S, Karja V, Lipponen P, et al. Expression of Ki-67, cyclin D1 and apoptosis markers correlated with survival in prostate cancer patients treated by radical prostatectomy. Anticancer Res. 2006;26(6C):4873–4878. [PubMed] [Google Scholar]
- 16.Herzog H, Tellmann L, Hocke C, Pietrzyk U, Casey M, Kuwert T. NEMA NU2-2001 guided performance evaluation of four Siemens ECAT PET-scanners. Nuclear Science Symposium Conference Record. IEEE. 2003;4:2836–2838. [Google Scholar]
- 17.Farsad M, Schiavina R, Castellucci P, et al. Detection and localization of prostate cancer: correlation of (11)C-choline PET/CT with histopathologic step-section analysis. J Nucl Med. 2005;46(10):1642–1649. [PubMed] [Google Scholar]
- 18.Meyer CR, Boes JL, Kim B, et al. Demonstration of accuracy and clinical versatility of mutual information for automatic multimodality image fusion using affine and thin-plate spline warped geometric deformations. Med Image Anal. 1997;1(3):195–206. doi: 10.1016/s1361-8415(97)85010-4. [DOI] [PubMed] [Google Scholar]
- 19.Shah R, Bassily N, Wei J, et al. Benign prostatic glands at surgical margins of radical prostatectomy specimens: frequency and associated risk factors. Urology. 2000;56(5):721–725. doi: 10.1016/s0090-4295(00)00775-5. [DOI] [PubMed] [Google Scholar]
- 20.Shah R, Mucci NR, Amin A, Macoska JA, Rubin MA. Postatrophic hyperplasia of the prostate gland: neoplastic precursor or innocent bystander? Am J Pathol. 2001;158(5):1767–1773. doi: 10.1016/S0002-9440(10)64132-6. [DOI] [PMC free article] [PubMed] [Google Scholar]
- 21.Mehra R, Han B, Tomlins SA, et al. Heterogeneity of TMPRSS2 gene rearrangements in multifocal prostate adenocarcinoma: molecular evidence for an independent group of diseases. Cancer Res. 2007;67(17):7991–7995. doi: 10.1158/0008-5472.CAN-07-2043. [DOI] [PubMed] [Google Scholar]
- 22.Fleming ID, Cooper JS, Henson DE. AJCC cancer staging manual. 5th. ed Lippincott, Raven; Philadelphia: 1998. [Google Scholar]
- 23.Hara T, Kosaka N, Shinoura N, Kondo T. PET imaging of brain tumor with [methyl-11C]choline. J Nucl Med. 1997;38(6):842–847. [PubMed] [Google Scholar]
- 24.Picchio M, Treiber U, Beer AJ, et al. Value of 11C-Choline PET and Contrast-Enhanced CT for Staging of Bladder Cancer: Correlation with Histopathologic Findings. J Nucl Med. 2006;47(6):938–944. [PubMed] [Google Scholar]
- 25.Hara T, Inagaki K, Kosaka N, Morita T. Sensitive detection of mediastinal lymph node metastasis of lung cancer with 11C-choline PET. J Nucl Med. 2000;41(9):1507–1513. [PubMed] [Google Scholar]
- 26.Reske SN, Blumstein NM, Neumaier B, et al. Imaging prostate cancer with 11C-choline PET/CT. J Nucl Med. 2006;47(8):1249–1254. [PubMed] [Google Scholar]
- 27.Giovacchini G, Picchio M, Coradeschi E, et al. [(11)C]choline uptake with PET/CT for the initial diagnosis of prostate cancer: relation to PSA levels, tumour stage and anti-androgenic therapy. Eur J Nucl Med Mol Imaging. 2008;35(6):1065–1073. doi: 10.1007/s00259-008-0716-2. [DOI] [PubMed] [Google Scholar]
- 28.Picchio M, Messa C, Landoni C, et al. Value of [11C]choline-positron emission tomography for re-staging prostate cancer: a comparison with [18F]fluorodeoxyglucose-positron emission tomography. J Urol. 2003;169(4):1337–1340. doi: 10.1097/01.ju.0000056901.95996.43. [DOI] [PubMed] [Google Scholar]
- 29.Reske SN, Blumstein NM, Glatting G. [(11)C]choline PET/CT imaging in occult local relapse of prostate cancer after radical prostatectomy. Eur J Nucl Med Mol Imaging. 2008;35(1):9–17. doi: 10.1007/s00259-007-0530-2. [DOI] [PubMed] [Google Scholar]
- 30.Glunde K, Bhujwalla ZM. Choline kinase alpha in cancer prognosis and treatment. Lancet Oncol. 2007;8(10):855–857. doi: 10.1016/S1470-2045(07)70289-9. [DOI] [PubMed] [Google Scholar]
- 31.Plathow C, Weber WA. Tumor cell metabolism imaging. J Nucl Med. 2008;49(Suppl 2):43S–63S. doi: 10.2967/jnumed.107.045930. [DOI] [PubMed] [Google Scholar]
- 32.Yoshimoto M, Waki A, Obata A, Furukawa T, Yonekura Y, Fujibayashi Y. Radiolabeled choline as a proliferation marker: comparison with radiolabeled acetate. Nucl Med Biol. 2004;31(7):859–865. doi: 10.1016/j.nucmedbio.2004.05.002. [DOI] [PubMed] [Google Scholar]
- 33.Janardhan S, Srivani P, Sastry GN. Choline kinase: an important target for cancer. Curr Med Chem. 2006;13(10):1169–1186. doi: 10.2174/092986706776360923. [DOI] [PubMed] [Google Scholar]
- 34.Breeuwsma AJ, Pruim J, Jongen MM, et al. In vivo uptake of [(11)C]choline does not correlate with cell proliferation in human prostate cancer. Eur J Nucl Med Mol Imaging. 2005 doi: 10.1007/s00259-004-1741-4. [DOI] [PubMed] [Google Scholar]
- 35.Wang L, Mazaheri Y, Zhang J, Ishill NM, Kuroiwa K, Hricak H. Assessment of biologic aggressiveness of prostate cancer: correlation of MR signal intensity with Gleason grade after radical prostatectomy. Radiology. 2008;246(1):168–176. doi: 10.1148/radiol.2461070057. [DOI] [PubMed] [Google Scholar]
- 36.Zakian KL, Sircar K, Hricak H, et al. Correlation of proton MR spectroscopic imaging with gleason score based on step-section pathologic analysis after radical prostatectomy. Radiology. 2005;234(3):804–814. doi: 10.1148/radiol.2343040363. [DOI] [PubMed] [Google Scholar]
- 37.Meyer CR, Wahl RL. Image fusion. In: Wahl RL, editor. Priciples and practice of PET and PET/CT. 2. edition Lippincott, Williams and Wilkins; Philadelphia: 2009. pp. 111–116. [Google Scholar]
- 38.Aston JA, Cunningham VJ, Asselin MC, Hammers A, Evans AC, Gunn RN. Positron emission tomography partial volume correction: estimation and algorithms. J Cereb Blood Flow Metab. 2002;22(8):1019–1034. doi: 10.1097/00004647-200208000-00014. [DOI] [PubMed] [Google Scholar]
- 39.Albertsen PC, Hanley JA, Fine J. 20-year outcomes following conservative management of clinically localized prostate cancer. Jama. 2005;293(17):2095–2101. doi: 10.1001/jama.293.17.2095. [DOI] [PubMed] [Google Scholar]
- 40.Dall’Era MA, Cooperberg MR, Chan JM, et al. Active surveillance for earlystage prostate cancer: review of the current literature. Cancer. 2008;112(8):1650–1659. doi: 10.1002/cncr.23373. [DOI] [PubMed] [Google Scholar]