

Abstract
Most eukaryotic cells have a primary cilium which acts as a sensory organelle1. Cilia are assembled by intraflagellar transport (IFT), a process mediated by multimeric IFT particles and molecular motors2. Here we show that lymphoid and myeloid cells, which lack primary cilia, express IFT proteins. IFT20, an IFT component essential for ciliary assembly3,4, was found to colocalize with both the MTOC and Golgi and post-Golgi compartments in T-lymphocytes. In antigen-specific conjugates, IFT20 translocated to the immune synapse (IS). IFT20 knockdown resulted in impaired TCR/CD3 clustering and signaling at the IS due to defective polarized recycling. Moreover, IFT20 was required for the inducible assembly of a complex with other IFT components (IFT57, IFT88) and the TCR. The results identify IFT20 as a novel regulator of IS assembly in T-cells and provide the first evidence that IFT is implicated in membrane trafficking in cells lacking primary cilia, thereby opening a new perspective on IFT function beyond its role in ciliogenesis.
When naive T-cells encounter antigen presenting cells (APC) bearing cognate MHC-bound peptide antigen, a dynamic rearrangement of membrane and cytosolic molecules occurs at the T-cell:APC contact area. This results in the formation of a highly organized interface known as immune synapse (IS), which acts as a platform for signal integration, fine-tuning and extinction5,6. A hallmark of the nascent IS is reorientation of the microtubule organizing center (MTOC) towards the APC7, which ensures targeted delivery of signaling molecules from intracellular pools to the IS8. This includes the TCR/CD3 complex itself, which is carried to the IS through polarized recycling9. Directional movement of structural and regulatory molecules, orchestrated by the MTOC, is a characteristic feature of primary cilia. These structures, present on most non-dividing cells, act as sensory organelles, relaying information from the external environment into the cell through intraflagellar transport (IFT), a process carried out by multimeric IFT particles and molecular motors2,10.
At variance with most other eukaryotic cell types, hematopoietic cells lack primary cilia10. Surprisingly, IFT20, an IFT component essential for ciliary assembly3,4, was found to be expressed in human cells of both lymphoid (peripheral blood lymphocytes, Jurkat T-lymphoma cells) and myeloid (monocytes, monocyte-derived DC) lineages (Fig.1a). Similar results were obtained in the mouse, where IFT20 was detectable in central (thymus, bone marrow) and peripheral (lymph node, spleen) lymphoid organs (Fig.1a). Immunofluorescence analysis of Jurkat cells and human peripheral blood lymphocytes (PBL) showed that IFT20 was localized in a discrete cytosolic region centered around the MTOC (Fig.1b for Jurkat cells; Supplementary Information, Fig.S1a online for PBL), which duplicated at early prophase (not shown). No IFT20 staining was detectable during metaphase and anaphase, with the exception of two small punctate structures corresponding to the MTOCs (Fig.1b–d), as confirmed by costaining with anti-γ-tubulin antibodies (Fig.1c,d), as well as by the pattern of IFT20 staining in cells extracted with Triton X-100 to solubilize cell membranes (Supplementary Information, Fig.S1b online). At late telophase and cytokinesis IFT20 reassembled in the larger structure surrounding the MTOC (Fig.1b). Excluding the staining corresponding to the MTOC(s) (~40% colocalization), the pattern of IFT20 localization is indicative of the Golgi, which undergoes fragmentation during mitosis. Costaining of Jurkat cells with antibodies specific for Golgi markers or other membrane compartments showed that IFT20 colocalizes to a significant extent (~60%) with the cis-Golgi (identified by GM130) (Fig.1c,d). Treatment of Jurkat cells with brefeldin-A, which induces Golgi fragmentation, resulted in a largely similar dissipation of Golgi- and IFT20-specific immunostaining (Supplementary Information, Fig.S1c online), further supporting the Golgi association of IFT20. IFT20 was found to also colocalize, albeit to a more limited extent, with the trans-Golgi network (identified by TGN46; ~23%), recycling endosomes (identified by TfR; ~19%) and early endosomes (identified by EEA1; ~16%), while minimal colocalization with lysosomes (identified by LAMP-1; <10%) was detected (Fig.1c,d). Hence IFT20 is expressed in T-lymphocytes where it colocalizes with both Golgi and MTOC, similar to ciliated cells10, notwithstanding the absence of a primary cilium. Moreover, IFT20 associates, albeit to a lesser extent, with other membrane compartments implicated in protein trafficking.
Figure 1. IFT20 is expressed in T cells and associates with Golgi apparatus and MTOC.

a. Immunoblot analysis of IFT20 in lysates of human and murine lymphoid and myeloid cells. PBL, peripheral blood lymphocytes; T, T-cells; B, B-cells; M, monocytes; J, Jurkat cells; DC, dendritic cells; SPL, spleen; LN, lymph node; Thy, thymus; BM, bone marrow; Ts, testis (positive control). b,c. Immunofluorescence analysis of IFT20 localization in Jurkat cells costained with antibodies against (b) β-tubulin or (c) γ-tubulin or markers of membrane compartments. Panel b shows cells in interphase (top), metaphase (middle) and telophase (bottom). In panel c, GM130, cis-Golgi; TGN46, trans-Golgi network; TfR, recycling endosomes; EEA1, early endosomes; LAMP-1, lysosomes. Z-stack projections are shown. The white box in the merge images represents the field of view for the 3D reconstructions based on sequential 0.5 µm sections shown on the last panel of each row. The corresponding animations are shown in the supplemental online information (Movie 1–Movie 6). d. Quantification of the weighted colocalization (as percentage) of the different subcellular organelles/compartments with the IFT20 staining (mean ±SD). 30 cells were analyzed for each marker. All of the pairwise comparisons of the IFT20 colocalisions with the GM130, TGN46, TfR, EEA1, LAMP-1 and γ-tubulin were statistically significant (p<0.01 at least) with only two exceptions being: TGN46 vs TfR and TfR vs EEA1.
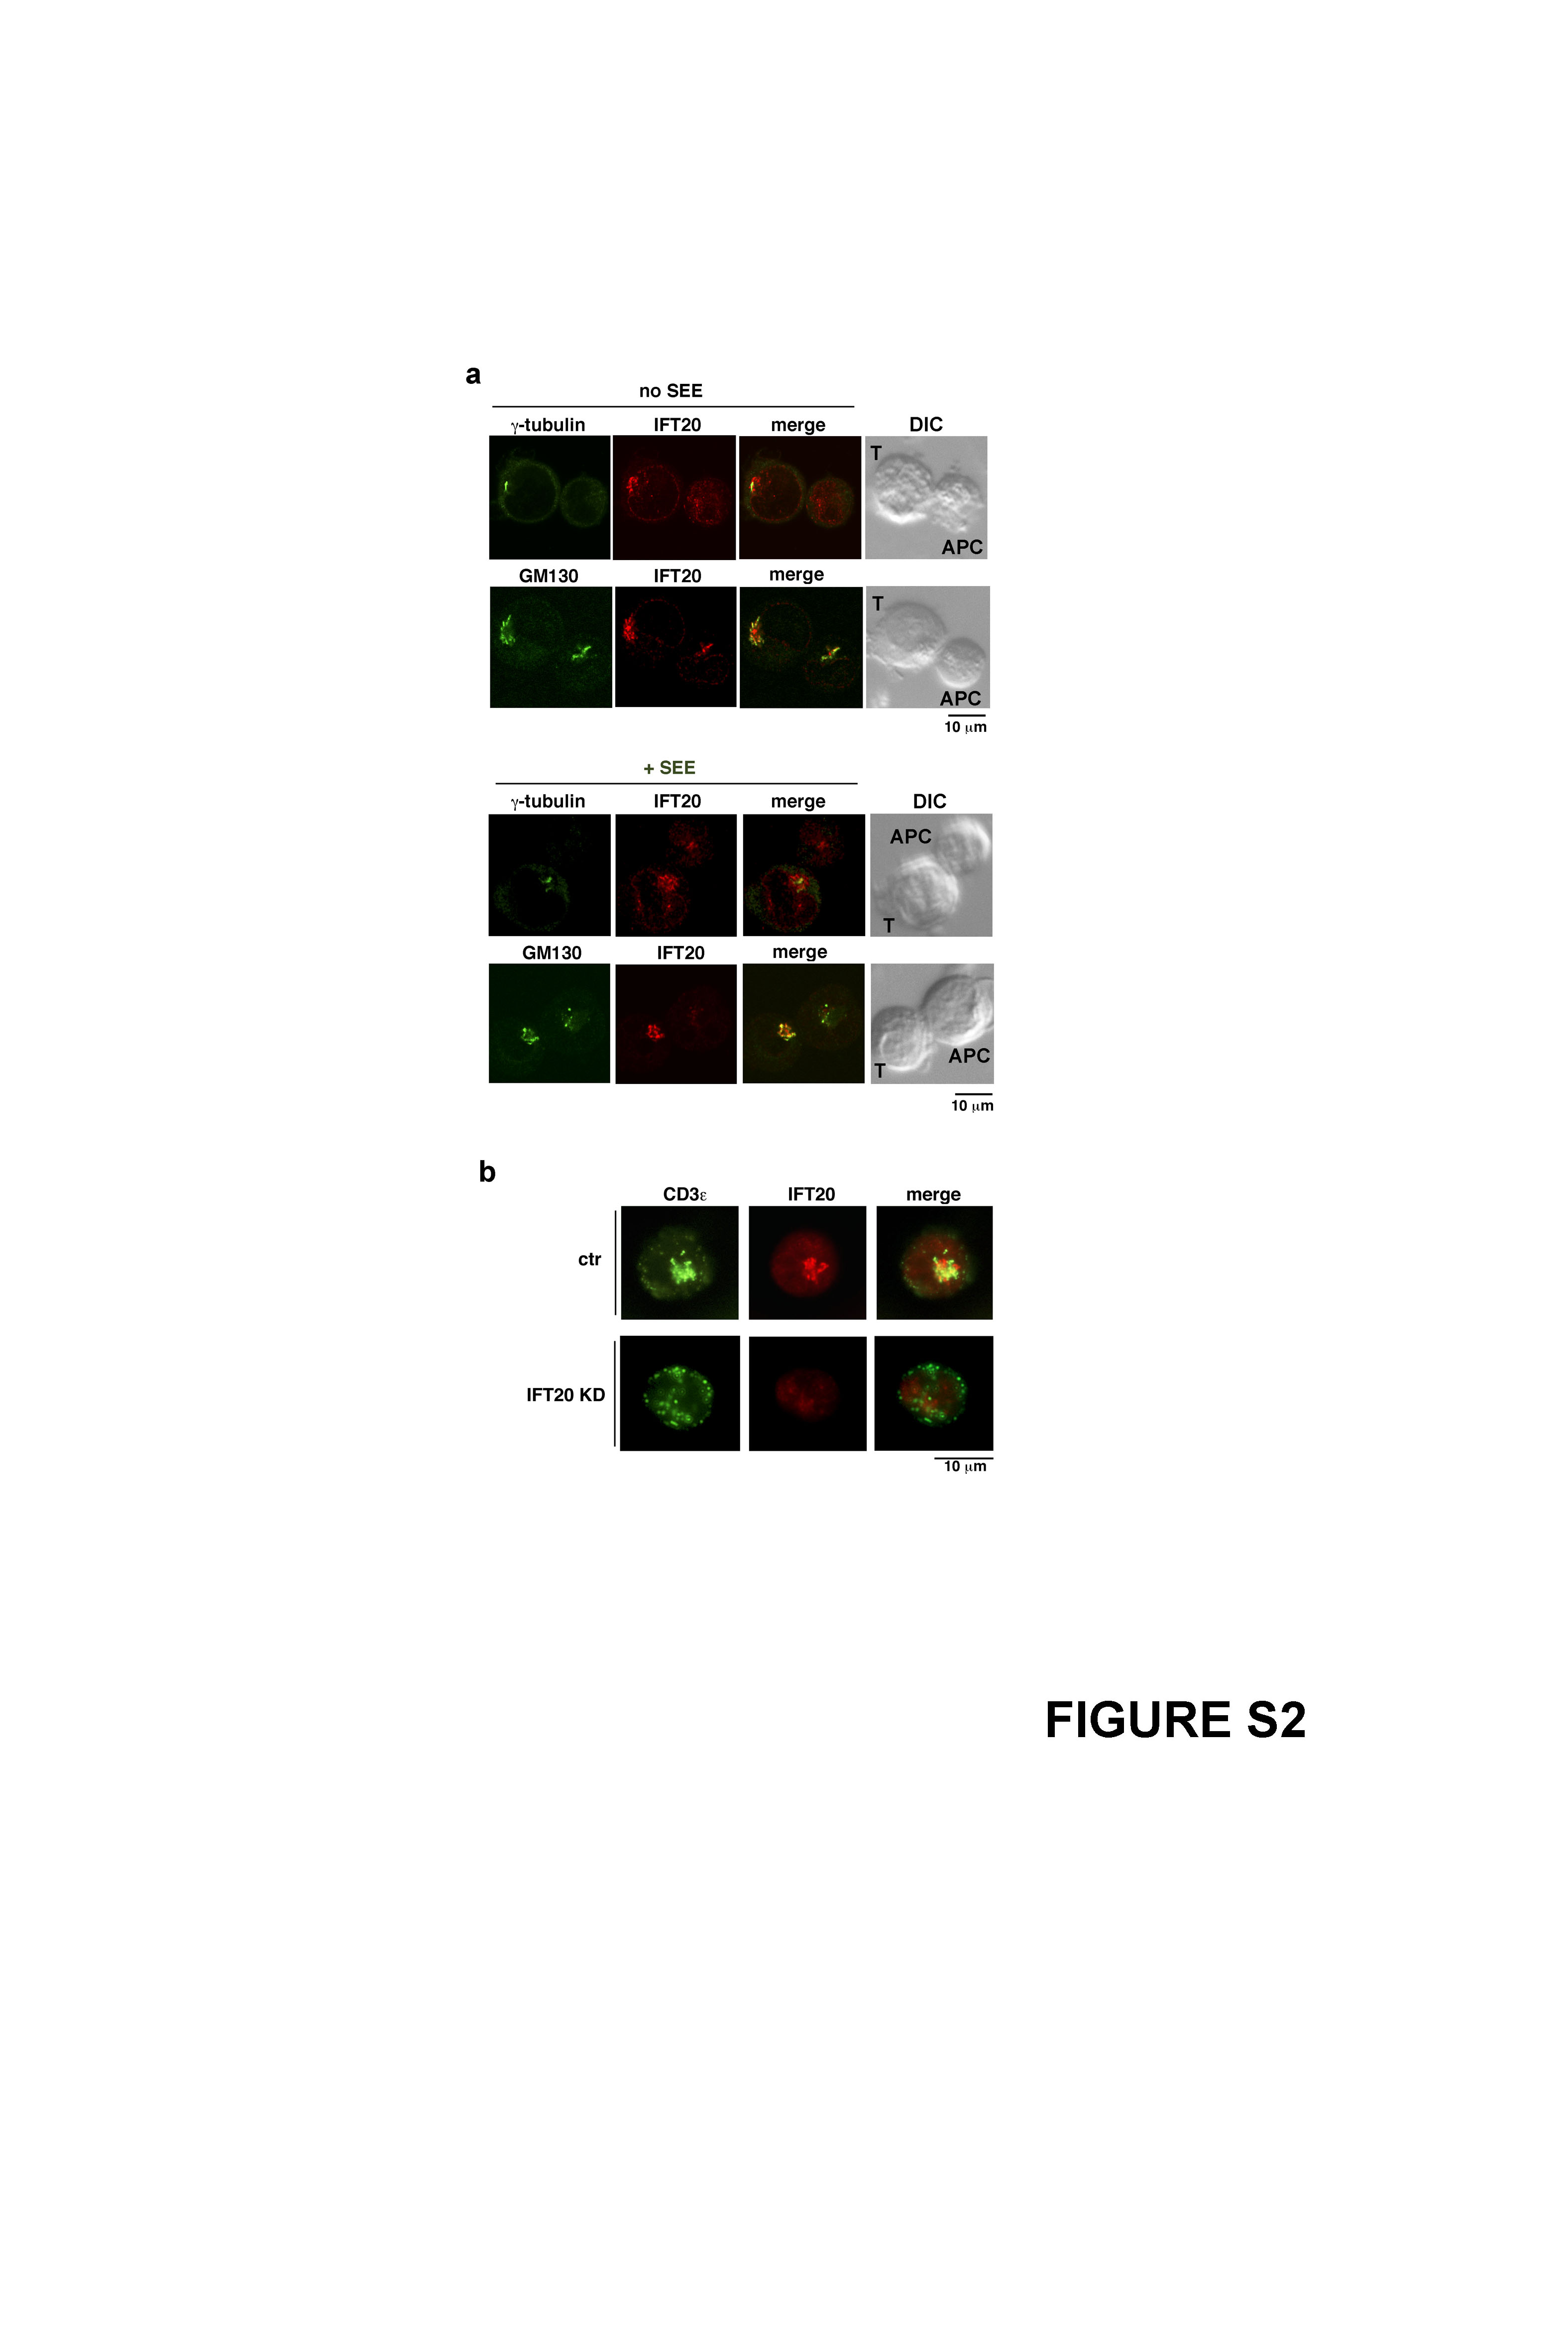
Among the most dramatic events in IS formation is the translocation of MTOC and Golgi to the contact area between T-cell and APC7. Based on the association of IFT20 with both organelles, we analyzed the localization of IFT20 in conjugates of Jurkat T-cells and Raji B-cells (used as APC) loaded with staphyloccal enterotoxin E (SEE). IFT20 was found to translocate to the IS, together with MTOC and Golgi, in Jurkat cells exposed to SEE-loaded APC (Fig.2a,b; Supplementary Information, Fig.S2a online). As expected, the TCR/CD3 complex clustered at the IS concomitant with MTOC and Golgi reorientation (Fig.2a,b). Similar results were obtained following capping of the TCR/CD3 complex using an anti-CD3 mAb and secondary antibodies (Supplementary Information, Fig.S2b online), a procedure which results in TCR/CD3 clustering and MTOC/Golgi reorientation under the TCR cap11. IFT20 translocation to the IS in antigen-specific conjugates was also observed in T cells purified from healthy donors (Fig.2f). Interestingly, IFT20 not only clustered at the IS together with the TCR, but also inducibly associated with the receptor complex (CD3ζ, CD3ε) in response to TCR engagement (Fig.2c). No association with the adaptor LAT, which also localizes at the IS, was detected (data not shown), underscoring the specificity of the IFT20/CD3 interaction.
Figure 2. IFT20 is required for TCR/CD3 clustering and signaling at the IS.

a. Immunofluorescence analysis of IFT20 and CD3ζ localization in conjugates of Jurkat cells and APC, in the presence or absence of SEE. Median optical sections are shown. b. Relative IFT20 and CD3ζ fluorescence at the T-cell:APC contact site compared to the remaining T-cell membrane (CD3ζ) or T-cell area (IFT20) (expressed as relative recruitment index). Measurements on conjugates from ≥3 independent experiments (n=50). Error bars, SD. c. Immunoblot with anti-CD3ζ and -CD3ε antibodies of IFT20-specific immunoprecipitates from lysates of Jurkat cells either unstimulated or stimulated with anti-CD3 mAb for 5–10 min (whole blot in Fig.S6a). d. Top left, Immunoblot of IFT20 in lysates of Jurkat cells, a Jurkat line transfected with empty vector (ctr), and three Jurkat clones (cl1-3) transfected with constructs encoding IFT20-specific siRNA (KD) (whole blot in Fig.S6b; all samples on the same gel). A pool (pl) of the three IFT20-KD clones (IFT20 reduction in the pool ~75%) was used for subsequent experiments. Right, Immunofluorescence analysis of SEE-specific conjugates of control or IFT20-KD Jurkat cells and APC. Cells were costained with anti-γ-tubulin and -GM130 antibodies. Bottom right, Mean distance±SD of the MTOC and of the central point of the cis-Golgi from the T-cell:APC contact site. Measurements on conjugates from ≥3 independent experiments (n=50). e,f. Immunofluorescence analysis of SEE-specific conjugates of control or IFT20-KD Jurkat cells and APC (e) or of SEB/SEE-specific conjugates using peripheral T-cells transiently transfected with empty vector or the IFT20 RNAi construct (IFT20 reduction ~40%, ~80% and ~70% for donors 1–3, respectively, as assessed by immunoblot) (f). Cells were costained with anti-IFT20 and either anti-CD3ζ or anti- PTyr antibodies. g,h. Relative CD3ζ or PTyr fluorescence at the T-cell:APC contact site compared to the remaining T-cell membrane (CD3ζ) or T-cell area (PTyr) (expressed as relative recruitment index) in Jurkat cells (g) and T-cells from healthy donors (h). Measurements on conjugates from ≥3 independent experiments for Jurkat cells (n=50), or on conjugates from duplicate samples from 3 independent donors for peripheral T-cells (n=30, 10/donor).
To assess the potential role of IFT20 in IS formation, IFT20 expression was stably knocked down (KD) in Jurkat cells by RNA interference (Fig.2d). A transfectant generated with empty vector was used as control. Both MTOC and Golgi translocated to the IS in IFT20-KD cells stimulated with SEE-loaded APC, similar to control cells (Fig.2d). However, CD3ζ immunostaining revealed that clustering of the TCR/CD3 complex at the IS was impaired in these cells (Fig.2e,g). The number of conjugates with TCR clustering at the IS was moreover significantly reduced (IFT20-KD cells 41%, n=128, vs control cells 70%, n=111). Similar results were obtained when CD3ε was immunostained (Supplementary information, Fig.S3a online). A similar pattern was observed when T-cells were coincubated for longer times with antigen-loaded APC (data not shown), ruling out a delay in TCR clustering at the IS. Consistent with these findings, TCR/CD3 cross-linking resulted in impaired receptor capping (Supplementary Information, Fig.S2b online). The defect in TCR/CD3 clustering at the IS in antigen-specific conjugates was also observed in T cells purified from healthy donors and transiently knocked down for IFT20 expression (Fig.2f,h; Supplementary Information, Fig.S3d,e online).
Clustering at the IS is required to bring the TCR close to the tyrosine kinase Lck, which phosphorylates conserved motifs in the intracellular domains of the CD3 complex. These recruit the tyrosine kinase ZAP-70, which becomes activated and phosphorylates key protein substrates to initiate TCR signaling12. To assess the outcome of IFT20-KD on signaling by the TCR at the IS, SEE-specific conjugates were immunostained with anti-phosphotyrosine antibodies. Compared to control cells, where strong and localized staining at the IS was observed in a large proportion of conjugates (75%, n=139), a smaller proportion of IFT20-KD cells (38%, n=161) harbored phosphotyrosine staining at the IS. Staining was, moreover, significantly different, appearing weaker and dispersed through the cell (Fig.2e,g). Similar results were obtained on peripheral T cells transiently knocked down for IFT20 expression (Fig.2f,h; Supplementary Information, Fig.S3e online). Since tyrosine kinase activation occurs at the cell surface in response to TCR engagement, the data suggest a rapid dissociation of phosphorylated proteins from the IS. Consistent with this finding, both the extent and duration of tyrosine phosphorylation was reduced in IFT20-KD cells, as assessed by immunoblot analysis of cell lysates (Supplementary Information, Fig.S3b online). Moreover, signaling was not productive, as assessed by defective upregulation of the surface activation marker CD69 in response to TCR engagement in IFT20-KD cells (Supplementary Information, Fig.S3c online).
Clustering of the TCR/CD3 complex at the IS is achieved through a combination of lateral diffusion, cytoskeleton-driven movement and polarized recycling5. The IFT20 association with both Golgi and post-Golgi compartments suggests a potential role of this protein in intracellular trafficking of the TCR/CD3 complex. To address this issue the proportion of cellular CD3 detectable at the cell surface was measured by flow cytometric analysis of intact and permeabilized cells. While the total levels of CD3 were similar in control and IFT20-KD cells, less surface CD3 was expressed in IFT20-KD cells compared to controls, resulting in a lower ratio of surface vs total CD3 in IFT20-KD cells (Fig.3a; Supplementary Information, Fig.S4a online). Conversely, no alteration in the ratio of surface vs total receptor was observed either for the chemokine receptor CXCR4 (Fig.3a) or for CD69 (not shown). These data suggest a role of IFT20 in membrane trafficking of the TCR/CD3 complex.
Figure 3. IFT20 is required for trafficking of the TCR/CD3 complex in recycling endosomes.

a. Representative FACS profiles and relative levels of CD3 in intact (surface CD3) vs permeabilized (total CD3) control/IFT20-KD Jurkat cells (n≥9). Data from similar experiments are shown for CXCR4 (right; n≥5). b. Relative levels of surface CD3 in control/IFT20-KD cells untreated, or treated with PDBu for 1h, or treated with PDBu then washed and incubated at 37°C for the indicated times. A representative experiment is shown (n=4). c. Relative levels of surface CD3 in control/IFT20-KD cells untreated, or incubated at 20°C for 16h, or incubated at 20°C then shifted to 37°C for 4h. Receptor expression was measured by flow cytometry, and calculated on the MFI levels (n=3). Surface CD3 recovery was 88.8% in control vs 8.3% in IFT20-KD (p=0.019). Error bars, SD. d. Immunofluorescence analysis of IFT20 and TfR localization in conjugates of control or IFT20-KD Jurkat cells and APC, either unpulsed or pulsed with SEE. Median optical sections are shown. The graph on the right shows the relative TfR fluorescence at the the T-cell:APC contact site compared to the remaining T-cell area (expressed as relative recruitment index). Error bars, SD. The measurements were taken on ≥50 conjugates from ≥3 independent experiments, respectively. e. Immunofluorescence analysis with anti-TfR and anti-IFT20 antibodies of TfR localization in SEB-specific conjugates using SEB-specific peripheral T-cells from a representative healthy donor transiently transfected with either empty vector or the IFT20 RNAi construct (n=3).
Assembly of the TCR/CD3 complex is initiated in the ER and completed in the Golgi, wherefrom it moves to the cell surface via the canonical exocytic route. Once exposed, the TCR/CD3 complex undergoes multiple rounds through the constitutive recycling pathway, which involves a di-leucine motif in the CD3γ cytosolic tail, before being targeted for degradation13. The rates of both de novo synthesis and constitutive endocytosis leading to degradation are very low, indicating that in resting cells surface TCR expression is principally dependent on TCR recycling13,14. To address the potential role of IFT20 in this process, we capitalized on the capacity of phorbol esters to activate a pathway which depends on PKC-mediated activation of the CD3γ di-leucine motif and leads to TCR recycling13. Control and IFT20-KD cells were treated with PDBu for 1h, which resulted in ~40% TCR internalization. The time course of surface CD3 recovery after PDBu removal was monitored by flow cytometry. In contrast with control cells, which readily recovered surface CD3, no increase in surface CD3 was detected in IFT20-KD cells (Fig.3b), suggesting that, while IFT20 is dispensable for internalization of the TCR/CD3 complex, it is required for TCR/CD3 recycling back to the cell surface. To further address this point, control and IFT20-KD cells were incubated for 16h at 20°C to block trafficking through constitutively recycling endosomes, which resulted in ~40% reduction of surface CD3, then shifted to 37°C for 4h. The 37°C shift resulted in recovery of surface CD3 in control, but not in IFT20-KD cells (Fig.3c). No changes in total CD3 were observed after either the 20°C block or the 37°C shift (Supplementary Information, Fig.S4b online). Ligand-dependent TCR endocytosis, while activating an alternative pathway which leads to receptor degradation in lysosomes13, was also not affected by IFT20-KD, as measured in a time course analysis of TCR internalization (Supplementary Information, Fig.S4c online), further ruling out endocytosis defects. Collectively, these data support the notion that IFT20 controls TCR/CD3 exocytosis through the constitutive recycling pathway. Recycling endosomes have been demonstrated to polarize to the IS, thereby providing a means of TCR/CD3 enrichment at this location9. Strikingly, as opposed to control cells, recycling endosomes failed to polarize to the IS both in IFT20-KD Jurkat cells (Fig.3d; Supplementary Information, Fig.S5 online) and in peripheral T cells transiently knocked down for IFT20 expression (Fig.3e), indicating that IFT20 is required for polarized TCR/CD3 recycling.
In primary cilia IFT20 participates in complex-B, one of the two multiprotein complexes forming the IFT particle1,2. To understand whether IFT20 interacts with other IFT components in the absence of primary cilia, T-cells were tested by immunoblot for expression of other complex-B components. Both human and murine cells were found to express IFT88 and IFT57, as well as the kinesin Kif3a, the motor powering anterograde IFT (Fig.4a). Coimmunoprecipitation experiments revealed the existence of an IFT20-IFT88-IFT57 complex, which was enhanced in response to TCR engagement (Fig.4b). Similar to IFT20, IFT88 and IFT57 inducibly interacted with the TCR/CD3 complex in response to stimulation (Fig.4b). Moreover, immunofluorescence analysis showed that IFT57, which was found to colocalize to a significant extent with IFT20 in resting cells (Fig.4c), clustered with the TCR and IFT20 at the IS (Fig.4d). Remarkably, both the association of IFT88 with IFT57, and their interaction with the TCR/CD3 complex, were impaired in IFT20-KD cells (Fig.4b). Furthermore, IFT57 was not recruited to the IS in IFT20-KD cells (Fig.4d,e). Of note, similar to the results obtained on IFT20-KD cells, transient knockdown of Kif3a by RNA interference resulted in defective antigen-specific conjugate formation (73.4% control cells, n=79 vs 50.3% Kif3a-KD cells, n=145) and impaired T-cell activation, as shown by the reduction in TCR-dependent CD69 expression (Fig.4f). Taken together, these data indicate that IFT20 drives the assembly of IFT-like particles in T-lymphocytes in response to TCR engagement and support the notion that IFT20 acts in concert with other IFT components in IS formation and T-cell activation.
Figure 4. IFT20 inducibly associates with other IFT components in response to TCR triggering.

a. Immunoblot analysis of IFT88, IFT57 and Kif3a in human and murine lymphoid and myeloid cell lysates (samples on the same gel). Abbreviations are as in Figure1a. b. Immunoblot analysis with the indicated antibodies of anti-IFT57 (left) or anti-IFT88 (right) specific immunoprecipitates from lysates of Jurkat cells either unstimulated or stimulated with anti-CD3 mAb for 10 min (whole blots in Fig.S6c,d). A mouse testis lysate was included in each gel as control (not shown). c. Immunofluorescence analysis of IFT57 and IFT20 localization in Jurkat cells. A Z-stack projection is shown. The white box in the merge image represents the field of view for the 3D reconstruction based on sequential 0.5 µm sections shown on the last panel. The corresponding animation is shown in the Supplemental Information (Movie 7). Weighted colocalization (as percentage) with the IFT20 staining was 42.0 ±7.4 (n=30). d. Immunofluorescence analysis of IFT57 and IFT20 localization in conjugates of control or IFT20-KD Jurkat cells and APC, in the presence or absence of antigen (SEE). Cells were costained with antibodies against CD3ζ. Median optical sections are shown. e. Relative IFT57 fluorescence at the T-cell:APC contact site compared to the remaining T-cell area (expressed as relative recruitment index). Error bars, SD. Measurements were taken on 30 conjugates for each condition. f. Percentages of CD69+ control or Kif3a-KD Jurkat cells following stimulation by CD3 cross-linking for 8h, as assessed by flow cytometric analysis of surface CD69. The values of duplicate samples from a representative experiment out of 3 are shown. Error bars, SD. An anti-Kif3a immunoblot of lysates of control and Kif3a-KD Jurkat cells is shown (samples on the same gel).
T-cell commitment to activation requires sustained TCR signaling15. MTOC-driven polarization to the IS of TCR/CD3 complexes localized in the constitutive recycling compartment represents one of the principal means whereby fresh supplies of receptor are mobilized to the IS as engaged receptors are internalized and targeted to lysosomes for degradation9. Our data show that IFT20 contributes to the formation of a functional IS by regulating TCR/CD3 recycling (Fig.5). The inducible physical association of IFT20, IFT88 and IFT57 with the TCR/CD3 complex following receptor engagement suggests that, in response to a signal triggered by surface TCR complexes initially clustered to the IS through lateral diffusion and F-actin dependent movement5, IFT20 may assist, as a complex with IFT88 and IFT57, in delivering to the IS TCR complexes localized in constitutively recycling endosomes as the MTOC polarizes towards the T cell:APC contact site.
Figure 5. Schematic representation of the localization and function of IFT20 in TCR/CD3 trafficking and IS formation.
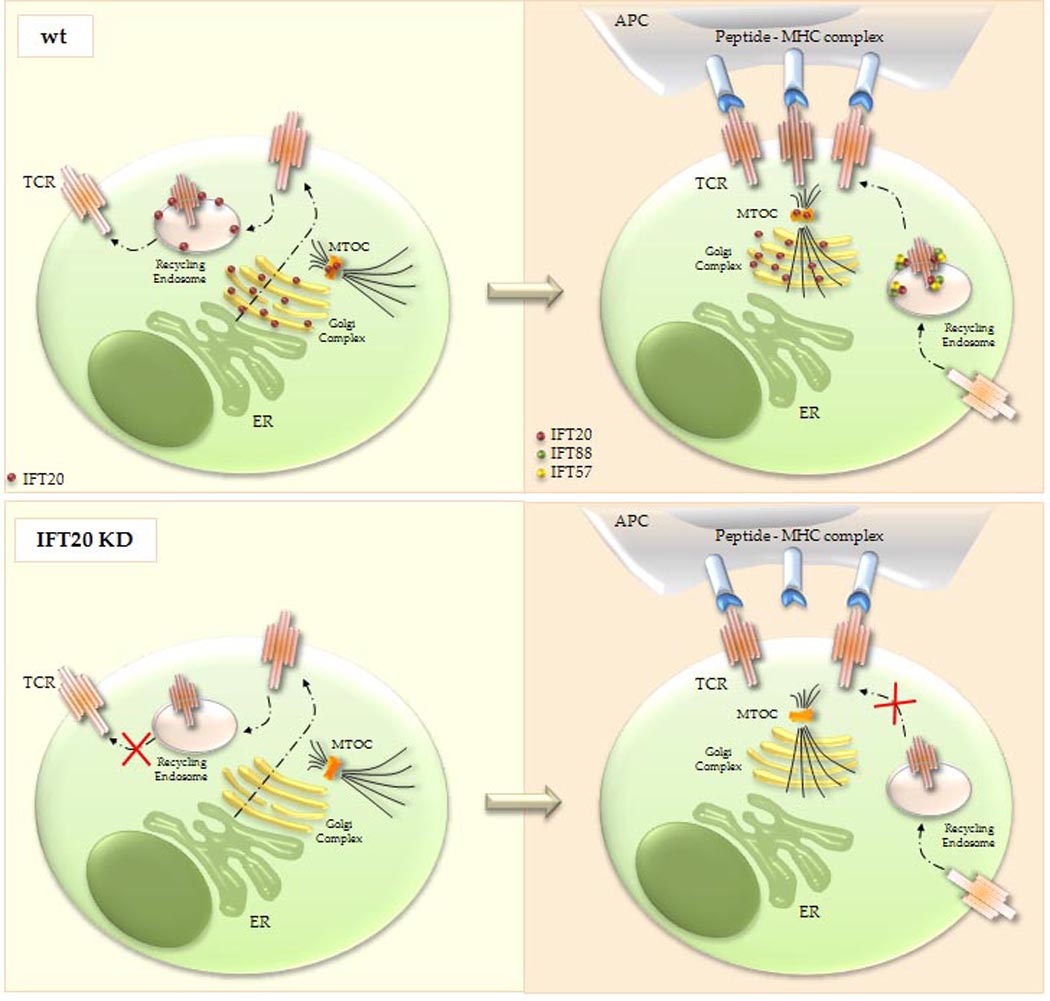
Top, In resting T cells IFT20, which is associated with the Golgi complex, the microtubule-organizing center (MTOC) and recycling endosomes, regulates constitutive T-cell antigen receptor (TCR) recycling to the cell surface (left). When the TCR is engaged by cognate peptide antigen presented by MHC on the surface of an antigen-presenting cell (APC), IFT20 promotes TCR clustering at the immune synapse through polarized recycling, as a complex with IFT57 and IFT88 (right). Bottom, In the absence of IFT20 both constitutive TCR recycling (left) and polarized TCR recycling to the immune synapse (right) are impaired. Translocation of the Golgi and MTOC to the immune synapse is conversely not affected by the absence of IFT20. ER, endoplasmic reticulum.
Based on the structural similarities of IFT components with COPI proteins16, which are involved in exocytosis and endosome function17, it has been hypothesized that IFT evolved as a specialized form of coated vesicle transport. In this model, coated vesicle transport from the Golgi defined a new plasma membrane domain, which then evolved to become the modern cilium16. This idea is supported by the finding that in ciliated cells IFT20 is not only localized to cilia and peri-basal body region, like the other IFT polypeptides, but is also linked to the Golgi through the golgin GMAP2103,18, suggesting that it may act as an adaptin in coupling to the IFT particle vesicles containing membranous protein cargo protein destined to the cilium. Our data strengthen this hypothesis by providing the first evidence that in cells lacking cilia, such as T-lymphocytes, an IFT-like particle, whose assembly is driven by IFT20 in response to extracellular cues, is integrated in the membrane trafficking pathways to orchestrate central processes, such as signaling at the IS. In these cells the membrane patch at the IS, with the underlying MTOC, would represent the functional homologue of the primary cilium. This specialized membrane patch would transiently and inducibly assemble to coordinate the rapid movement of specific membranous cargo -the TCR/CD3 complex- towards the contact site with the APC. A major general implication of these data is that IFT proteins may participate in intracellular membrane trafficking in all eukaryotic cells in addition to their well established roles in ciliary assembly. In this respect, the association of defects in IFT motors and particles with human diseases such as polycystic kidney disease, situs inversus and retinal degeneration19, which have been attributed to impaired ciliogenesis, may need to be revised in the wider context of intracellular protein trafficking.
Methods
Cells, plasmids, antibodies and reagents
Cell lines included Jurkat T-cells and Raji B-cells, both of human origin. Stable IFT20 knockdown Jurkat transfectants were generated as described20 using two pGP676.13 plasmid constructs containing the complementary oligonucleotides corresponding to the coding region of human IFT203. Human Kif3a specific siRNAs (5'-GCCUAAAGGAAGCUACAAA-3' and 5'-UUUGUAGCUUCCUUUAGGC-3', Sigma-Aldrich, The Woodlands, TX) were transfected by electroporation and assays carried out after 72 h.
Human peripheral blood mononuclear cells (PBMC) were purified from whole blood by density gradient centrifugation on Ficoll-Paque (Amersham Pharmacia Italia srl, Milan, Italy) and subsequently depleted of monocytes by adherence. T- and B-cells were purified from monocyte-depleted PBMC, respectively by negative or positive selection, by immunomagnetic sorting, using anti-CD19 antibody-conjugated beads (Dynal Biotech, Oslo, Norway) and checked for purity (consistently > 90%) by flow cytometry with fluorochrome-conjugated anti-CD3/anti-CD19 mAbs. Peripheral T cells, purified with the StemSep Human T cell enrichment kit (Voden medical Instruments SpA, Milan, Italy), were transfected with the same plasmids used for Jurkat cells using the Amaxa nucleofector device (Amaxa Biosystems, Cologne, Germany) and the conditions for T-cell transfection recommended by the manufacturer. Cells were analyzed 24 h and 48 h post-transfection. For the TfR labeling experiments SEB-specific T cells were expanded before transfection as described9. Dendritic cells were derived from peripheral blood monocytes from healthy donors as described21. Mouse cells were derived from 129sv mice (Charles River Italia, Calco, Italy). Mice were killed by cervical dislocation and thymus, lymph nodes, spleen, bone marrow and testis were collected. Single-cell suspensions were prepared from using cell strainer filters (BD Falcon; BD Biosciences Europe, Erembodegem, Belgium). Bone marrow was obtained from femurs by flushing with RPMI supplemented with 7.5% fetal calf serum, and single-cell suspensions were prepared by gentle pipetting. Animal experiments were done in agreement with the Guiding Principles for Research Involving Animals and Human Beings and approved by the local ethics committees.
Polyclonal anti-IFT20, -IFT57 and -IFT88 antibodies were previously described22. Anti-TfR mAb (hybridoma OKT9) was generously provided by A. Alcover. Anti-CXCR4 antibodies were kindly provided by J. Hoxie, Leukosite and the MRC AIDS Reagent Project. IgG from OKT3 (anti-CD3; American Type Culture Collection, Manassas, VA) hybridoma supernatants were purified using Mabtrap (Amersham Biosciences, Inc.) and titrated by flow cytometry. Anti-Kif3a antibodies were purchased from Sigma-Aldrich; anti-phosphotyrosine and anti-LAT antibodies from Upstate Biotechnology Inc. (Temecula, CA); anti-CD3ε, anti-CD3ζ mAb from Santa Cruz Biotechnology (Santa Cruz, CA); anti-LAMP-1 mAb from Developmental Studies Hybridoma Bank (Iowa City, IO); anti-actin mAb from Chemicon International Inc. (Temecula, CA); anti-GM130 and anti-EEA1 mAb from BD Biosciences (San Jose, CA); anti-γ-tubulin from Sigma (Milan, Italy); anti-β-tubulin from Boehringer (Milan, Italy); anti-TGN46 from AbD Serotec (Oxford, UK). Unlabeled secondary antibodies were purchased from Cappel (ICN Pharmaceuticals Inc, CA), and secondary peroxidase-labeled antibodies from Amersham Pharmacia Biotech. Alexa Fluor 488- and 555-labeled secondary antibodies were from Molecular Probes (Invitrogen srl, Milan, Italy), FITC-conjugated anti-mouse Ig from DAKO (Glostrup, Denmark). FITC or PE-labeled anti-human CD69, CD3, CD19 were purchased from BD Biosciences.
Staphylococcal enterotoxin B (SEB) and E (SEE) was purchased from Toxin Technology (Sarasota, FL), Cell Tracker Blue from Molecular Probes (Eugene, OR), poly-L-lysine, phorbol 12,13-dibutyrate (PDBu) and Brefeldin-A from Sigma (Milan, Italy).
Golgi extraction
For the Golgi extraction, Jurkat cells were plated on polylysine-coated wells of diagnostic microscope slides (Erie Scientific Company, Portsmouth, NH), where they were allowed to adhere for 15 min. After adhesion cells were pre-extracted with PBS containing 0.1% Triton X-100 for 30 s and fixed 10 min in methanol at −20°C. Alternatively, cells were treated with 10 µg/ml Brefeldin A for 30 min at 37°C and, after washing, frozen on microscope slides and fixed in cold methanol.
Activations, immunoprecipitations, and immunoblotting
Activation by TCR/CD3 cross-linking was performed by incubating Jurkat cells with saturating concentrations of anti-CD3 mAb and 50 µg/ml secondary antibodies for 1–10 min at 37°C as described23. Cells (1×10⁶/sample for direct immunoblot analysis, 5×10⁷/sample for immunoprecipitations) were lysed in 1% Triton X-100 in 20 mM Tris-HCl (pH 8), 150 mM NaCl in the presence of a protease inhibitor cocktail, and postnuclear supernatants were probed as such or immunoprecipitated using anti-IFT20, -IFT88 or -IFT57 polyclonal antibodies and protein A-Sepharose (Amersham). Immunoblotting was carried out using primary antibodies and peroxidase-labeled secondary antibodies according to the manufacturers’ instructions and a chemiluminescence detection kit (Pierce Rockford, Ill.). All blots were reprobed with loading (anti-actin mAb) or immunoprecipitation (anti-IFT20, -IFT57, -IFT88) control antibodies after stripping. Blots were scanned using a laser densitometer (Duoscan T2500; Agfa, Milan, Italy) and quantified using the ImageQuant 5.0 software (Molecular Dynamics, Sunnyvale, CA).
For analysis of CD69 expression, cells (1×10⁶ cells/sample) were activated by CD3 cross-linking on secondary antibody-coated plates as described23 and were processed for flow cytometry 8 h after activation.
Flow cytometry
CD3, CD69 or CXCR4 expression on Jurkat transfectants and purified peripheral T-cells was quantitated by flow cytometry using fluorochrome-labeled mAb (CD3, CD69) or unlabeled antibody (CXCR4) followed by FITC-labeled secondary antibodies. To analyze total expression of CD3, CD69 and CXCR4, cells were fixed in 4% paraformaldehyde in PBS for 20 min, incubated in PBS 1% BSA for 20 min, permeabilized with PBS 0.1% Triton X-100 and labeled as above.
CD3 recycling was induced by treatment with PDBu. Control and IFT20-KD Jurkat cells (1×10⁶ cells/ml RPMI1640 supplemented with 10% serum) were stimulated with 1 µM PDBu for 1 h at 37°C, washed at 4°C and transferred to 37°C for 1–60 min. Surface CD3 expression was measured at all time points by flow cytometry.
To block endosome recycling, control and IFT20-KD Jurkat cells were incubated at 20°C for 16 h (1×10⁶ cells/ml RPMI1640 supplemented with 10% serum). Cells were subsequently washed and transferred to 37°C for 4 h. Surface and total CD3 expression was measured by flow cytometry as described above. TCR internalization was quantitated as described24,25. Flow cytometry was carried out using a FACScan flow cytometer (Becton Dickinson, San Jose, CA). Data were acquired using CellQuest and analyzed and plotted using Flowjo (TreeStar, Ashland, OR).
Immunofluorescence microscopy
Jurkat cells or PBL (1.5×10⁵ cells/4µl PBS) were plated on microscope slides, flash-frozen on a copper bar pre-cooled in liquid nitrogen and fixed by immersion in methanol for 10 min at −20 °C. For the IS experiments, Raji cells (used as APC) were pulsed for 2 h with 10 µg/ml SEE and labeled with 10 µM Cell Tracker Blue for the last 20 min. APC were washed, mixed with Jurkat cells (1:1) for 15 min and plated on polylysine-coated wells of diagnostic microscope slides (Erie Scientific Company). Alternatively, peripheral T cells purified from healthy donors and transiently transfected with either empty vector or the IFT20 RNAi construct were mixed with SEE/SEB-pulsed APC and processed as above. Cells were allowed to adhere for 15 min and then fixed in methanol at −20°C for 10 min as described above. Antigen-independent conjugates were obtained by mixing T cells and APC in the absence of SEE/SEB. To induce capping, Jurkat cells were incubated for 30 min with anti-CD3ε mAb at 4°C and, after washing, incubated at 37°C with secondary Alexa Fluor 488-conjugated secondary antibodies for 10 min. Cells were then washed, flash-frozen and fixed as described above.
Following fixation, samples were washed 5 min in PBS and incubated with primary antibodies overnight at 4°C or 1 h at RT. After washing in PBS, samples were incubated for 1 h at RT with Alexa Fluor 488- and 555-labeled secondary antibodies. For the triple staining experiment the anti-IFT20 antibody was labeled with a Zenon Rabbit IgG Labeling Kit (Molecular Probes), using Alexa Fluor-546 as fluorochrome, and IFT57 and CD3ζ were stained with Alexa Fluor-488 and -647 labeled secondary antibodies, respectively. To better visualize surface CD3 and surface TfR, which are partially lost in methanol-fixed cells, in one experiment SEE-specific conjugates were also fixed in 4% paraformaldehyde and stained with anti-CD3ε or anti-TfR mAb (Supplementary Information, Fig.S3 and S8 online).
Confocal microscopy was carried out on a Zeiss LSM510 using a 63X objective. Z series of optical sections were performed at 0.5 µm increments. Images to quantify were acquired with pinholes opened to obtain optical sections of 0.6 µm thick. Detectors were set to detect an optimal signal below the saturation limits. Image sets to be compared were acquired during the same session and using the same acquisition settings. Images were processed with LSM5 Image Examiner software (Carl Zeiss, Jena, Germany).
Epifluorescence microscopy was carried out using an Axio Imager Z1 (Carl Zeiss, Göttingen, Germany) microscope equipped with a HBO 50-W mercury lamp for epifluorescence and with an AxioCam HR cooled charge-coupled camera (Carl Zeiss). Gray-scale digital images were collected separately and then pseudo-colored and merged using Adobe Photoshop 7.0 software (Adobe Systems, San Jose, CA). If required, images were adjusted for constrast in Adobe Photoshop. When comparisons were to be made between images, the photos were taken in identical conditions and manipulated equally.
Post-processing of confocal images, colocalization analysis and 3D reconstructions
Clustering or relocalization of molecules and organelles at the T-cell/APC contact site was quantitated on median optical confocal sections using ImageJ software (downloaded from http://www.embl-heidelberg.de/eamnet/) and expressed either as relative recruitment index (IFT20, CD3ζ, PTyr, TfR) or as distance of the center of the organelle from the T-cell/APC contact site (MTOC, Golgi), as described9,26.
Post-processing of the confocal images included an initial segmentation by a semi-automatic intensity-independent zero-crossing procedure, which allowed the indentification of the boundaries of the organelles/compartments27. Specifically, colocalization analysis and 3D reconstructions were performed on the images segmented by an edge-detection intensity-independent zero-crossing procedure. In this procedure, the edges of the structural elements are assumed to correspond to the inflection points of the intensity functions. At these positions, the absolute values of the slope are maximal, and therefore the first derivative shows a maximum, and the Laplacian (the second derivative) changes sign, i.e. crosses zero28. These zero-crossings have thus been used as the tool for the recognition of edges/surfaces in 2D/3D in microscopy imaging27. Briefly, all of the images were slightly pre-smoothed with a Gaussian filter (σ = 2) to reduce noise and the background pixels below 15% of the maximum point spread function intensity were cut before calculating the zero-crossing algorithm, which was run through a dedicated MATLAB29 routine. The same MATLAB routine was used to calculate the weighted colocalizations (see below). Finally, the DIPimage software (version 1.6, http://www.diplib.org/), was used to develop the 3D reconstructions readable in the Visual Molecular Dynamics package (version 1.8.5, http://www.ks.uiuc.edu/Research/vmd/), which was used to visualize these 3D reconstructions.
Object-based weighted colocalizations of each of the examined organelles/compartments with the IFT20 staining, and the corresponding 3D reconstructions, were elaborated from the segmented images as previously described27. First, after the zero-crossing segmentation has been performed, only the remaining pixels for each channel are taken into account. Then, these pixels are subdivided into three regions: all the pixels where only channel 1 (IFT20) is present belong to region 1, all the pixels where only channel 2 (any other marker) is present belong to region 2. Finally, all pixels where both channels are present belong to region 3. For the weighted colocalization of any of the cellular compartment/organelle (region 2) with IFT20 (region 1), the ratio between the intensity of pixels in region 3 to the intensities of pixels in region 2+3 was calculated.
Statistical analyses
The Microsoft Excel (Redmond, WA) was used in the data analysis. Quantitative data are shown as mean ±standard deviation. Moreover, after testing for the normality of the data by means of a Shapiro-Wilk test and the equality of variance among the datasets by means of a Levene test, parametric methods were used to assess the significance of the differences among the treatments/groups (data from at least three independent experiments). A one-way analysis of variance (ANOVA) was employed in every comparisons involving more than 2 treatments/groups. Thereafter, a Bonferroni-corrected student t-test for unpaired samples was used in the pairwise comparisons. A p value less than 0.05 was considered as statistically significant.
Supplementary Material
Acknowledgements
The authors want to thank Giuliano Callaini for invaluable help with fluorescence microscopy, Sonia Grassini for technical assistance, Andres Alcover, Salvatore Valitutti, Pietro Lupetti, Alberto Luini, Antonino Colanzi, Antonella De Matteis and Caterina Mencarelli for useful discussions and John L Telford and Andres Alcover for critical reading of the manuscript. This work was supported by grants from AIRC (to CTB) and the National Institutes of Health (GM060992 to GJP, GM-14,642 to JLR). FF is the recipient of a FIRC fellowship. There are no competing financial interests.
References
- 1.Scholey JM, Anderson KV. Intraflagellar transport and cilium-based signaling. Cell. 2006;125:439. doi: 10.1016/j.cell.2006.04.013. [DOI] [PubMed] [Google Scholar]
- 2.Rosenbaum JL, Witman GB. Intraflagellar transport. Nat Rev Mol Cell Biol. 2002;3:813. doi: 10.1038/nrm952. [DOI] [PubMed] [Google Scholar]
- 3.Follit JA, Tuft RA, Fogarty KE, Pazour GJ. The intraflagellar transport protein IFT20 is associated with the Golgi complex and is required for cilia assembly. Mol Biol Cell. 2006;17:3781. doi: 10.1091/mbc.E06-02-0133. [DOI] [PMC free article] [PubMed] [Google Scholar]
- 4.Jonassen JA, San Agustin J, Follit JA, Pazour GJ. Deletion of IFT20 in the mouse kidney causes misorientation of the mitotic spindle and cystic kidney disease. J Cell Biol. 2008;183:377. doi: 10.1083/jcb.200808137. [DOI] [PMC free article] [PubMed] [Google Scholar]
- 5.Cemerski S, Shaw A. Immune synapses in T-cell activation. Curr Opin Immunol. 2006;18:298. doi: 10.1016/j.coi.2006.03.011. [DOI] [PubMed] [Google Scholar]
- 6.Dustin ML, Tseng SY, Varma R, Campi G. T cell-dendritic cell immunological synapses. Curr Opin Immunol. 2006;18:512. doi: 10.1016/j.coi.2006.05.017. [DOI] [PubMed] [Google Scholar]
- 7.Sancho D, et al. Regulation of microtubule-organizing center orientation and actomyosin cytoskeleton rearrangement during immune interactions. Immunol Rev. 2002;189:84. doi: 10.1034/j.1600-065x.2002.18908.x. [DOI] [PubMed] [Google Scholar]
- 8.Martin-Cofreres NB, et al. MTOC translocation modulates IS formation and controls sustained T cell signaling. J Cell Biol. 2008;182:951. doi: 10.1083/jcb.200801014. [DOI] [PMC free article] [PubMed] [Google Scholar]
- 9.Das V, et al. Activation-induced polarized recycling targets T cell antigen receptors to the immunological synapse; involvement of SNARE complexes. Immunity. 2004;20:577. doi: 10.1016/s1074-7613(04)00106-2. [DOI] [PubMed] [Google Scholar]
- 10.Pazour GJ, Witman GB. The vertebrate primary cilium is a sensory organelle. Curr Opin Cell Biol. 2003;15:105. doi: 10.1016/s0955-0674(02)00012-1. [DOI] [PubMed] [Google Scholar]
- 11.Wulfing C, et al. Interface accumulation of receptor/ligand couples in lymphocyte activation: methods, mechanisms, and significance. Immunol Rev. 2002;189:64. doi: 10.1034/j.1600-065x.2002.18907.x. [DOI] [PubMed] [Google Scholar]
- 12.Kane LP, Lin J, Weiss A. Signal transduction by the TCR for antigen. Curr Opin Immunol. 2000;12:242. doi: 10.1016/s0952-7915(00)00083-2. [DOI] [PubMed] [Google Scholar]
- 13.Geisler C. TCR trafficking in resting and stimulated T cells. Crit Rev Immunol. 2004;24:67. doi: 10.1615/critrevimmunol.v24.i1.30. [DOI] [PubMed] [Google Scholar]
- 14.Alcover A, Alarcon B. Internalization and intracellular fate of TCR-CD3 complexes. Crit Rev Immunol. 2000;20:325. [PubMed] [Google Scholar]
- 15.Lanzavecchia A, Sallusto F. From synapses to immunological memory: the role of sustained T cell stimulation. Curr Opin Immunol. 2000;12:92. doi: 10.1016/s0952-7915(99)00056-4. [DOI] [PubMed] [Google Scholar]
- 16.Satir P, Mitchell DR, Jekely G. How did the cilium evolve? Curr Top Dev Biol. 2008;85:63–82. doi: 10.1016/S0070-2153(08)00803-X. [DOI] [PubMed] [Google Scholar]
- 17.Bethune J, Wieland F, Moelleken J. COPI-mediated transport. J Membr Biol. 2006;211:65. doi: 10.1007/s00232-006-0859-7. [DOI] [PubMed] [Google Scholar]
- 18.Follit JA, et al. The Golgin GMAP210/TRIP11 anchors IFT20 to the Golgi complex. PLoS Genet. 2008;4:e1000315. doi: 10.1371/journal.pgen.1000315. [DOI] [PMC free article] [PubMed] [Google Scholar]
- 19.Pazour GJ, Rosenbaum JL. Intraflagellar transport and cilia-dependent diseases. Trends Cell Biol. 2002;12:551. doi: 10.1016/s0962-8924(02)02410-8. [DOI] [PubMed] [Google Scholar]
- 20.Pacini S, et al. Tyrosine 474 of ZAP-70 is required for association with the Shc adaptor and for T-cell antigen receptor-dependent gene activation. J Biol Chem. 1998;273:20487. doi: 10.1074/jbc.273.32.20487. [DOI] [PubMed] [Google Scholar]
- 21.Sallusto F, Cella M, Danieli C, Lanzavecchia A. Dendritic cells use macropinocytosis and the mannose receptor to concentrate macromolecules in the major histocompatibility complex class II compartment: downregulation by cytokines and bacterial products. J Exp Med. 1995;182:389. doi: 10.1084/jem.182.2.389. [DOI] [PMC free article] [PubMed] [Google Scholar]
- 22.Pazour GJ, et al. The intraflagellar transport protein, IFT88, is essential for vertebrate photoreceptor assembly and maintenance. J Cell Biol. 2002;157:103. doi: 10.1083/jcb.200107108. [DOI] [PMC free article] [PubMed] [Google Scholar]
- 23.Boncristiano M, et al. The Helicobacter pylori vacuolating toxin inhibits T cell activation by two independent mechanisms. J Exp Med. 2003;198:1887. doi: 10.1084/jem.20030621. [DOI] [PMC free article] [PubMed] [Google Scholar]
- 24.D'Oro U, et al. Regulation of constitutive TCR internalization by the zeta-chain. J Immunol. 2002;169:6269. doi: 10.4049/jimmunol.169.11.6269. [DOI] [PubMed] [Google Scholar]
- 25.Patrussi L, et al. Cooperation and selectivity of the two Grb2 binding sites of p52Shc in T-cell antigen receptor signaling to Ras family GTPases and Myc-dependent survival. Oncogene. 2005;24:2218. doi: 10.1038/sj.onc.1208384. [DOI] [PubMed] [Google Scholar]
- 26.Esquerré M, et al. Human regulatory T cells inhibit polarization of T helper cells toward antigen-presenting cells via a TGF-beta-dependent mechanism. Proc Natl Acad Sci U S A. 2008;105:2550. doi: 10.1073/pnas.0708350105. [DOI] [PMC free article] [PubMed] [Google Scholar]
- 27.Perinetti G, et al. Correlation of 4Pi and electron microscopy to study transport through single Golgi stacks in living cells with super resolution. Traffic. 2009;10:379. doi: 10.1111/j.1600-0854.2008.00875.x. [DOI] [PubMed] [Google Scholar]
- 28.O'Haver TC. Potential clinical applications of derivative and wavelength-modulation spectrometry. Clin Chem. 1979;25:1548. [PubMed] [Google Scholar]
- 29.MATLAB. The MathWorks, Inc. (R2006b). [Google Scholar]
Associated Data
This section collects any data citations, data availability statements, or supplementary materials included in this article.