Abstract
Background
End-tidal carbon dioxide (ETCO2) is a surrogate, noninvasive measurement of arterial carbon dioxide (PaCO2); however, its clinical applicability in the intensive care unit setting remains unclear. Available research on the relationship between ETCO2 and PaCO2 has not taken a detailed assessment of physiologic dead space into consideration. We hypothesize that ETCO2 reliably predicts PaCO2 across all levels of physiologic dead space provided that the expected ETCO2-PaCO2 gradient is considered.
Methods
Fifty-six mechanically ventilated pediatric patients (0-17 years; 19.5 ± 24.5 kg) were monitored with volumetric capnography. For every arterial blood gas obtained during routine care, ETCO2 values were collected, and Vd/Vt values calculated. The ETCO2-PaCO2 relationship was assessed by Pearson's correlation coefficients within specified ranges of Vd/Vt.
Results
Vd/Vt was ≤ 0.4 for 125 (25%) measurements, 0.41-0.55 for 160 (32%) measurements, 0.55-0.7 for 154 (31%) measurements, and > 0.7 for 54 (11%) measurements. The correlation coefficients between ETCO2 and PaCO2 were 0.95 (mean gradient = 0.3 ± 2.1) for Vd/Vt ≤ 0.4, 0.88 (mean gradient = 5.9 ± 4.3) for Vd/Vt 0.41-0.55, 0.86 (mean gradient = 13.6 ± 5.2) for Vd/Vt 0.55-0.7, and 0.78 (mean gradient = 17.8 ± 6.7) for Vd/Vt > 0.7.
Conclusions
Strong correlations between ETCO2 and PaCO2 were found for all Vd/Vt ranges. The ETCO2-PaCO2 gradient increased predictably with increasing Vd/Vt.
Keywords: capnography, artificial respiration, blood gas analysis, pediatric, infant, mechanical ventilation, carbon dioxide
INTRODUCTION
Capnography is a useful monitoring tool during mechanical ventilation and is the standard of care for confirmation of endotracheal tube placement1,2,3,4,5 and for monitoring in the operating room setting6,7,8. Capnography is also useful for monitoring the integrity of the ventilator circuit for early detection of mishaps such as inadvertent extubation9,10,11.
There is less agreement about the utility of continuous capnography for ventilated intensive care unit patients12. Advocates of capnography feel that end-tidal carbon dioxide (ETCO2) may be used as a surrogate of arterial carbon dioxide (PaCO2), which would provide a quick and noninvasive assessment of the adequacy of ventilation. Critics of capnography reference multiple studies that conclude that ETCO2 and PaCO2 do not reliably correlate in some clinical situations.13,14,15,16, 17,18,19 However, many of these clinical situations involve patients with significant elevations in physiologic dead space. The analyses utilized in these studies are highly variable and fail to consider physiologic dead space and/or its effect on the relationship between PaCO2 and ETCO2 as dead space increases.
Physiologic dead space ventilation is the sum of anatomical dead space from the conducting airways and alveolar dead space from disease processes and/or therapies employed. The gradient between ETCO2 and PaCO2 is directly proportional to the degree of physiologic dead space. 20,21,22 Although typical alveolar CO2 concentrations are slightly greater than that of arterial blood, ETCO2 is normally 2-5 mm Hg lower than PaCO223 due to mixing of CO2-containing alveolar gas with exhaled gas devoid of carbon dioxide from the anatomical dead space. In a patient with lung disease, the addition of alveolar dead space further dilutes ETCO2 relative to PaCO2. The normal physiologic dead space to tidal volume ratio (Vd/Vt) is 0.20-0.35.24 The Vd/Vt of adult patients with acute lung injury is generally 0.40-0.55, and for those patients with acute respiratory distress syndrome (ARDS) a significantly elevated Vd/Vt is associated with increased mortality25.
The objective of our physiology-based study is to evaluate the relationship between ETCO2 and PaCO2 across a wide range of Vd/Vt ratios. We hypothesized that ETCO2 reliably predicts PaCO2 across all levels of physiologic dead space as long as the increased ETCO2-PaCO2 gradient predicted by a high physiologic dead space is considered. Despite the multiple earlier publications comparing ETCO2 and PaCO2, no previous study has examined the effect of changes in physiologic dead space on the relationship between ETCO2 and PaCO2 across a wide range of Vd/Vt ratios (ranging from minimal to severe lung disease) in a diverse group of mechanically ventilated pediatric patients.
METHODS
Study Patients
This study is a retrospective cross-sectional analysis of data from a previous study at this institution (Hamel and Cheifetz, personal communication, 2009). In the parent study, all children < 18 years of age admitted to the PICU at Duke Children's Hospital with an anticipated need for mechanical ventilation of at least 24 hours and a functional indwelling arterial catheter were eligible for enrollment (Table 1). Enrollment occurred between November, 2001 and June, 2005. The study was approved by the Duke Medical Center Institutional Review Board (IRB). Written informed consent was obtained from at least one parent or legal guardian prior to enrollment. Exclusion criteria included: patients with tracheostomy, need for high frequency ventilation or extracorporeal life support, limitations on life support, baseline chronic use of invasive or non-invasive respiratory support, and intubation for known upper airway obstruction.
Ventilator Management
The mechanical ventilators (AVEA, Viasys Healthcare, Yorba Linda, CA or Servo 300, Siemens Corp., Solno, Sweden) were equipped with basic airway graphic monitors and were calibrated as per manufacturer recommendations. Ventilator management was directed by a standard PICU protocol. Of note, specific capnography parameters were not incorporated into the ventilator management protocol. Arterial blood gas analysis and chest radiographs were obtained and pharmacologic sedation administered as per standard clinical practice. A heterogeneous group of mechanically ventilated pediatric intensive care unit (PICU) patients was monitored with volumetric capnography (NICO Monitor; Philips-Respironics, Inc.; Wallingford, CT) from the initiation of mechanical ventilation in our Pediatric Intensive Care Unit until extubation.
Data Collection
For every arterial blood gas obtained during routine medical care, ETCO2 and mixed expired carbon dioxide (PeCO2) values were electronically collected at the level of the end of the endotracheal tube. Data acquisition rate of the NICO monitor is 100 Hz. The monitor continuously checks factory calibration values to assure accuracy and will alert the clinician if there is a calibration error. Vd/Vt was calculated using the Enghoff modification26 of the Bohr equation: Vd/Vt = [PaCO2 – PeCO2] / PaCO2. Corresponding arterial blood gas values were recorded.
Statistical Analysis
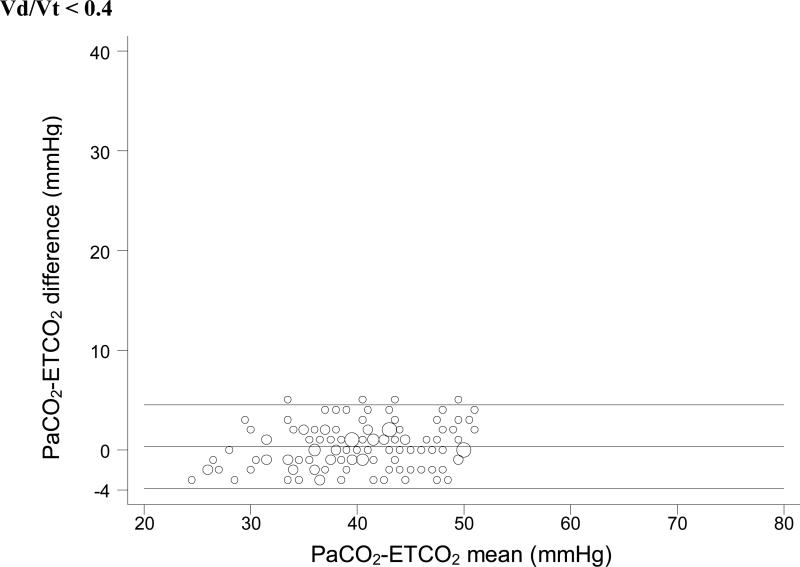
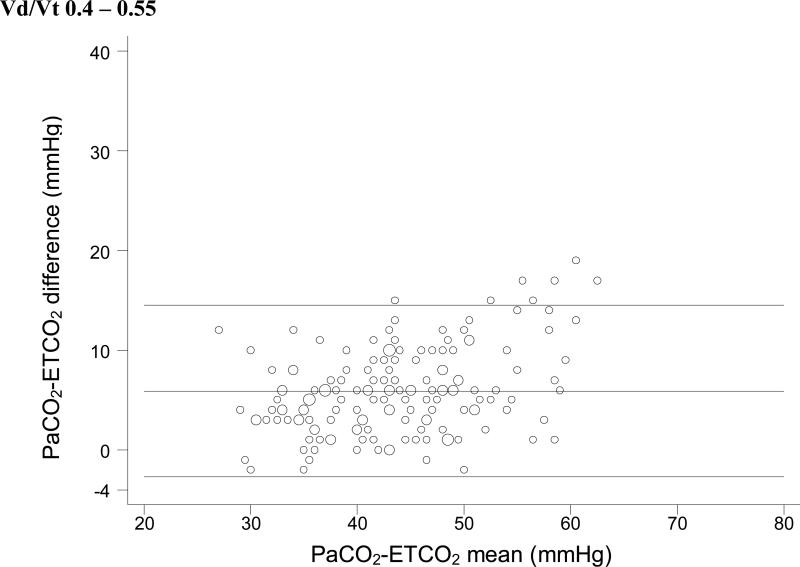
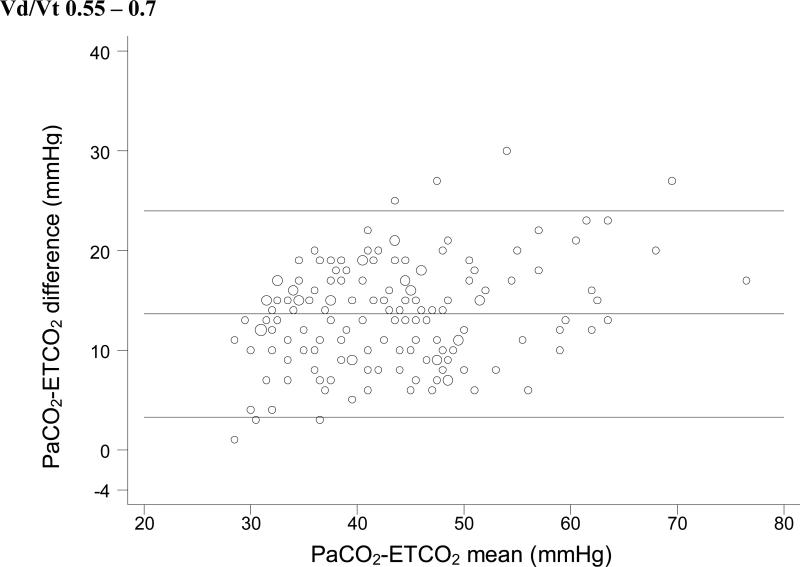
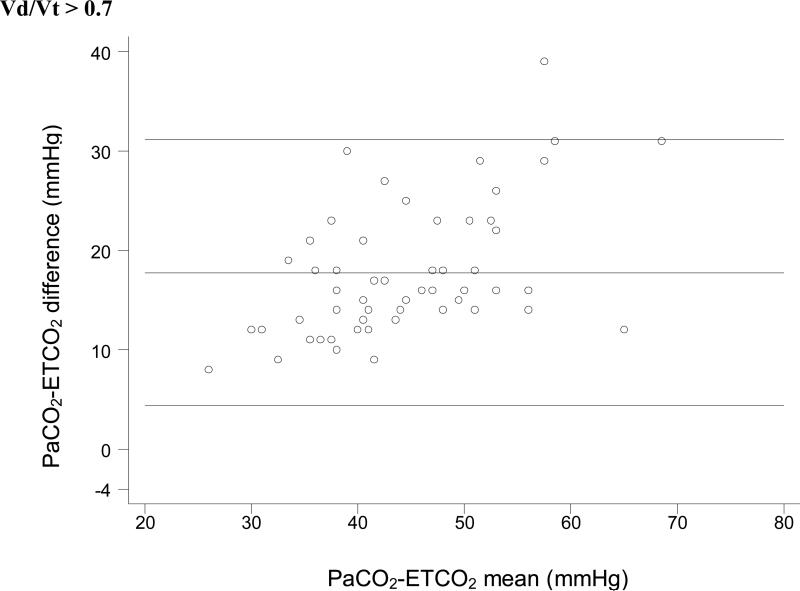
The relationship between ETCO2 and PaCO2 within specified ranges of Vd/Vt (≤ 0.4, 0.41-0.55, 0.55-0.7, and > 0.7) was assessed by computation of Pearson's correlation coefficient. The mean ETCO2-PaCO2 gradient within each Vd/Vt range was also calculated. Multivariable linear regression models were tested in an effort to explore the relationships between all dependent and independent variables. Bland-Altman plots within each range of Vd/Vt were created to further evaluate the agreement between ETCO2 and PaCO2. Analyses were done using STATA 9 (College Station, TX).
RESULTS
A heterogeneous group of 56 mechanically ventilated pediatric patients (0-17 years; 19.5±24.5 kg) was studied. From these patients we obtained 493 data points for analysis. The Vd/Vt ratio was ≤ to 0.4 in 125 (25%) measurements, 0.41 - 0.55 in 160 (32%) measurements, 0.55-0.7 in 154 (31%) measurements, and > 0.7 in 54 (11%) measurements. The correlation coefficient between ETCO2 and PaCO2 for a Vd/Vt ratio ≤ 0.4 was 0.95 with a mean gradient between ETCO2 and PaCO2 of 0.3 ± 2.1 mmHg. For a Vd/Vt ratio 0.41-0.54, the correlation coefficient was 0.88 with a mean gradient of 5.9 ± 4.3 mmHg. For a Vd/Vt ratio 0.55-0.7, the correlation coefficient was 0.86 with a mean gradient of 13.6 ± 5.2 mmHg. For a Vd/Vt ratio > 0.7, the correlation coefficient was 0.78 with a mean gradient of 17.8 ± 6.7 mmHg (Table 2).
For each Vd/Vt range, we used simple linear regression with weighted least-squares to test the null hypothesis that no significant relationship exists between ETCO2 and PaCO2. In each case, a significant positive linear relationship between ETCO2 and PaCO2 was identified (Figure 1). Bland-Altman plots for each range of Vd/Vt are shown in Figure 2.
Figure 1.
End-tidal carbon dioxide versus arterial carbon dioxide at different ranges of physiologic dead space. A) At a physiologic dead space to tidal volume ratio (Vd/Vt) ≤ 0.4 the correlation is very strong (ρ = 0.95). B) At Vd/Vt of 0.40-0.55 (ρ = 0.88), C) 0.55-0.7 (ρ = 0.86), and D) > 0.7 (ρ = 0.78), the correlation coefficients decrease slightly but remain moderately strong.
Figure 2.
Bland-Altman plots of ETCO2 versus PaCO2. These plots do not take into account the expected change in the ETCO2-PaCO2 gradient seen with increasing physiologic dead space. So it is impossible to tell whether the variation seen in these plots is due to variation in physiologic dead space within each subset or to unreliability of ETCO2 as a surrogate measure.
DISCUSSION
Capnography is accepted by some as an indispensable tool for mechanical ventilation in many clinical situations to reduce the frequency of blood gas measurements. However, there remains significant debate as to whether capnography is useful as a continuous monitoring technique for mechanically ventilated patients. The goal of this study is to provide physiologic data to help clarify the relationship between ETCO2 and PaCO2 in a heterogeneous pediatric ICU population.
There are potential benefits to the continuous monitoring of exhaled CO2 in an intensive care unit. Not only can continuous assessment of the patient's ventilatory status allow for early warning in case of a loss of integrity of the ventilator circuit or inadvertent extubation, but continuous assessment of ETCO2 may help to optimize mechanical ventilation and aid in weaning from the ventilator more quickly26. In addition, capnography can be a useful early indicator of changes in a patient's cardiopulmonary status due to alterations in pulmonary blood flow, respiratory effort, effective minute ventilation, and/or respiratory compliance27.
Previous reports suggest that ETCO2 may not be a reliable surrogate for measured arterial CO2, which may cast doubt on the utility of capnography as a continuous monitor 13,14,15,16,17,18,19. However, those studies have generally not included a comprehensive statistical analysis accounting for differences in physiologic dead space ventilation and the resulting gradient between ETCO2 and PaCO2. For example, the pediatric study by McDonald et al in 200219 found an overall moderately strong correlation (r2=0.716) between PaCO2 and ETCO2 for all included patients, but the investigators concluded that significant lung disease, defined by PaO2/FiO2 < 200, had a negative effect on correlation. However, the degree of physiologic dead space was not included in the analysis making the results difficult to apply in the clinical setting. In contrast, our study incorporates the effect of increased physiologic dead space in patients with significant lung disease.
Increased physiologic dead space lowers ETCO2 relative to PaCO2 due to the mixing of gas from poorly-perfused areas of lung (devoid of CO2) with that from well-perfused areas, thus resulting in a larger gradient between the two measurements. In this study, we provide evidence that physiologic dead space ventilation is a major factor in determining the relationship between capnographic monitoring of ETCO2 and measured PaCO2. In patients with a low calculated physiologic dead space to tidal volume ratio (Vd/Vt ≤ 0.40), there is excellent correlation (ρ = 0.95) between ETCO2 measured noninvasively by capnography and the invasive assessment of arterial carbon dioxide by blood gas measurement. While the strength of the association diminishes slightly as the dead space ratio increases, the correlation still remains strong (ρ = 0.86) even at high values of Vd/Vt (0.55-0.7), and moderately strong (ρ = 0.78) when physiologic dead space is severely elevated (Vd/Vt > 0.7). Thus, ETCO2 appears to be a useful indicator of PaCO2 even in patients with significant lung disease, provided that the expected increase in the ETCO2-PaCO2 gradient (from an average of 0.3 mmHg at low Vd/Vt to an average of 18 mmHg at high Vd/Vt) is taken into consideration. (Figure 1.)
For the purposes of the clinical application of our results, it is important to note that correlation is not the same as equality. Physiologically, as described above, the gradient between ETCO2 and PaCO2 is expected to increase at higher Vd/Vt. The decrease in the correlation coefficient between ETCO2 and PaCO2 at high Vd/Vt is not due to the increased gradient, but rather to the slightly increased variability of that gradient at higher Vd/Vt. This is an important distinction, because the moderately strong correlation coefficient at high Vd/Vt values indicates that the expected larger gradient between ETCO2 and PaCO2 remains fairly predictable despite the increased dead space ventilation.
This distinction is also important in interpreting the Bland-Altman plots in Figure 2. Bland Altman plots are a visual assessment of agreement between two methods of measurement, and demonstrate “good agreement” only when the difference between the two methods is consistent across all measurements. In a situation in which the difference between the two measurements is expected to change based on a third variable (in this case, Vd/Vt), the Bland-Altman plots lose significance. These plots do not take into account the expected change in the ETCO2-PaCO2 gradient seen with increasing physiologic dead space, except insofar as we have divided the dataset into four specific Vd/Vt ranges. Thus, it is impossible to tell whether the variation seen in these plots is due to variation in physiologic dead space within each subset or to unreliability of ETCO2 as a surrogate measure. We have included these plots for completeness, but they should be interpreted with an understanding of their shortcomings with regard to these data.
From a purely statistical standpoint, the best method to compare ETCO2 and PaCO2 is a multiple linear regression equation using ETCO2 and Vd/Vt to predict PaCO2. From a clinical standpoint, however, we feel that this would not be practical. It is for that reason that we have grouped our data into ranges of Vd/Vt ratios corresponding to normal, mildly elevated, moderately elevated, and severely elevated physiologic dead space. At the bedside, it is easier to consider into what category of physiologic dead space a patient falls than it is to calculate a predicted PaCO2 value using a derived equation.
Continuous ETCO2 monitoring in the pediatric ICU setting may help clinicians to more closely monitor mechanically ventilated infants and children. Our data support the view that ETCO2 does closely trend with PaCO2, potentially allowing for a reduction in the number of arterial blood gas analyses. At low dead space values, ETCO2 closely matches PaCO2. As dead space increases, the trend between ETCO2 and PaCO2 remains reliable in most patients; however, the gradient between these values does increase as physiology predicts.
Study limitations
A key limitation of our study is the assumption that Vd/Vt is stable between blood gases over time for an individual patient. Data on the stability of Vd/Vt and the PaCO2-ETCO2 gradient over time in individual patients are not available for this study. As clinical status changes, dead space may change as well. When this occurs, the relationship between PaCO2 and ETCO2 becomes less predictable. Thus, the clinician should obtain periodic blood gas analyses, especially with significant changes in a patient's overall pulmonary status, to reassess the correlation between PaCO2 and ETCO2.
The increased variation in the PaCO2-ETCO2 gradient at highly elevated physiologic dead space must be noted. The data analysis does not allow us to determine whether the variation in the relationship at severely elevated physiologic dead space is present in individual patients. We expect there is less variation in the PaCO2-ETCO2 gradient for individual patients, even at severely elevated Vd/Vt, and thus, the increased variability of the PaCO2-ETCO2 gradient in our data set is at least partly a function of combining data from different patients. Additionally, some of the variation in the highest Vd/Vt subgroup might be due to the slightly wider distribution of Vd/Vt (i.e., the largest grouping beyond the normal range). Since the PaCO2-ETCO2 gradient should increase as Vd/Vt increases, a larger range of gradients is expected given the larger Vd/Vt range. Despite these caveats, it is likely that ETCO2 does lose some capacity to predict PaCO2 in patients with the most severe lung disease and, thus, the most severely elevated physiologic dead space, a fact which must be taken into consideration clinically.
Application of these results in the clinical setting may require additional training of caregivers and potentially the availability of additional equipment. The capnography monitors used in our unit automatically calculate Vd/Vt when blood gas data are entered, obviating the need for respiratory therapists or clinicians to make the calculations themselves. In addition, the capnography sensors used measure both gas flow and CO2 concentration, so that only one endotracheal tube attachment is required.
The results of this study should, theoretically, allow clinicians to limit the total number of blood gas analyses obtained per patient and enable more efficient management of the mechanical ventilator by continuous capnographic monitoring. However, proof of this speculation is beyond the scope of this physiology-based study.
CONCLUSION
Moderate to strong positive linear correlation coefficients between end-tidal and arterial carbon dioxide measurements were found for all Vd/Vt ranges, although the strength of the relationships decreased slightly as Vd/Vt increased. As expected physiologically, the absolute gradient between ETCO2 and PaCO2 consistently increased with increasing Vd/Vt.
Acknowledgments
Research and unrestricted educational grants from Respironics, Inc. provided partial funding for this study.
REFERENCES
- 1.American Heart Association 2005 American Heart Association (AHA) guidelines for cardiopulmonary resuscitation (CPR) and emergency cardiovascular care (ECC) of pediatric and neonatal patients: pediatric advanced life support. Pediatrics. 2006;117(5):e1005–e1028. doi: 10.1542/peds.2006-0346. [DOI] [PubMed] [Google Scholar]
- 2.Birmingham PK, Cheney FW, Ward RJ. Esophageal intubation: a review of detection techniques. Anesth Analg. 1986;65(8):886–891. [PubMed] [Google Scholar]
- 3.Knapp S, Kofler J, Stoiser B, Thalhammer F, Burgmann H, Posch M, et al. The assessment of four different methods to verify tracheal tube placement in the critical care setting. Anesth Analg. 1999;88(4):766–770. doi: 10.1097/00000539-199904000-00016. [DOI] [PubMed] [Google Scholar]
- 4.Roberts WA, Maniscalco WM, Cohen AR, Litman RS, Chhibber A. The use of capnography for recognition of esophageal intubation in the neonatal intensive care unit. Pediatr Pulmonol. 1995;19(5):262–268. doi: 10.1002/ppul.1950190504. [DOI] [PubMed] [Google Scholar]
- 5.Kannan S, Manji M. Survey of use of end-tidal carbon dioxide for confirming tracheal tube placement in intensive care units in the UK. Anaesthesia. 2003;58(5):476–479. doi: 10.1046/j.1365-2044.2002.28934.x. [DOI] [PubMed] [Google Scholar]
- 6.Eichhorn JH, Cooper JB, Cullen DJ, Maier WR, Philip JH, Seeman RG. Standards for patient monitoring during anesthesia at Harvard Medical School. JAMA. 1986;256(8):1017–1020. [PubMed] [Google Scholar]
- 7.Tinker JH, Dull DL, Caplan RA, Ward RJ, Cheney FW. Role of monitoring devices in prevention of anesthetic mishaps: a closed claims analysis. Anesthesiology. 1989;71(4):541–546. doi: 10.1097/00000542-198910000-00010. [DOI] [PubMed] [Google Scholar]
- 8.Williamson JA, Webb RK, Cockings J, Morgan C. The Australian Incident Monitoring Study. The capnograph: applications and limitations—an analysis of 2000 incident reports. Anaesth Intensive Care. 1993;21(5):551–557. doi: 10.1177/0310057X9302100510. [DOI] [PubMed] [Google Scholar]
- 9.Murray IP, Modell JH. Early detection of endotracheal tube accidents by monitoring carbon dioxide concentration in respiratory gas. Anesthesiology. 1983;59(4):344–346. doi: 10.1097/00000542-198310000-00013. [DOI] [PubMed] [Google Scholar]
- 10.Poirier MP, Gonzalez Del-Rey JA, McAneney CM, DiGiulio GA. Utility of monitoring capnography, pulse oximetry, and vital signs in the detection of airway mishaps: a hyperoxemic animal model. Am J Emerg Med. 1998;16(4):350–352. doi: 10.1016/s0735-6757(98)90125-5. [DOI] [PubMed] [Google Scholar]
- 11.Ahrens T, Sona C. Capnography application in acute and critical care. AACN Clin Issues. 2003;14(2):123–132. doi: 10.1097/00044067-200305000-00002. [DOI] [PubMed] [Google Scholar]
- 12.Cheifetz IM, Myers TR. Should every mechanically ventilated patient be monitored with capnography from intubation to extubation? Respir Care. 2007;52(4):423–438. [PubMed] [Google Scholar]
- 13.Grenier B, Verchere E, Mesli A, Dubreuil M, Siao D, Vandendriessche M, et al. Capnography monitoring during neurosurgery: reliability in relation to various intraoperative positions. Anesth Analg. 1999;88(1):43–48. doi: 10.1097/00000539-199901000-00009. [DOI] [PubMed] [Google Scholar]
- 14.Short JA, Paris ST, Booker PD, Fletcher R. Arterial to end-tidal carbon dioxide tension difference in children with congenital heart disease. Br J Anaesth. 2001;86(3):349–353. doi: 10.1093/bja/86.3.349. [DOI] [PubMed] [Google Scholar]
- 15.Russell GB, Graybeal JM. Reliability of the arterial to end-tidal carbon dioxide gradient in mechanically ventilated patients with multisystem trauma. J Trauma. 1994;36(3):317–322. doi: 10.1097/00005373-199403000-00006. [DOI] [PubMed] [Google Scholar]
- 16.Kerr ME, Zempsky J, Sereika S, Orndoff P, Rudy EB. Relationship between arterial carbon dioxide and end-tidal carbon dioxide in mechanically ventilated adults with severe head trauma. Crit Care Med. 1996;24(5):785–790. doi: 10.1097/00003246-199605000-00010. [DOI] [PubMed] [Google Scholar]
- 17.Tobias JD, Meyer DJ. Noninvasive monitoring of carbon dioxide during respiratory failure in toddlers and infants: end-tidal versus transcutaneous carbon dioxide. Anesth Analg. 1997;85(1):55–58. doi: 10.1097/00000539-199707000-00010. [DOI] [PubMed] [Google Scholar]
- 18.Berkenbosch JW, Lam J, Burd RS, Tobias JD. Noninvasive monitoring of carbon dioxide during mechanical ventilation in older children: end-tidal versus transcutaneous techniques. Anesth Analg. 2001;92(6):1427–1431. doi: 10.1097/00000539-200106000-00015. [DOI] [PubMed] [Google Scholar]
- 19.McDonald MJ, Montgomery VL, Cerrito PB, Parrish CJ, Boland KA, Sullivan JE. Comparison of end-tidal CO2 and PaCO2 in children receiving mechanical ventilation. Pediatr Crit Care Med. 2002;3(3):244–249. doi: 10.1097/00130478-200207000-00008. [DOI] [PubMed] [Google Scholar]
- 20.Yamanaka MK, Sue DY. Comparison of arterial-end tidal PCO2 difference and dead space/tidal volume ratio in respiratory failure. Chest. 1987;92(5):832–835. doi: 10.1378/chest.92.5.832. [DOI] [PubMed] [Google Scholar]
- 21.Burrows FA. Physiologic dead space, venous admixture, and the arterial to end-tidal carbon dioxide difference in infants and children undergoing cardiac surgery. Anesthesiology. 1989;70(2):219–225. doi: 10.1097/00000542-198902000-00007. [DOI] [PubMed] [Google Scholar]
- 22.Fletcher R. The arterial-end-tidal CO2 difference during cardiothoracic surgery. J Cardiothorac Anesth. 1990;4(1):105–117. doi: 10.1016/0888-6296(90)90457-q. [DOI] [PubMed] [Google Scholar]
- 23.Sullivan KJ, Kissoon N, Goodwin SR. End-tidal carbon dioxide monitoring in pediatric emergencies. Pediatr Emerg Care. 2005;21(5):327–332. doi: 10.1097/01.pec.0000159064.24820.bd. [DOI] [PubMed] [Google Scholar]
- 24.Sun XG, Hansen JE, Garatachea N, Storer TW, Wasserman K. Ventilatory efficiency during exercise in healthy subjects. Am J Respir Crit Care Med. 2002 Dec 1;166(11):1443–8. doi: 10.1164/rccm.2202033. [DOI] [PubMed] [Google Scholar]
- 25.Kallet RH, Alonso JA, Pittet J, Matthay MA. Prognostic value of the pulmonary dead-space fraction during the first 6 days of acute respiratory distress syndrome. Respir Care. 2004;49(9):1008–1014. [PubMed] [Google Scholar]
- 26.Enghoff H. Volumen inefficax: Bemerkungen zur frage des schädlichen raumes. Upsala Lakareforen Forh. 1938;44:191–218. [Google Scholar]
- 27.Taskar V, John J, Larsson A, Wetterberg T, Jonson B. Dynamics of carbon dioxide elimination following ventilator resetting. Chest. 1995;108(1):196–202. doi: 10.1378/chest.108.1.196. [DOI] [PubMed] [Google Scholar]


