

Abstract
To assess the effects and mechanisms of a CD200R1 agonist administered during the progressive stage of a multiple sclerosis model, we administered CD200R1 agonist (CD200Fc) or control IgG2a during the chronic phase of disease (days 10–30) in mice with experimental autoimmune encephalomyelitis (EAE), induced using myelin oligodendrocyte glycoprotein peptide 35–55 (MOG35–55) peptide. We found that administration of CD200Fc during the chronic stages of EAE reduced disease severity, demyelination, and axonal damage, through the modulation of several key disease mechanisms. CD200Fc treatment suppressed macrophage and microglial accumulation within the CNS, in part through downregulation of adhesion molecules VLA-4 and LFA-1, which are necessary for macrophage migration. Additionally, expression of activation markers MHC-II and CD80 and production of proinflammatory cytokines IL-6, tumor necrosis factor-α, and nitric oxide by CD11b+ cells were decreased in both the spleen and CNS in CD200Fc-treated animals. Antigen-presenting cell function in the spleen and CNS was suppressed in CD200Fc-treated mice, but there were no significant alterations on T cell activation or phenotype. CD200Fc increased apoptosis of CD11b+ cells but not astrocytes. In contrast, addition of CD200Fc treatment protected oligodendrocytes from apoptosis in vitro and in vivo. Our results demonstrate that CD200R1 agonists modulate both myeloid- and non-myeloid-related mechanisms of chronic disease in the EAE model and may be effective in the treatment of progressive multiple sclerosis and other neurodegenerative diseases.
Introduction
At present, one of the major challenges in the treatment of multiple sclerosis (MS) is the lack of effective strategies to slow disease progression. Disease progression correlates with the uncontrolled activation of inflammatory and degenerative pathways within the CNS, resulting in demyelination, axonal, and neuronal degeneration (Lassmann, 2007). Microglia and macrophages are important effectors of demyelination and neurodegeneration, and progressive forms of MS are associated with the presence of activated microglia/macrophages both within plaques and in normal appearing white matter (Bitsch et al., 2000; Kutzelnigg et al., 2005; Zeis et al., 2008). It is postulated that strategies to downregulate microglial and macrophage activation may delay or halt disease progression. There is growing evidence that the CD200–CD200R pathway plays a key role in the regulation of myeloid function and thus may be important in the control of macrophage/microglial-mediated processes within the CNS (Hoek et al., 2000).
CD200 is a member of the Ig superfamily of glycoproteins and is expressed on a wide variety of cells, including neurons of the CNS and PNS, oligodendrocytes, endothelial cells, dendritic cells, and lymphocytes (Clark et al., 1985; McCaughan et al., 1987; Barclay and Brown, 1997; Wright et al., 2001; Koning et al., 2009). The CD200 molecule contains a short intracytoplasmic tail and is considered a nonsignaling molecule (Barclay et al., 1986). The ligand for CD200 is the CD200 receptor (CD200R), also known as CD200R1, and is present on monocytes, macrophages, dendritic cells, and microglia (Wright et al., 2000). Studies have additionally demonstrated expression of CD200R on neutrophils, mast cells, T and B lymphocytes and NKT cells (Wright et al., 2003; Rijkers et al., 2008), and on astrocytes and oligodendrocytes in the CNS (Chitnis et al., 2007). Isoforms of CD200R have been described in human and mouse, although it appears that CD200R1 is the dominant ligand in both species (Wright et al., 2003; Hatherley et al., 2005).
The cellular and tissue distribution of CD200 and its receptor suggest that this pathway plays a key role in the modulation of myeloid function. Functional studies suggest that this role is primarily inhibitory. CD200KO mice displayed increased numbers of macrophages and granulocytes in the spleen and activated microglia in the CNS (Hoek et al., 2000). CD200R agonists downregulate proinflammatory cytokine production by activated macrophages (Jenmalm et al., 2006; Boudakov et al., 2007).
Blockade of CD200R exacerbated disease in the experimental autoimmune encephalomyelitis (EAE) model of MS (Wright et al., 2000). CD200KO mice experienced a more severe form of EAE, associated with increased numbers of activated microglia in the CNS (Hoek et al., 2000). We have shown that elevated neuronal CD200 protects Wlds mice from microglial-induced neurodegeneration in vitro and attenuates the EAE disease course (Chitnis et al., 2007). Expression of CD200 has been found to be downregulated in both chronic active and inactive lesions from progressive MS patients (Koning et al., 2007). Importantly, intense CD200R expression is found on perivascular macrophages and lower levels on parenchymal microglia, in autopsy specimens from MS patients, which may thus serve as targets for CD200R agonists (Koning et al., 2009). Based on this information, we postulated that CD200R1 agonists play a key role in the attenuation of disease during the effector phase of an MS model.
Materials and Methods
Generation of fusion proteins and expression vectors.
CD200Fc and control murine IgG2a were provided by Genentech Inc. The extracellular domain of murine CD200 (amino acids 1-232) was cloned into a modified pRK5 expression vector encoding the murine IgG2a Fc region downstream of the CD200 sequence (referred to as CD200Fc). Murine anti-ragweed IgG2a monoclonal (mAb) (Genentech Inc.) was used as control. Proteins were overexpressed in CHO cells and were purified by protein A affinity chromatography and subsequent Sephacryl S-300 gel filtration. The identity of purified CD200Fc was verified by N-terminal sequence analysis, and the lipopolysaccharide (LPS) concentration was <0.1 Eu/mg for all chimeric proteins.
FLAG-tagged DAP12 was generated by subcloning human DAP12 without signal peptide into a pRK-based vector containing the N-terminal human herpes saimiri virus 1 (HSV-1) glycoprotein D (gD) signal peptide sequence followed by the FLAG tag. CD200R5 was cloned by reverse transcription (RT)-PCR from total RNA isolated from spleen of CD1 mice. gD-tagged murine and human CD200R1 (GenBank accession numbers NM_021325 and NM_170780, respectively), as well as murine CD200R2 (GenBank accession number NM_206535), CD200R3 (GenBank accession number NM_029018), CD200R4 (GenBank accession number NM_207244), and CD200R5 (GenBank accession number NM_177010) were generated by cloning the respective CD200 receptor without signal peptide sequence into a pRK-based vector containing the N-terminal gD signal peptide sequence, followed by a gD-tag (amino acids 26–55 of the N terminus of HSV-1 gD protein).
Stable cell line and flow cytometry.
A stable cell line expressing DAP12 at low level was generated by transfecting HEK 293 cells with FLAG-tagged DAP12 and a neomycin resistance cassette. FLAG–DAP12 expression was verified by staining with biotinylated anti-FLAG mAb F9291 (Sigma). CD200R or CD200R homologs were transiently transfected into HEK 293 cells or the HEK 293 cell line expressing FLAG–DAP12, respectively. Surface expression of CD200R1 and CD200R homologs was analyzed 48 h after transfection by flow cytometry using Alexa fluor A647-conjugated anti-gD mAbs (Genentech Inc.). Binding of murine CD200Fc to CD200R1 or CD200R homolog-expressing cells was detected by flow cytometry using FITC-conjugated anti-mouse IgG2a (catalog number 553090; BD Pharmingen) as secondary reagent.
EAE induction and treatments.
All animal care procedures were performed according to protocols approved by the Animal Care Committee of Brigham and Women's Hospital, Harvard Medical School. Chronic EAE was induced in 6- to 8-week-old female C57BL/6 mice (The Jackson Laboratory) by immunization with 200 μg of MOG 35–55 (M-E-V-G-W-Y-R-S-P-F-S-R-V-V-H-L-Y-R-N-G-K) (QCB Inc.) emulsified in complete Freund's adjuvant (Difco). On the day of immunization and 2 d after, the mice were injected intravenously with 200 ng of pertussis toxin (List Biological Laboratories). Clinical EAE was scored daily by a blinded observer as follows: 0, no signs; 1, limp tail; 2, partial paralysis of hindlimbs; 3, complete paralysis of hindlimbs; 4, paralysis of forelimbs and hindlimbs; 5, moribund or dead animal. Most of the mice developed severe EAE starting at day 9–10 after immunization. Subgroups of mice with onset of EAE at day 10 and with same total clinical scores were chosen for CD200Fc and control mouse IgG2a treatment, respectively. CD200Fc and control mouse IgG2a were administered at a dose of 100 μg/100 μl subcutaneously once every other day from onset day (day 10) to day 30, for a total dose of 1100 μg/mouse. To investigate the effect of CD200Fc treatment in the later stages of EAE, additional matched subgroups mice were treated with doses of CD200Fc or control mouse IgG2a, 100 μg/100 μl subcutaneously once every other day, starting from day 20 to day 30 (total dose per mouse, 600 μg).
Preparation of tissue for histology studies.
Animals were killed and perfused transcardially with 0.1 m PBS, followed by 4% paraformaldehyde or Bouin's solution (Electron Microscopy Systems). The spinal cords were collected at specified time points and dissected into lumbosacral, thoracic, and cervical segments. For paraffin embedding, tissues were stored in Bouin's solution for at least 48 h, and paraffin sections were prepared. For immunofluorescence staining, tissues were kept in 4% paraformaldehyde for 4 h, placed in a 30% sucrose gradient overnight, and then embedded in O.C.T. (Electron Microscopy Systems), quick frozen in liquid nitrogen, and stored at −80°C. Serial transverse sections were cut on a Frigocut cryostat.
RT-PCR.
Total RNA of cultured microglia, oligodendrocytes, or the spinal cords of control or EAE mice was extracted using TRIzol reagent (Invitrogen). As described in a previous publication (Rosenblum et al., 2005), RNA was transcribed to cDNA using oligo-dT primer (Sigma) and avian myeloblastosis virus reverse transcriptase (Promega). PCR was performed in GeneAmp 9700 (Applied Biosystems) with primers as follows: CD200R1 forward (5′-tacaaaggctctgctctgct-3′), CD200R1 reverse (5′-aagcagctggtttcattggt-3′), CD200R2 forward (5′-caaccaaaggctacacatgg-3′), CD200R2 reverse (5′-agggtttctccttccactga-3′), CD200R3 forward (5′-tggtgcctgagtcaagttgt-3′), CD200R3 reverse (5′-cccactccatcagggaag-3′), CD200R4 forward (5′-tgtgtctgttgtgtcctgctt-3′), CD200R4 reverse (5′-tggaagaaagcaaatcctacg-3′), glyceraldehyde-3-phosphate dehydrogenase (GAPDH) forward (5′-cgggaagcccatcaccatca-3′), and GAPDH reverse (5′-gaggggccatccacagtctt-3′). GAPDH mRNA was used as an internal control. The PCR products were detected on 2% agarose/Tris-acetate-EDTA gel. The expression of each target gene was normalized to the expression of the control gene GAPDH.
Immunofluorescent staining.
Twenty micromolar sections were first blocked in PBS containing 8% horse serum, 3% bovine serum albumin, and 0.3% Triton X-100 for 2 h at 4°C. The sections were then incubated with primary antibodies diluted 1:100 at 4°C overnight, followed by fluorescein- or rhodamine-labeled secondary antibodies diluted 1:250 (Invitrogen) for 2 h in blocking solutions. The following antibodies were used: anti-CD11b (clone M1/70, isotype rat IgG2b; BD Pharmingen)/secondary, Alexa fluor 594-conjugated goat anti-rat IgG (Invitrogen); anti-CD45 (clone 69, isotype mouse IgG1; BD Pharmingen)/secondary, Alexa fluor 488-conjugated goat anti-mouse IgG (Invitrogen); anti-CD4 (clone H129.19, isotype rat IgG2a; BD Pharmingen)/secondary, Alexa fluor 594-conjugated goat anti-rat IgG (Invitrogen); anti-CD8a (clone 53-6.7, isotype rat IgG2a; BD Pharmingen)/secondary, Alexa fluor 594-conjugated goat anti-rat IgG (Invitrogen); anti-CCL2 (clone 123606, isotype rat IgG2b; R & D Systems)/secondary, Alexa fluor 594-conjugated goat anti-rat IgG (Invitrogen); anti-nitrotyrosine (isotype rabbit IgG2b, N0409; Sigma-Aldrich)/secondary, Alexa fluor 594-conjugated donkey anti-rabbit IgG (Invitrogen); anti-GFAP (clone 2E1, isotype mouse IgG2b; BD Pharmingen)/secondary, Alexa fluor 594-conjugated goat anti-mouse IgG (Invitrogen); anti-CNPase (clone 11-5B, isotype mouse IgG1; Millipore Bioscience Research Reagents)/secondary, Alexa fluor 594-conjugated goat anti-mouse IgG (Invitrogen); and anti-caspase-3 (polyclonal, isotype rabbit IgG; BD Pharmingen)/secondary, Alexa fluor 488-conjugated donkey anti-rabbit IgG (Invitrogen).
Bielschowsky staining.
Sections cut from paraffin-embedded tissue were placed in a 20% silver nitrate solution at 37°C. Sections were washed in ammonia, and then a developer solution was added for 3–5 min until sections were black. Slides were rewashed in ammonia water, dH2O, fixed in 5% thiosulfate for 1 min, washed, dehydrated, and then mounted in Permount.
Luxol Fast Blue staining.
Sections were cut from paraffin-embedded tissue. Slides were placed in Luxol Fast Blue (LFB) solution overnight at 55°C, differentiated in alcohol, dipped in 0.05% lithium carbonate solution, and then counterstained with cresyl violet.
Axon loss and demyelination quantification.
Axon loss and demyelination were quantified as follows. Transverse spinal cord sections at the cervical, thoracic, and lumbar levels from mice at day 30 after immunization were stained with Bielschowsky or LFB, as described above. Photomicrographs were taken of sections from the anterior, lateral, and posterior sections of each spinal cord level, using specific landmarks for orientation. The area of regions with >50% axon loss or demyelinated areas were quantified, and percentage axon loss or demyelination was calculated compared with total white matter per section using the software NIH ImageJ.
TUNEL staining.
Terminal deoxynucleotidyl transferase-mediated biotinylated UTP nick end labeling (TUNEL) staining kit was purchased from Roche Molecular Biochemicals. Sections cut from O.C.T.-embedded tissue or coverslips with culture cells fixed with 4% paraformaldehyde were blocked in PBS containing 8% horse serum, 3% bovine serum albumin, and 0.3% Triton X-100 for 1 h at 4°C. The sections were next incubated with primary CD11b, GFAP, or CNPase antibody diluted 1:100 at 4°C overnight, followed by Alexa fluor 594-conjugated secondary antibodies diluted 1:250 (Invitrogen) for 2 h in blocking solutions. Then, the sections were stained with TUNEL solution for 1 h at 37°C, washed, and mounted in PBS.
Flow cytometric analysis of splenocytes, spinal cord homogenates, and cultured cells.
Splenocytes were collected from CD200Fc or control IgG2a-treated mice, washed, and resuspended in staining buffer (0.1 m PBS containing 1% bovine serum albumin). Mononuclear cells were isolated from the CNS of same animals as described previously. Briefly, spinal cords were isolated and passed through a 70 μm nylon filter, spun down, and resuspended in HBSS with 10 mmol/L HEPES and 2 mmol/L EDTA and incubated on a rotating shaker for 1 h at 4°C. The pellet was resuspended in 5 ml of isotonic 37% Percoll and spun down. Supernatants were removed, and the pellet was resuspended in staining buffer. Cultured cells were washed with staining buffer twice before staining. Cells were then incubated with the indicated antibodies for 30 min on ice, washed twice, and analyzed on a FACSCaliber cytometer. For intracellular staining, cells were first fixed with Cytofix/Cytoperm (BD Pharmingen). Antibodies used for flow cytometric studies included FITC- or phycoerythrin (PE)-conjugated antibodies to CD11b (clone M1/70), CD45 (clone 30-F11), CD4 (clone GK1.5), CD8a (clone 53-6.7), CD19 (clone 1D3), CD28 (clone 37.51), LFA-1 (clone 2D7), VLA-4 (clone 9C10), IL-6 (clone MP5-20F3), IL-10 (clone JES5-16E3), IL-12 (clone C15.6), IL-17 (clone TC11-18H10), tumor necrosis factor-α (TNF-α) (clone MP6-XT22), interferon-γ (IFN-γ) (clone XMG1.2), MHC-II (clone AF6-120.1), B7-1 (clone 16-10A1), B7-2 (clone GL1), CD40 (clone 3/23), annexin V and adenomatous polyposis coli (APC)-conjugated CD11c antibody (clone HL3), as well as isotype controls (all from BD Pharmingen). PE-conjugated TGF-β (clone TB21) was obtained from IQ Products. APC-conjugated FoxP3 antibody (clone FJK-16s) was obtained from eBioscience. PE-conjugated CD200R antibody (clone OX-110) was obtained from Serotec. For astrocyte analysis, cells were stained with purified GFAP antibody (clone 2E1; BD Pharmingen), followed by FITC-conjugated secondary antibody (BD Pharmingen).
Proliferation assays.
To analyze the effect of CD200Fc on antigen-presenting function of microglia/macrophages and dendritic cells (DCs) in the CNS, dissociated cells were prepared from the spinal cords of CD200Fc or control IgG2a-treated mice on day 20. CD11b+ and CD11c+ cells were labeled with FITC-conjugated antibodies and isolated by fluorescence sorting. CD4+ T cells were purified from the spleens of 2D2 mice through negative selection using CD4+ T cell isolation kit (Miltenyi Biotec). Purified CD4+ T cells (1 × 10⁵/well) were then cultured in 96-well tissue culture plates in complete RPMI 1640 medium and stimulated with 100 μm MOG in the presence of irradiated CD11b+ (1 × 10⁵/well) or CD11c+ (1 × 10⁵/well) cells prepared above as APCs. After 48 h of culture, cells were pulsed with [3H]thymidine (0.5 μCi/well), and, 16 h later, thymidine incorporation was measured using a liquid scintillation beta counter. Cytokine production in supernatants was determined by ELISA or Luminex assays. To analyze the effect of CD200Fc treatment on adaptive T cell responses, CD4+ T cells were isolated from the spleens of CD200Fc or control-treated mice on day 20 as described above. APCs were purified from the spleens of control-treated animals using APC isolation kit (Miltenyi Biotec) and were irradiated. Purified CD4+ T cells (4 × 10⁵/well) were then stimulated with 100 μm MOG in the presence of APCs (4 × 10⁵/well). Cell proliferation was also determined by [3H]thymidine incorporation after 48 h stimulation, and cytokine concentration in the supernatants was determined by ELISA or Luminex assays.
Primary microglia culture and treatments.
Primary cultures of microglia were prepared by a method modified from that described by McCarthy and de Vellis (Fedoroff et al., 2001). In brief, cerebral cortices were harvested from 1- to 2-d-old newborn C57BL/6 mice (Charles River Laboratories), and the meninges were completely removed. The tissue was then minced quickly and disaggregated with 0.025% trypsin (Sigma) at 37°C for 20 min. Then, ice-cold fetal bovine serum (FBS) was added to inactivate the trypsin activity. The cell suspension was centrifuged and resuspended in DMEM (Invitrogen) supplemented with 10% FBS, 2 mm l-glutamine, and 2-mercaptoethanol (Sigma). After two washes with fresh medium, the cells were plated into poly-l-lysine-precoated 75 cm2 plastic flasks at a high density of 12 × 106 cells per flask. The medium was changed after 24 h and then twice a week. The cells were cultured at 37°C for 14–16 d. At the end of the culture period, medium was changed and adherent cells were trypsinated down, stained with FITC-conjugated CD11b antibody. Labeled microglia (CD11b+) were isolated by a fluorescent cell sorter. The purified microglia were resuspended with fresh medium, and 1 × 10⁵ microglia in a volume of 0.5 ml were plated into each 35 mm culture dish well precoated with 0–100 μg/ml CD200Fc or control IgG2a. Six hours later, 0.1 μg/ml LPS (Sigma) or 10 ng/ml IFN-γ (Sigma) was added to stimulate the microglia.
Primary astrocyte culture and treatments.
Astrocyte cultures were prepared as described previously (Fedoroff et al., 2001). Cerebral cortices were harvested from 2-d-old newborn C57BL/6 mice (Charles River Laboratories), and the meninges were completely removed. The tissue was enzymatically digested as described above. The dissociated cells were plated in poly-l-lysine-precoated 75 cm2 plastic flasks at a high density of 12 × 106 cells per flask. The culture medium was DMEM (Invitrogen) supplemented with 10% FBS and 2 mm l-glutamine. The cells were cultured at 37°C for 10 d to confluence. The flasks were then tightly sealed and shaken at 300 rpm for 24 h. Suspended cells in the flasks were discarded after shaking, and >95% of the adherent cells were flat, polygonal astrocytes, which were identified by morphology and flow cytometry analysis. Fresh medium was added, and cultures were allowed to rest for 1 d. After that, astrocytes were trypsinated down and resuspended in medium, and 1 × 10⁵ cells in a volume of 0.5 ml were plated into each 35 mm culture dish well precoated with 0–100 μg/ml CD200Fc or control IgG2a. Six hours later, 1 μg/ml LPS or 10 ng/ml IFN-γ plus 5 ng/ml TNF-α (Sigma) was added to stimulate the astrocytes.
Primary oligodendrocyte culture and treatments.
Primary oligodendrocyte cultures were prepared as described previously (Bando et al., 2006). Cerebral hemispheres were harvested from 1-d-old newborn C57BL/6 mice (Charles River Laboratories). Meninges were trimmed completely. The tissue was enzymatically digested, and the dissociated cells were resuspended in DMEM (Invitrogen) containing 10% FBS and 2 mm l-glutamine. The resuspended cells were plated in poly-l-lysine-precoated 75 cm2 plastic flasks at a density of 12 × 106 cells per flask. After 7–9 d of culture, the flasks were tightly sealed and shaken at 100 rpm at 37°C to release the oligodendrocyte progenitors into the medium. The medium from flasks was spun, and the resulting pellets were resuspended in DMEM with 2% FBS and Bottenstein and Sato's supplement including 0.1 mg/ml transferrin, 0.1 mg/ml BSA, 60 ng/ml progesterone, 40 ng/ml sodium selenite, 40 ng/ml thyroxine, 30 ng/ml triiodothyronine, 16 μg/ml putrescine, and 5 μg/ml insulin (all from Sigma). Two hundred thousands cells in a volume of 0.5 ml were plated into each well in poly-l-lysine-precoated 35 mm culture dishes. Cultures were allowed to mature for 7 d for experiments. As determined by immunostaining with anti-CNPase antibody, >90% of cells isolated by this replating procedure were oligodendrocytes. The matured oligodendrocytes were then treated with LPS, 50 ng/ml TNF-α, or IFN-γ in the presence of 0–100 μg/ml control IgG2a or CD200Fc.
Cytokine ELISA and Luminex assays.
Cells were cultured and stimulated in the presence of CD200Fc or control IgG2a as described above. For TGF-β analysis, cells were cultured in X-VIVO serum-free medium (Lonza). Culture supernatants were collected 48 h later, and the levels of different cytokines were measured in triplicate using commercially available ELISA kits (BD Biosciences) and 21-cytokine or TGF-β Luminex kits (Millipore). Luminex assays were performed according to the protocol supplied by the company. Nitric oxide (NO) level in the supernatant was measured using an NO detection kit (R & D Systems).
Apoptosis assays.
For detection of apoptosis, cultured microglia or astrocytes after indicated treatments were washed twice in PBS. The cell pellets were resuspended in binding buffer containing annexin V-FITC (BD Biosciences) and propidium iodide (PI) (BD Biosciences) for 20 min at room temperature. The samples were analyzed on a FACSCaliber cytometer within 1 h.
Statistical analysis.
Data are expressed as the mean ± SEM unless otherwise specified. Data on the effect of CD200Fc versus control IgG2a treatments on EAE were analyzed using two-way ANOVA with Fisher's protected least significant difference post hoc tests for multiple comparisons. Unpaired two-tailed t tests were used to compare the mean values between two groups. Values of p < 0.05 were considered statistically significant.
Results
Expression of CD200 receptors in EAE
There is considerable evidence indicating that CD200R1 is the dominant ligand for CD200, but CD200R-related molecules that likely arose from duplication have been described. One CD200R-related molecule has been described in human (hCD200RLa), and four have been described in mouse (mCD200RLa/mCD200R4, mCD200RLb/mCD200R3, mCD200RLc/mCD200R2, and mCD200RLd/mCD200R5) (Wright et al., 2003). We first investigated the expression of isoforms of CD200R in a chronic model of EAE. RT-PCR results demonstrated that CD200R1 was expressed in the CNS of naive C57BL/6 mice under physiological condition, and its expression level was significantly enhanced during EAE (Fig. 1A,B, p < 0.001). CD200R2 was also constitutively expressed in the naive spinal cord but its expression did not increase in EAE samples. The expression level of CD200R3 and CD200R4 was minimal in control mice, but only CD200R4 increased slightly during EAE (Fig. 1A,B, p < 0.001). Based on these findings as well as published results in human MS, we chose to investigate the effects of CD200R1 ligation in EAE.
Figure 1.

CD200 receptors expression in the CNS of EAE mice. A, EAE was induced in C57BL/6 mice with 200 μg of MOG35–55. Control mice (C) or mice with average clinical EAE scores at day 18–20 after immunization were killed, and the whole spinal cords were collected. RT-PCR study revealed that the expression of CD200R1 and CD200R4 were significantly increased in EAE compared with controls. B, The expression of each CD200R gene was normalized to the expression of control gene GAPDH. **p < 0.001 versus controls.
Characterization of CD200R1 agonist
For the present study, we used a dimeric CD200 fusion protein consisting of the extracellular domain of murine CD200 fused to the Fc domain of murine IgG2a (CD200Fc). CD200Fc has been reported previously to either interact specifically with CD200R1 but not CD200R2-R5 (Wright et al., 2003; Hatherley et al., 2005) or to interact with CD200R1 and CD200R2-R4 homologs (Gorczynski et al., 2004). To test binding of murine CD200Fc to CD200R family members, gD-tagged murine or human CD200R1 were transiently expressed in HEK 293 cells, whereas gD-tagged CD200R2-R5 homologs were expressed in HEK 293 cells stably expressing FLAG–DAP12. As shown in supplemental Figure 1 (top panel, available at www.jneurosci.org as supplemental material), CD200R family members were highly expressed on the cell surface. Murine CD200Fc bound to murine and human CD200R1 but not to murine CD200R2, CD200R3, CD200R4, or CD200R5 (supplemental Fig. 1, bottom panel, available at www.jneurosci.org as supplemental material).
Administration of CD200Fc during the effector phase of EAE attenuates disease course
Immunized mice developed severe EAE, with onset of clinical signs occurring on days 9–10 after immunization. Symptoms peaked at days 14–17 and were followed by a stable chronic phase of disease. To investigate the protective effects of CD200 during the chronic effector phase of EAE, CD200Fc or control mouse IgG2a was administered at the onset of neurological symptoms (day 10). An untreated group was included for comparison. CD200Fc or control IgG2a was administered every other day at a dose of 100 μg by subcutaneous injection from symptom onset to day 30. We assessed CD200Fc and control IgG2a administration efficiency by immunofluorescent studies, which demonstrated that, after onset of EAE, both CD200Fc and control IgG2a successfully crossed the blood–brain barrier and entered the spinal cord in lesioned areas (Fig. 2A).
Figure 2.
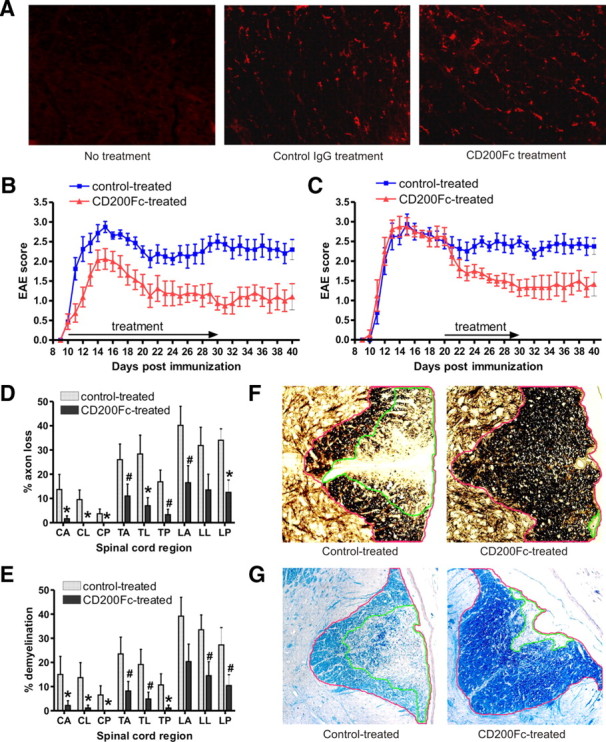
CD200Fc treatment attenuates the course of EAE and decreases axonal loss and demyelination in the spinal cords. A, Representative IgG2a antibody-stained sections of the thoracic spinal cord from control mouse IgG2a- and CD200Fc-treated mice on day 15 after immunization show abundance of mouse IgG2a and CD200Fc. B, EAE was induced in C57BL/6 mice, and animals with onset of EAE at day 10 were chosen and treated with CD200Fc versus control IgG2a from days 10 to 30. Disease was monitored daily from days 0 to 40. Shown is the mean disease grade from a composite of three separate experiments (20 control-treated mice, 20 CD200Fc-treated mice). CD200Fc treatment starting from the onset significantly ameliorated course of EAE. C, Animals were treated with CD200Fc versus control IgG2a from day 20 (10 control-treated mice, 10 CD200Fc-treated mice). CD200Fc treatment starting in the late stage also inhibited EAE progression. D, Quantification of axonal loss in anterior (A), lateral (L), and posterior (P) sections of Bielschowsky silver-stained sections from cervical (C), thoracic (T), and lumbar (L) levels of the spinal cord from control- or CD200Fc-treated mice at day 30. Results from six spinal cords per group are averaged and shown. Average EAE disease grade for control-treated mice used for tissue analysis at the time of tissue harvesting was 2.52 ± 0.71, whereas average score for CD200Fc-treated mice used was 1.31 ± 0.85. CD200Fc decreased axonal loss in spinal cord lesions. E, Quantification of demyelination was performed using Luxol fast blue-stained sections and showed less demyelination in CD200Fc-treated mice at all levels of the spinal cord, particularly in the cervical–thoracic cord. F, Demonstration of quantification method used to calculate axonal loss. Transverse sections of the lumbar spinal cord from both control- and CD200Fc-treated mice were stained with the Bielschowsky method. The NIH ImageJ program was used to calculate areas. The area with >50% axonal loss (outlined in green) was divided by the total white matter area of the column (outlined in red), thus quantifying percentage axonal loss, which was represented in D and F. G, Demonstration of method used to quantify demyelination. Transverse sections of the lumbar spinal cord were stained with Luxol fast blue. Areas with demyelination (outlined in green) were divided by the total white matter area of the column (outlined in red), thus measuring percentage demyelination represented in E and G. Data are presented as means ± SEM. #p < 0.05; *p < 0.01 versus controls.
The composite results of three separate experiments are summarized in Figure 2B and Table 1. Control IgG2a treatment showed no influence on the course or severity of disease. In contrast, CD200Fc initiated after disease onset significantly reduced EAE severity (F(1,1088) = 702.84, p < 0.001). CD200Fc-treated mice had a significantly lower mean maximal clinical score (2.31 ± 0.98 and 1.75 ± 0.73 for days 10–20 and days 20–30, respectively) compared with control-treated animals (3.06 ± 0.31 and 2.81 ± 0.55 for days 10–20 and days 20–30, respectively) (p < 0.01) (Fig. 2B, Table 1). At the end of the treatment period on day 30, CD200Fc completely inhibited the clinical signs of EAE in 5 of 20 treated mice. Many CD200Fc-treated mice showed only tail weakness, whereas most of the control-treated mice experienced severe hindlimb paraparesis.
Table 1.
Effects of CD200Fc versus control treatment on chronic EAE in C57BL/6 mice
| No. of mice | Onset | Mean maximal grade |
No. of deaths | Area under curve | |||
|---|---|---|---|---|---|---|---|
| Onset to day 20 | Days 20–30 | Days 30–40 | |||||
| Nontreated | 12 | 10 | 2.98 ± 0.26 | 2.75 ± 0.51 | 2.53 ± 0.64 | 0 | 62.63 ± 8.63 |
| Control IgG2a-treated | 20 | 10 | 3.06 ± 0.31 | 2.81 ± 0.55 | 2.62 ± 0.62 | 0 | 69.98 ± 9.25 |
| CD200Fc-treated | 20 | 10 | 2.31 ± 0.98* | 1.75 ± 0.73** | 1.50 ± 0.89** | 0 | 37.51 ± 7.45* |
Subgroups of mice with onset of EAE at day 10 after immunization were chosen, treated with CD200Fc versus control IgG2a from days 10 to 30. Data are presented as means ± SD. Statistical comparison was made using two-tailed t test.
*p < 0.01;
**p < 0.001 versus control IgG2a-treated group.
To elucidate the effects of CD200R agonism on the chronic effector stages of disease, we initiated treatment at a late time point (from day 20 to 30), well after T cell priming had occurred in this model. Our results showed that CD200Fc treatment at this stage also effectively reduced disease severity (F(1,448) = 102.03, p < 0.001) (Fig. 2C). The therapeutic effect of CD200Fc lasted beyond the period of administration. For each therapy regimen, we monitored the clinical disease daily until day 40. Disease did not rebound after CD200Fc treatment ceased (Fig. 2B,C, Table 1).
CD200Fc-induced disease attenuation is associated with decreased axonal loss and demyelination in the spinal cord. Histopathological studies were performed in the spinal cords of control IgG2a- and CD200Fc-treated mice at 30 d, in mice treated from symptom onset to day 30. Six mice per group were selected for examination of axonal loss and demyelination, which were assessed by Bielschowsky's silver staining and LFB staining, respectively. The average EAE disease grade for control-treated mice used for tissue analysis at the time of harvesting was 2.52 ± 0.71, whereas the average score in CD200Fc-treated mice used was 1.31 ± 0.85, consistent with disease grades recorded in Figure 2B and Table 1. As shown in Figure 2, D and E, all control IgG2a-treated mice developed pronounced axonal loss and demyelination in the spinal cord lesions. CD200Fc reduced both axonal loss and demyelination in the treated mice at all levels of the spinal cord, particularly in the cervical–thoracic cord. Total axonal loss was significantly lower in CD200Fc-treated animals (7.27 ± 2.71%) compared with control IgG2a-treated animals (28.67 ± 4.47%, p < 0.001). Similarly, total demyelination was diminished in CD200Fc-treated mice (6.92 ± 2.75%) compared with control-treated mice (20.93 ± 4.44%, p < 0.001). The methods used to calculate axonal loss and demyelination are outlined in Figure 2, F and G, and in previous publications (Chitnis et al., 2007).
CD200Fc treatment diminishes microglia and macrophage infiltration into the spinal cord
Increasing evidence suggests that microglia and macrophages play an essential role in mediating CNS damage during the effector stages of EAE. Because the CD200–CD200R pathway is important in the modulation of myeloid cell function, to understand the underlying mechanisms of EAE attenuation by CD200Fc, we investigated its effects on microglia and macrophage accumulation and activation in the CNS. We first analyzed the inflammatory infiltrate into the spinal cords of control- and CD200Fc-treated animals at two time points (days 15 and 30) using flow cytometry of the whole spinal cords and immunofluorescent staining of thoracic spinal cord sections. CD11b and CD45 were used as markers for detecting microglia (CD11b+CD45lo) and macrophage (CD11b+CD45hi). Both immunofluorescent staining and flow cytometry demonstrated that CD200Fc treatment started at disease onset substantially reduced the number of microglia in the spinal cord (Fig. 3A,B). In addition, as shown in Figure 3A, in control-treated mice with EAE, microglia developed an enlarged cell body and became deramified. In CD200Fc-treated animals, microglia demonstrated a typical resting state morphology with long and thin processes. The difference observed in microglia morphology suggested that CD200Fc suppresses microglial activation.
Figure 3.

CD200Fc treatment diminishes microglia and macrophage infiltration into the spinal cord. A, Immunofluorescent staining revealed large numbers of microglia (CD11b+CD45lo) and macrophages (CD11b+CD45hi) in the spinal cords of control-treated animals at days 15 and 30, which were reduced in mice that received CD200Fc treatment. Quantification confirmed significant reduction in CD11b+ cells in the spinal cord of CD200Fc-treated mice. For quantification study, cell numbers were counted in anterior (A), lateral (L), and posterior (P) areas of CD11b antibody-stained transverse sections from thoracic level of the spinal cord. Three representative high-magnification fields (200×) were chosen for each area, and the counts were averaged. Results from six spinal cords per group are shown. C, Cervical; T, thoracic; L, lumbar; dpi, days postimmunization. B, The results of flow cytometry for the spinal cord cells of control- and CD200Fc-treated mice were consistent with immunofluorescent staining study. In contrast, flow cytometric analysis showed more CD11b+ cell accumulation in the spleens of CD200Fc-treated animals at day 15 than in control-treated animals. Four to six mice per group with average clinical EAE were included in this study. Average total cell numbers per spinal cord and per spleen were described in Table 2. C, Flow cytometry study for the same spinal cord and spleen cell samples harvested at days 15 and 30 indicated downregulation of LFA-1 and VLA-4 expression in CD11b+ cells after CD200Fc treatment. LFA-1 and VLA-4 expression was analyzed with gating on live CD11b+ cells. MFI, Mean fluorescence intensity. D, Immunofluorescent staining demonstrated that expression of CCL-2 was not altered in the spinal cords of CD200Fc-treated animals. Results from one representative donor of four in each group are shown. Data are presented as means ± SEM. **p < 0.001 versus controls.
Macrophage infiltration into the spinal cord was also diminished in CD200Fc-treated mice (Fig. 3A,B). Interestingly, at day 15, total splenocyte cell numbers and the percentage of macrophages in the spleen was higher in CD200Fc-treated mice when compared with control-treated mice (Fig. 3B, Table 2), which suggested that CD200Fc might inhibit macrophage migration from the peripheral lymphoid system to the CNS. We therefore examined possible underlying mechanisms. Consistent with the above results, flow cytometric analysis showed that CD200Fc strikingly downregulated the expression of LFA-1 and VLA-4 in CD11b+ cells, important adhesion molecules for inflammatory cell recruitment to the CNS (Fig. 3C). However, CD200Fc treatment did not reduce the expression of CCL2, which is mainly derived from astrocytes and is an important chemokine in the recruitment of CD11b+ cells to the CNS in EAE (Fig. 3D).
Table 2.
Effects of CD200Fc treatment on the infiltration of CD11b+ and other inflammatory cell types into the spinal cord-flow cytometric analysis
| 15 d after immunization |
30 d after immunization |
|||||||
|---|---|---|---|---|---|---|---|---|
| Spinal cord |
Spleen |
Spinal cord |
Spleen |
|||||
| Control-treated | CD200Fc-treated | Control-treated | CD200Fc-treated | Control-treated | CD200Fc-treated | Control-treated | CD200Fc-treated | |
| %CD11b+CD45+ | 2.48 ± 0.39 | 1.16 ± 0.19** | 11.76 ± 1.86 | 16.56 ± 1.88* | 5.26 ± 0.59 | 2.19 ± 0.56** | 11.85 ± 2.76 | 9.10 ± 1.75 |
| %CD11b +CD45− | 5.59 ± 0.49 | 3.75 ± 0.56* | 4.67 ± 0.45 | 3.92 ± 0.40# | ||||
| %CD4+ | 3.00 ± 0.52 | 2.15 ± 0.40# | 26.51 ± 3.54 | 23.28 ± 3.38 | 1.82 ± 0.33 | 1.52 ± 0.29 | 23.13 ± 3.72 | 23.37 ± 3.32 |
| %CD8+ | 2.63 ± 0.48 | 1.95 ± 0.32# | 14.16 ± 2.17 | 12.61 ± 2.18 | 1.42 ± 0.36 | 1.16 ± 0.35 | 11.25 ± 3.35 | 11.55 ± 3.65 |
| %CD19+ | 1.82 ± 0.47 | 1.52 ± 0.50 | 48.56 ± 6.13 | 46.54 ± 4.88 | 1.20 ± 0.32 | 1.06 ± 0.21 | 41.52 ± 5.55 | 42.70 ± 7.38 |
| %Gr-1+ | 1.41 ± 0.31 | 1.13 ± 0.30 | 2.11 ± 0.56 | 1.16 ± 0.45# | ||||
| Total number of cells/spinal cordor spleen (×106) | 1.17 ± 0.23 | 0.66 ± 0.15* | 94.05 ± 9.86 | 127.75 ± 13.71* | 0.88 ± 0.14 | 0.52 ± 0.12* | 98.85 ± 12.03 | 96.27 ± 11.30 |
Four to six mice per group with average clinical EAE were examined. Mice were treated with CD200Fc versus control IgG2a from day 10. At day 15 or 30, the treated animals were killed, and flow cytometric analysis was performed for spleenocytes or cells isolated from spinal cord homogenates. All molecule expression was analyzed with gating on live cells. Data are presented as means ± SD. Statistical comparison was made using two-tailed t test.
#p < 0.05;
*p < 0.01;
**p < 0.001 versus control-treated groups.
Effect of CD200Fc on T cell activity in EAE
To analyze the cells comprising the inflammatory infiltrate into the CNS during EAE, we also assessed frequencies of other cell types, including CD4+, CD8+, CD19+, and Gr-1+ cells using flow cytometry of whole spinal cord. The frequencies of all these types of inflammatory cells in the spinal cord were decreased to varying degrees in CD200Fc-treated mice because the disease was ameliorated (supplemental Fig. 2A, available at www.jneurosci.org as supplemental material) (Table 2). However, in all cases, the production of some proinflammatory cytokines, such as IFN-γ and IL-17, by infiltrating T cells was unaffected by CD200Fc treatment. Flow cytometric analysis showed that the proportion of IFN-γ-producing CD4 and CD8 cells and IL-17-producing CD4 cells were similar in CD200Fc and control-treated mice, despite lower overall cellular frequencies in CD200Fc-treated animals (supplemental Fig. 2B, available at www.jneurosci.org as supplemental material). Moreover, we found that CD200Fc treatment did not change the proportion of CD4+Foxp3+ or CD8+CD28− regulatory T cells in the spinal cord. Similar results were observed in the spleen of CD200Fc-treated mice (data not shown).
We then explored whether CD200Fc affected adaptive T cell responses. CD4 cells were harvested from the spleens of control- and CD200Fc-treated EAE mice on day 20 and stimulated with MOG in the presence of APCs from control-treated mice. Although at this time point clinical disease was significantly ameliorated by CD200Fc, there was no difference in T cell proliferation and proinflammatory cytokine (IL-2 and IFN-γ) production during antigen-specific stimulation between control- and CD200Fc-treated groups (data not shown). In summary, these results indicate that CD200Fc treatment does not significantly alter adaptive T cell autoimmune responses in EAE.
CD200Fc suppresses microglia/macrophage activity in the effector stages of EAE
To further elucidate the mechanisms underlying EAE suppression by CD200Fc, we investigated the effect of CD200Fc treatment on activation of CD11b cells existing in inflammatory sites. Mononuclear cells were isolated from the spinal cords of control- and CD200Fc-treated mice with EAE at days 15 and 30 after immunization. Flow cytometry results demonstrated that the expression of two important proinflammatory cytokines, IL-6 and TNF-α, were significantly decreased in CD11b cells after CD200Fc treatment (Fig. 4A). However, CD200Fc did not change the expression of IL-10 and TGF-β1 (Fig. 4A), suggesting that CD200Fc did not induce immune deviation. Similar results were observed for the effect of CD200Fc treatment on splenic CD11b cell cytokine expression. Although CD200Fc strongly reduced the expression level of IL-6 and TNF-α, the therapeutic effect was not associated with a change in IL-10 and TGF-β1 expression (Fig. 4A). In addition, CD200Fc treatment did not alter the expression of IL-12 in the spleen (Fig. 4A).
Figure 4.

CD200Fc inhibits microglia/macrophage activity in the effector stages of EAE. A, Immune cell populations were isolated from the spinal cords and spleens of control- and CD200Fc-treated mice 15 and 30 days postimmunization (dpi). Cytokine expression was analyzed by flow cytometry with gating on live CD11b+ cells. Four to six mice per group with average clinical EAE were included, and data shown are representative results. CD200Fc treatment significantly decreased the production of IL-6 and TNF-α but not IL-10 or TGF-β in CD11b cells in both spinal cords and spleens of treated animals. MFI, Mean fluorescence intensity. B, Primary cultures of C57BL/6 mouse microglia were stimulated in vitro with LPS in the presence of different concentrations of CD200Fc versus control IgG2a. Supernatants were collected at 48 h, and cytokines were measured using a 21-cytokine Luminex kit. Results showed that CD200Fc treatment inhibited the activation-induced production of IL-6 and TNF-α on primary microglia. Data shown are representative of four independent experiments. *p < 0.01; **p < 0.001 versus controls. C, Primary cultures of microglia were stimulated with IFN-γ for 48 h. The NO level in the supernatant was then measured using a NO detection kit. CD200Fc significantly decreased IFN-γ-triggered microglial NO production. Data shown are representative of four independent experiments. *p < 0.01; **p < 0.001 versus controls. D, Spinal cords were harvested from control- or CD200Fc-treated mice with average clinical EAE in each group on day 30. Immunofluorescent staining in thoracic sections demonstrated that CD200Fc treatment diminished nitrotyrosine production in the spinal cord lesions. Adjacent spinal cord sections to those in Figure 3A and supplemental Figure 2A (available at www.jneurosci.org as supplemental material) were used. Results from one representative donor of five in each group are shown.
We next performed in vitro experiments to test the possibility that CD200Fc acted directly on CD11b cells to block the proinflammatory cytokine expression. As shown in Figure 4B, CD200Fc treatment effectively suppressed the activation-induced production of IL-6 and TNF-α on primary microglia cultures. Production of several other cytokines, assessed by Luminex assay, including IFN-γ, IL-1α, IL-1β, IL-2, IL-4, IL-10, and TGF-β1 on microglia were very low, and we did not observe significant difference in production of these cytokines between CD200Fc- and control-treated groups (data not shown).
Previous studies have demonstrated that microglia/macrophage are an important source of free radicals, and oxidative stress caused by these molecules, especially NO and peroxynitrite, is involved in the neurodegenerative component of chronic EAE (Basso et al., 2008). We then asked whether CD200Fc would interfere with NO production by activated microglia. Our results showed that addition of CD200Fc significantly diminished IFN-γ-triggered NO production in primary microglial cultures (Fig. 4C). We further examined nitrated proteins in the spinal cord of CD200Fc-treated mice to determine whether reduction of CD11b cell activity was associated with less oxidative injury. We observed intense staining for nitrotyrosine in control-treated animals (Fig. 4D), which correlated well with microglial/macrophage inflammatory infiltrates (Fig. 3A). In contrast, protein tyrosine nitration was almost absent in CD200Fc-treated mice, although some activated CD11b cells were still present in the spinal cords (Fig. 4D).
CD200Fc inhibits antigen-presenting function of microglia/macrophages and DCs in the CNS
Microglia/macrophages and DCs can serve as effective APCs for T cells in the CNS during EAE and thereby initiate and propagate disease. Because CD200R is specifically highly expressed in microglia/macrophages and DCs, we hypothesized that CD200Fc might inhibit their antigen-presenting capacity. Both in vivo and in vitro data indicated that CD200Fc treatment significantly suppressed activation-induced upregulation of class II MHC molecules in CD11b+ and CD11c+ cells in the CNS (Fig. 5A,B). Similar results were observed in CD11b+ and CD11c+ cells from the spleen (Fig. 5A). In addition, CD200Fc treatment reduced CD80 (B7-1) expression on CD11b+ and CD11c+ cells (see Fig. 5A,B). However, treatment with CD200Fc did not alter the expression of CD86 (B7-2) or CD40 on activated CD11b+ and CD11c+ cells isolated from the spleen or the CNS (Fig. 5A,B).
Figure 5.

CD200Fc inhibits antigen-presenting activity of microglia/macrophages and DCs. A, Immune cell populations were isolated from the spinal cords and spleens of control- and CD200Fc-treated mice on days 15 and 30. MHC-II, CD80 (B7-1), CD86 (B7-2), and CD40 expressions were analyzed by flow cytometry with gating on live CD11b+ or CD11c+ cells. Four to six mice per group with average clinical EAE were included, and data demonstrated are representative results. Histograms and quantifications on the same gating are shown. CD200Fc downregulated the expression of MHC-II and CD80 (B7-1), but not CD86 (B7-2) or CD40, in CD11b+ and CD11c+ cells. B, Primary cultures of microglia were stimulated in vitro with 10 ng/ml IFN-γ (for MHC-II) or 0.1 μg/ml LPS (for CD80, CD86, and CD40) in the presence of 100 μg/ml control IgG2a or CD200Fc. Cells were collected at 48 h, and the expressions of MHC-II, CD80, CD86, and CD40 were analyzed by flow cytometry. Similar effects of CD200Fc as in vivo were observed. Data demonstrated are representative of four independent experiments. Histograms and quantifications on the same gating are shown. C, CD11b+ and CD11c+ cells were isolated using fluorescence sorting from the spinal cords of six control- and six CD200Fc-treated mice, respectively, with average clinical EAE on day 20. The cells were used as APCs in vitro to stimulate cultured 2D2 mouse T cells in the presence of 100 μm MOG. At 48 h, cell proliferation was measured by [3H]thymidine incorporation. IL-2 and IFN-γ production was determined by Luminex assays. *p < 0.01 versus controls. MFI, Mean fluorescence intensity.
To directly assess the inhibitory effect of CD200Fc on antigen-presenting function of microglia/macrophages and DCs, CD11b+ and CD11c+ cells were isolated from the spinal cords of control- and CD200Fc-treated mice on day 20. The cells were used as APCs in an in vitro assay to stimulate naive 2D2 mouse T cells, which can be readily activated by MOG peptide through effective T-cell receptor signaling (Bettelli et al., 2006). We found that CD200Fc treatment significantly impaired the antigen-presenting action of CD11b+ and CD11c+ cells (Fig. 5C). 2D2 T cell proliferation to MOG peptide in the presence of CD11b or CD11c cells from CD200Fc-treated mice was reduced by 45.1 ± 5.9% (p < 0.01) and 53.8 ± 6.6% (p < 0.01), respectively, compared with that in the presence of control CD11b or CD11c cells (Fig. 5C). Subsequently, the production of proinflammatory cytokines, including IL-2 and IFN-γ, were markedly reduced (Fig. 5C). Similar results were found in the spleens of CD200Fc-treated mice (data not shown).
CD200Fc treatment inhibits astrocyte activity in EAE
Increasing evidence has demonstrated that astrocytes play a role in the pathogenesis of MS. Astrocytes in active chronic plaques of MS express high levels of MHC class II molecules (Zeinstra et al., 2000). Mahad et al. (2006) showed that astrocytes are a major source of many chemokines, including CCL-2, which attract inflammatory cells to the CNS in EAE (Mahad et al., 2006). Our previous studies have demonstrated that both CD200 and CD200R are upregulated on astrocytes during EAE (Chitnis et al., 2007). We therefore asked whether CD200Fc treatment inhibited astrocyte activity in the EAE model. In control IgG2a-treated mice, as demonstrated by immunofluorescent staining, astrocytes in spinal cord lesions became activated and developed enlarged cell bodies (Fig. 6A). In contrast, mice treated with CD200Fc, astrocytes remained in a resting state (Fig. 6A).
Figure 6.

CD200Fc treatment inhibits astrocyte activity in EAE. A, Thoracic spinal cord sections were obtained from control- or CD200Fc-treated mice with average clinical EAE in each group at days 15 and 30. Enlarged astrocytes are seen in the control IgG2a group (arrows) but not in the CD200Fc-treated group at both time points. Results from one representative donor of four in each group are shown. B, Primary C57BL/6 mouse astrocytes were cultured with 10 ng/ml IFN-γ plus 5 ng/ml TNF-α stimulation for 48 h in the presence of CD200Fc or control IgG2a. Supernatants were then collected and cells were harvested. IL-6, CCL-2, and NO levels in the supernatant were measured using a 21-cytokine Luminex kit and an NO detection kit, respectively. MHC-II expression in astrocytes with different treatments was analyzed by flow cytometry. Histograms and quantifications on the same gating are shown. The treatment of CD200Fc at 100 μg/ml reduced IL-6, CCL-2, and NO production and MHC-II expression in activated astrocytes. Data shown are representative of four independent experiments. *p < 0.01 versus controls. dpi, Days postimmunization; MFI, mean fluorescence intensity.
The inhibitory effects of CD200Fc on astrocyte activity were confirmed in vitro. Luminex and ELISA studies demonstrated that CD200Fc significantly diminished the production of IL-6, NO, and CCL-2 in primary cultures of astrocytes activated with IFN-γ plus TNF-α (Fig. 6B). Flow cytometry analysis indicated that CD200Fc treatment also downregulated the expression of class II MHC molecules in activated astrocytes (Fig. 6B). However, we found that, different from its effects on microglia, CD200Fc inhibited astrocyte activation only at a high concentration (Figs. 6B vs 4B,C).
CD200Fc treatment induces apoptosis of microglia/macrophages but not astrocytes or oligodendrocytes in EAE
Inhibition of microglia/macrophage activity in EAE after CD200Fc treatment could be attributable to either functional suppression or elimination of activated cells. During the flow cytometric analysis, cellular distribution demonstrated higher percentages of dead immune cells in the spinal cords of CD200Fc-treated animals than in controls. We then examined whether CD200Fc induced microglia/macrophage deletion in EAE. Immune cell populations were isolated from the spinal cords and the spleens of control- and CD200Fc-treated mice at days 15 and 30. Annexin V staining was used to detect cell apoptosis. Our results showed that CD200Fc treatment markedly increased the proportion of apoptotic CD11b+ cells in both spinal cords and spleens of EAE mice at day 30 (Fig. 7A).
Figure 7.
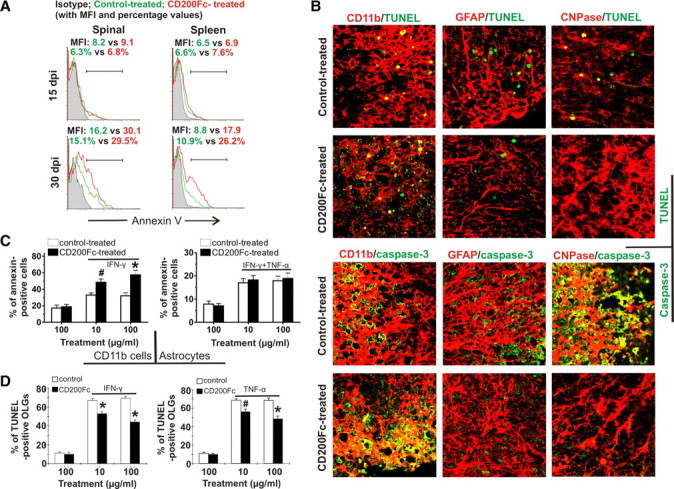
CD200Fc treatment induces apoptosis of CD11b+ cells but not astrocytes or oligodendrocytes in EAE. A, Single-cell suspension was prepared from the spinal cords and spleens of control- and CD200Fc-treated mice at days 15 and 30. Microglia/macrophage apoptosis was detected by annexin V staining and analyzed by flow cytometry with gating on all CD11b+ cells. Four to six mice per group with average clinical EAE were included, and data demonstrated are representative results. Histograms and quantifications on the same gating are shown. CD200Fc treatment induced apoptosis of CD11b+ cells in EAE mice at day 30. B, Thoracic spinal cord sections were obtained from control- and CD200Fc-treated mice with average clinical EAE in each group at day 30. TUNEL staining showed that CD200Fc enhanced the apoptosis of CD11b+ cells but not astrocytes (GFAP+) or oligodendrocytes (CNPase+) in the lesions. Immunofluorescent staining demonstrated that CD200Fc specifically increased caspase-3 activity in CD11b+ cells. Results from one representative mouse of four in each group are shown. Yellow color represents TUNEL- or caspase-3-positive cells. C, Primary microglia were cultured with or without 10 ng/ml IFN-γ stimulation for 48 h in the presence of CD200Fc or control IgG2a. Before this, cells were first cultured without any treatment for 24 h after sorting. Primary astrocytes were cultured with 10 ng/ml IFN-γ plus 5 ng/ml TNF-α stimulation for 48 h in the presence of CD200Fc or control IgG2a. Cell apoptosis and death were detected by annexin V/PI staining and analyzed by flow cytometry. CD200Fc treatment significantly increased apoptosis in the activated microglia but not astrocyte cultures. D, Primary oligodendrocytes were cultured with treatment of 50 ng/ml IFN-γ or 50 ng/ml TNF-α plus CD200Fc or control IgG2a. Seventy-two hours later, oligodendrocytes were fixed with 4% paraformaldehyde, and apoptosis was detected by double staining using CNPase antibody and TUNEL kit. CD200Fc treatment inhibited IFN-γ- or TNF-α-induced oligodendrocyte death. Data shown are representative of four independent experiments. #p < 0.05; *p < 0.01 versus controls. dpi, Days postimmunization; MFI, mean fluorescence intensity.
Because CD200R are also expressed on astrocytes and oligodendrocytes (Chitnis et al., 2007), we next determined whether CD200Fc also induced apoptosis of astrocytes and oligodendrocytes in the CNS. Flow cytometric analysis for oligodendrocytes and astrocytes in the CNS is technically difficult. Therefore, we assessed potential astrocyte and oligodendrocyte apoptosis using TUNEL staining of spinal cord sections obtained from control- and CD200Fc-treated mice. Consistent with the above results, TUNEL staining demonstrated that CD200Fc treatment significantly enhanced the apoptosis of CD11b+ cells. However, it did not induce astrocytic or oligodendroglial apoptosis (Fig. 7B). Likely related to its differential effects on microglia/macrophages, astrocytes, and oligodendrocytes, immunofluorescent staining demonstrated that CD200Fc treatment specifically increased caspase-3 activation in CD11b+ cells (Fig. 7B).
The ability of CD200Fc to induce CD11b+ apoptosis was also observed in vitro. Primary mouse microglia were cultured with or without 10 ng/ml IFN-γ stimulation in the presence of different concentrations of CD200Fc versus control IgG2a. As shown in Figure 7C, although CD200Fc treatment did not affect viability of resting microglia, it enhanced apoptosis in the activated microglia. The level of apoptotic cells in primary microglia cultures stimulated with IFN-γ in the presence of 100 μg/ml CD200Fc was increased by 79.3 ± 9.1% (p < 0.001) after 48 h treatment (Fig. 7C). However, under similar conditions, CD200Fc did not change the viability of primary astrocytes activated with 10 ng/ml IFN-γ plus 5 ng/ml TNF-α (Fig. 7C). Importantly, TUNEL staining in primary mouse oligodendrocyte culture demonstrated that, contrary to its effect on microglia, addition of CD200Fc suppressed IFN-γ or TNF-α-induced oligodendrocyte death (Fig. 7D).
Differential expression of CD200R on microglia, astrocytes, and oligodendrocytes
Our results suggest that CD200Fc treatment induces differential effects on astrocytes and oligodendrocytes compared with microglia. For example, as the data above revealed, CD200Fc treatment did not change CCL-2 production in spinal cord lesions nor enhance astrocyte or oligodendrocyte apoptosis (Figs. 3D, 7). To explore the possible mechanisms, we compared the expression of CD200R on astrocytes and oligodendrocytes with microglia under normal condition or after LPS or IFN-γ/TNF-α stimulation. Flow cytometry results indicated that, although CD200R1 was expressed on both microglia and astrocytes and the expression levels were increased in these cells during stimulation with LPS or IFN-γ/TNF-α, CD200R1 levels were much higher in microglia than in astrocytes under both normal and activation conditions (Fig. 8A).
Figure 8.

Differential expression of CD200R on microglia, astrocytes and oligodendrocytes. A, Primary mouse microglia and astrocytes were cultured and stimulated with/without LPS or IFN-γ/TNF-α. Twenty-four hours later, cells were collected, and the expression of CD200R on these cell types were examined. Flow cytometry showed that the expression levels of CD200R1 were much higher in microglia than in astrocytes under both normal and activation conditions. B, Primary mouse microglia and oligodendrocytes were cultured and stimulated with/without LPS or TNF-α. Twenty-four hours later, cells were collected, and the expression of CD200R1-R4 on these cell types were examined. RT-PCR results showed that, different from microglia, oligodendrocytes did not increase CD200R1 level during activation with LPS or TNF-α. #p < 0.05; *p < 0.01 versus control. C, Control; MFI, mean fluorescence intensity.
RT-PCR was performed to investigate the possible differential expression of CD200R on microglia and oligodendrocytes. Similar to the data above, our results demonstrated that CD200R1 expression levels were markedly enhanced in microglia after stimulation with LPS or TNF-α (Fig. 8B). In contrast, although oligodendrocytes constituently expressed CD200R1, they did not increase its expression level during activation (Fig. 8B). The difference in CD200R expression levels particularly under activation conditions could at least partly explain the differential effects of CD200Fc treatment on microglia, astrocyte, and oligodendrocyte activity. Additional studies investigating the mechanisms underlying the differential effects of CD200R1 agonists on different CNS cell types are in progress and will be the topic of a different study.
Discussion
We have demonstrated that a CD200R1 agonist attenuates disease severity in an animal model of multiple sclerosis when administered during the chronic or effector stage, through the modulation of several key disease mechanisms. CD200Fc treatment suppressed macrophage and microglial accumulation within the CNS, in part through downregulation of adhesion molecules VLA-4 and LFA-1, which are necessary for macrophage migration. Additionally, expression of activation markers MHC-II and CD80 and production of IL-6, TNF-α, and nitric oxide by CD11b+ cells were decreased in treated animals. CD200Fc treatment suppressed APC function in the spleen and CNS but had no significant effects on T cell activation or phenotype. Numbers of CD4+ and CD8+ T cells within the spinal cord were decreased in treated mice, likely secondary to suppression of myeloid function. The diminished CD8 T cell infiltration after CD200Fc treatment may also contribute to reduced CNS pathology (Medana et al., 2001; Ure and Rodriguez, 2002). Increased apoptosis of CD11b+ cells but not astrocytes was observed in vitro and in vivo. In contrast, addition of CD200Fc treatment protected oligodendrocytes from apoptosis in vitro and in vivo. Together, these results demonstrate that CD200R1 agonists modulate both myeloid- and non-myeloid-related mechanisms of chronic disease in the EAE model and may be effective in the treatment of progressive MS.
Multiple sclerosis is a chronic inflammatory, demyelinating disease with secondary neurodegeneration. To date, MS treatments have demonstrated effectiveness in reducing relapses but have had limited efficacy in slowing disease progression. This has been postulated to be in part because the effector mechanisms of disease progression differ from those mediating relapses and predominantly involve the innate immune system as opposed to adaptive immunity (Weiner, 2009). Nodules of activated microglia in nonlesioned white matter are associated with progressive disease (Kutzelnigg et al., 2005), and activated macrophages and microglia as well as CD8 T cells are associated with axonal damage (Bitsch et al., 2000). Animal models of MS have demonstrated that microglia definitively contribute to disease development and progression (Taupin et al., 1997; Heppner et al., 2005). Thus, there is considerable evidence that activated microglia and macrophages contribute to progressive disability in MS and its animal models.
CD200 expression is overall decreased in plaques from patients with progressive MS (Koning et al., 2007). In contrast, CD200R is robustly expressed on perivascular macrophages in both gray and white matter and expressed in low levels on microglia in autopsy specimens from MS patients (Koning et al., 2009). Summarily, this suggests that macrophage and microglial activation in MS may be associated with loss of tonic inhibition by CD200. However, the presence of CD200R on perivascular macrophages and microglia suggests that reintroduction of CD200R agonists may be effective in suppressing myeloid responses. Elevated expression of CD200 downregulates macrophage/microglial responses in EAE and reduces neurodegeneration in vivo and in vitro (Chitnis et al., 2007), supporting the notion that CD200R agonists may be effective in attenuating disease.
Isoforms of CD200R have been described in human and mouse, but it appears that CD200R1 is the dominant ligand in both species (Wright et al., 2003; Hatherley et al., 2005). Signaling studies have suggested that CD200R isoforms may have differential effects. Ligation of CD200R1 results in its tyrosine phosphorylation (Wright et al., 2000), and in murine mast cells results in recruitment of inhibitory adaptor proteins Dok1 and Dok2, leading to the inhibition of extracellular signal-regulated kinase, c-Jun N-terminal protein kinase, and p38 mitogen-activated protein kinase activation (Zhang et al., 2004). In contrast, CD200R2-4 contains an immunotyrosine receptor activating motif, and some isoforms signal through DAP12 (Wright et al., 2003; Kojima et al., 2007). We have demonstrated that the CD200 fusion protein (CD200Fc) used in our studies binds selectively to CD200R1.
We found that CD200Fc treatment during the effector phase of EAE resulted in a reduction of CD11b+CD45+ and CD11b+CD45− cells within the CNS, consistent with suppression of both macrophages and microglia populations. There is some debate regarding the identity of CD11b+CD45+ cells, which may actually represent activated microglia (Ponomarev et al., 2005). We found that CD200Fc treatment suppressed accumulation of CD11b+CD45+ to a greater extent than CD11b+CD45− cells, suggesting that activation of microglia is suppressed, but resting microglia may be relatively unaffected. We elucidated two additional mechanisms by which CD200Fc treatment suppressed CD11b+ cell accumulation in the CNS, the first being a reduction in expression of adhesion molecules VLA-4 and LFA-1, and the second being increased apoptosis of CD11b+ cells. Interestingly, at an early time point in the EAE course (day 15), decreased CD11b+ accumulation within the CNS was associated with increased numbers of CD11b+ cells in the spleen in CD200Fc-treated mice, suggesting that inhibition of migration was the primary operational mechanism, whereas at a later time point (day 30), there were decreased numbers of CD11b+ cells in the spleen in association with increased apoptosis.
In contrast to its effects on microglia/macrophages, CD200Fc did not increase apoptosis of astrocytes and oligodendrocytes. In fact, fewer apoptotic oligodendrocytes were demonstrated in CD200Fc-treated mice. Although suppression of microglia/macrophage activation might be protective for oligodendrocytes in vivo, our in vitro studies demonstrated that CD200Fc directly protected oligodendrocytes from TNF-α- and IFN-γ-induced apoptosis. This differential effect may be attributable to the selective effects of CD200R agonism on activated cells as opposed to resting/nonactivated cells, supported by our findings that CD200Fc administration did not increase apoptosis of nonactivated/resting microglia in vitro but enhanced apoptosis of IFN-γ-activated microglia. We additionally explored differential expression of CD200R on microglia, oligodendrocytes, and astrocytes and found that only microglia strongly upregulated CD200R1 when exposed to activating cytokines. Previous studies have demonstrated that, in the case of low cellular expression of CD200R, agonists were effective only if cross-linked (Jenmalm et al., 2006), suggesting that this may be one mechanism for the differential effects that we observed. Additional studies elucidating signaling mechanisms in relation to receptor expression may shed light on differential effects.
Antigen presentation by perivascular APCs is crucial for both EAE disease initiation and potentially propagation (Greter et al., 2005). Moreover, epitope spreading is mediated through antigen presentation by CNS APCs, subsequently leading to disease propagation (McMahon et al., 2005). We found that antigen-presenting capacity of CD11b+ and CD11c+ cells isolated from both the CNS and the spleen was suppressed in CD200Fc-treated mice. In contrast, T cell proliferation and activation was not directly affected by treatment. CD200Fc treatment decreased expression of MHC class II and CD80 on CD11b+ and CD11c+ cells both in the CNS and spleen, which may have contributed to impaired antigen-presenting capacity. Thus, CD200Fc suppresses key myeloid functions necessary for disease propagation.
CD200R agonists have been shown to suppress disease in animal models of uveitis (Copland et al., 2007), collagen-induced arthritis (Gorczynski et al., 2001; Simelyte et al., 2008), and prolong xenograft survival (Gorczynski et al., 2002). Similar to our findings, in the uveitis model administration of a CD200R agonist, monoclonal antibody suppressed macrophage/microglia accumulation and IL-6 cytokine production but had no effect on T cells (Copland et al., 2007).
Microglia-mediated neurodegeneration has been implicated in several neurodegenerative diseases, including Alzheimer's disease, Parkinson's disease, and amyotrophic lateral sclerosis (Streit et al., 2005). Interestingly, CD200 and CD200R were found to be deficient in the hippocampus and inferior temporal gyrus of Alzheimer's brains, suggesting that absence of this pathway results in increased microglial-mediated pathology (Walker et al., 2009). Thus, our findings may be relevant to other neurodegenerative diseases.
Recent work has suggested that microglia may play a protective role in MS, particularly during remyelination. Microglia may be required to phagocytose myelin and axonal debris and produce cytokines and chemokines that support remyelination (Napoli and Neumann, 2009). However, induction of protective effects may be dependent on the milieu of cytokines present at the time of microglia activation. The presence of IL-4 attenuated microglial TNF-α production and reversed blockade of IGF-1 production induced by IFN-γ, resulting in enhanced oligodendrogenesis (Butovsky et al., 2006). Interestingly, IL-4-deficient mice exhibit enhanced CNS microglial activation in response to peripheral LPS injection and have decreased neuronal expression of CD200 (Lyons et al., 2009), suggesting that IL-4 regulates microglial activation through enhancement of CD200 expression. The role of CD200R agonists in oligodendrogenesis and remyelination requires additional exploration.
We have demonstrated that administration of a CD200R1 agonist suppresses multiple mechanisms of disease during the chronic phase of EAE. CD200Fc treatment suppressed key myeloid functions, including antigen presentation in the CNS, proinflammatory cytokine production, and myeloid survival. In addition, CD200Fc treatment enhanced oligodendrocyte survival as demonstrated both in vitro and in vivo. These findings have significant implications for the treatment of progressive multiple sclerosis as well as other neurodegenerative and inflammatory diseases.
Footnotes
This work was supported by National Institutes of Health Grant KO8NS047669-TC, the National Multiple Sclerosis Society (Pilot Project-TC), the Akiyama Foundation (Y.B.), and the Uehara Memorial Foundation (Y.B.). CD200Fc reagent was provided by the Department of Immunology, Genentech Inc.
References
- Bando Y, Ito S, Nagai Y, Terayama R, Kishibe M, Jiang YP, Mitrovic B, Takahashi T, Yoshida S. Implications of protease M/neurosin in myelination during experimental demyelination and remyelination. Neurosci Lett. 2006;405:175–180. doi: 10.1016/j.neulet.2006.06.030. [DOI] [PubMed] [Google Scholar]
- Barclay AN, Brown MH. Heterogeneity of interactions mediated by membrane glycoproteins of lymphocytes. Biochem Soc Trans. 1997;25:224–228. doi: 10.1042/bst0250224. [DOI] [PubMed] [Google Scholar]
- Barclay AN, Clark MJ, McCaughan GW. Neuronal/lymphoid membrane glycoprotein MRC OX-2 is a member of the immunoglobulin superfamily with a light-chain-like structure. Biochem Soc Symp. 1986;51:149–157. [PubMed] [Google Scholar]
- Basso AS, Frenkel D, Quintana FJ, Costa-Pinto FA, Petrovic-Stojkovic S, Puckett L, Monsonego A, Bar-Shir A, Engel Y, Gozin M, Weiner HL. Reversal of axonal loss and disability in a mouse model of progressive multiple sclerosis. J Clin Invest. 2008;118:1532–1543. doi: 10.1172/JCI33464. [DOI] [PMC free article] [PubMed] [Google Scholar]
- Bettelli E, Baeten D, Jäger A, Sobel RA, Kuchroo VK. Myelin oligodendrocyte glycoprotein-specific T and B cells cooperate to induce a Devic-like disease in mice. J Clin Invest. 2006;116:2393–2402. doi: 10.1172/JCI28334. [DOI] [PMC free article] [PubMed] [Google Scholar]
- Bitsch A, Schuchardt J, Bunkowski S, Kuhlmann T, Brück W. Acute axonal injury in multiple sclerosis. Correlation with demyelination and inflammation. Brain. 2000;123:1174–1183. doi: 10.1093/brain/123.6.1174. [DOI] [PubMed] [Google Scholar]
- Boudakov I, Liu J, Fan N, Gulay P, Wong K, Gorczynski RM. Mice lacking CD200R1 show absence of suppression of lipopolysaccharide-induced tumor necrosis factor-alpha and mixed leukocyte culture responses by CD200. Transplantation. 2007;84:251–257. doi: 10.1097/01.tp.0000269795.04592.cc. [DOI] [PubMed] [Google Scholar]
- Butovsky O, Landa G, Kunis G, Ziv Y, Avidan H, Greenberg N, Schwartz A, Smirnov I, Pollack A, Jung S, Schwartz M. Induction and blockage of oligodendrogenesis by differently activated microglia in an animal model of multiple sclerosis. J Clin Invest. 2006;116:905–915. doi: 10.1172/JCI26836. [DOI] [PMC free article] [PubMed] [Google Scholar]
- Chitnis T, Imitola J, Wang Y, Elyaman W, Chawla P, Sharuk M, Raddassi K, Bronson RT, Khoury SJ. Elevated neuronal expression of CD200 protects Wlds mice from inflammation-mediated neurodegeneration. Am J Pathol. 2007;170:1695–1712. doi: 10.2353/ajpath.2007.060677. [DOI] [PMC free article] [PubMed] [Google Scholar]
- Clark MJ, Gagnon J, Williams AF, Barclay AN. MRC OX-2 antigen: a lymphoid/neuronal membrane glycoprotein with a structure like a single immunoglobulin light chain. EMBO J. 1985;4:113–118. doi: 10.1002/j.1460-2075.1985.tb02324.x. [DOI] [PMC free article] [PubMed] [Google Scholar]
- Copland DA, Calder CJ, Raveney BJ, Nicholson LB, Phillips J, Cherwinski H, Jenmalm M, Sedgwick JD, Dick AD. Monoclonal antibody-mediated CD200 receptor signaling suppresses macrophage activation and tissue damage in experimental autoimmune uveoretinitis. Am J Pathol. 2007;171:580–588. doi: 10.2353/ajpath.2007.070272. [DOI] [PMC free article] [PubMed] [Google Scholar]
- Fedoroff S, Richardson A, NetLibrary I. Protocols for neural cell culture (electronic resource) Totowa, NJ: Humana; 2001. [Google Scholar]
- Gorczynski RM, Chen Z, Yu K, Hu J. CD200 immunoadhesin suppresses collagen-induced arthritis in mice. Clin Immunol. 2001;101:328–334. doi: 10.1006/clim.2001.5117. [DOI] [PubMed] [Google Scholar]
- Gorczynski RM, Hu J, Chen Z, Kai Y, Lei J. A CD200FC immunoadhesin prolongs rat islet xenograft survival in mice. Transplantation. 2002;73:1948–1953. doi: 10.1097/00007890-200206270-00018. [DOI] [PubMed] [Google Scholar]
- Gorczynski R, Chen Z, Kai Y, Lee L, Wong S, Marsden PA. CD200 is a ligand for all members of the CD200R family of immunoregulatory molecules. J Immunol. 2004;172:7744–7749. doi: 10.4049/jimmunol.172.12.7744. [DOI] [PubMed] [Google Scholar]
- Greter M, Heppner FL, Lemos MP, Odermatt BM, Goebels N, Laufer T, Noelle RJ, Becher B. Dendritic cells permit immune invasion of the CNS in an animal model of multiple sclerosis. Nat Med. 2005;11:328–334. doi: 10.1038/nm1197. [DOI] [PubMed] [Google Scholar]
- Hatherley D, Cherwinski HM, Moshref M, Barclay AN. Recombinant CD200 protein does not bind activating proteins closely related to CD200 receptor. J Immunol. 2005;175:2469–2474. doi: 10.4049/jimmunol.175.4.2469. [DOI] [PubMed] [Google Scholar]
- Heppner FL, Greter M, Marino D, Falsig J, Raivich G, Hövelmeyer N, Waisman A, Rülicke T, Prinz M, Priller J, Becher B, Aguzzi A. Experimental autoimmune encephalomyelitis repressed by microglial paralysis. Nat Med. 2005;11:146–152. doi: 10.1038/nm1177. [DOI] [PubMed] [Google Scholar]
- Hoek RM, Ruuls SR, Murphy CA, Wright GJ, Goddard R, Zurawski SM, Blom B, Homola ME, Streit WJ, Brown MH, Barclay AN, Sedgwick JD. Down-regulation of the macrophage lineage through interaction with OX2 (CD200) Science. 2000;290:1768–1771. doi: 10.1126/science.290.5497.1768. [DOI] [PubMed] [Google Scholar]
- Jenmalm MC, Cherwinski H, Bowman EP, Phillips JH, Sedgwick JD. Regulation of myeloid cell function through the CD200 receptor. J Immunol. 2006;176:191–199. doi: 10.4049/jimmunol.176.1.191. [DOI] [PubMed] [Google Scholar]
- Kojima T, Obata K, Mukai K, Sato S, Takai T, Minegishi Y, Karasuyama H. Mast cells and basophils are selectively activated in vitro and in vivo through CD200R3 in an IgE-independent manner. J Immunol. 2007;179:7093–7100. doi: 10.4049/jimmunol.179.10.7093. [DOI] [PubMed] [Google Scholar]
- Koning N, Bö L, Hoek RM, Huitinga I. Downregulation of macrophage inhibitory molecules in multiple sclerosis lesions. Ann Neurol. 2007;62:504–514. doi: 10.1002/ana.21220. [DOI] [PubMed] [Google Scholar]
- Koning N, Swaab DF, Hoek RM, Huitinga I. Distribution of the immune inhibitory molecules CD200 and CD200R in the normal central nervous system and multiple sclerosis lesions suggests neuron-glia and glia-glia interactions. J Neuropathol Exp Neurol. 2009;68:159–167. doi: 10.1097/NEN.0b013e3181964113. [DOI] [PubMed] [Google Scholar]
- Kutzelnigg A, Lucchinetti CF, Stadelmann C, Brück W, Rauschka H, Bergmann M, Schmidbauer M, Parisi JE, Lassmann H. Cortical demyelination and diffuse white matter injury in multiple sclerosis. Brain. 2005;128:2705–2712. doi: 10.1093/brain/awh641. [DOI] [PubMed] [Google Scholar]
- Lassmann H. Multiple sclerosis: is there neurodegeneration independent from inflammation? J Neurol Sci. 2007;259:3–6. doi: 10.1016/j.jns.2006.08.016. [DOI] [PubMed] [Google Scholar]
- Lyons A, McQuillan K, Deighan BF, O'Reilly JA, Downer EJ, Murphy AC, Watson M, Piazza A, O'Connell F, Griffin R, Mills KH, Lynch MA. Decreased neuronal CD200 expression in IL-4-deficient mice results in increased neuroinflammation in response to lipopolysaccharide. Brain Behav Immun. 2009;23:1020–1027. doi: 10.1016/j.bbi.2009.05.060. [DOI] [PubMed] [Google Scholar]
- Mahad D, Callahan MK, Williams KA, Ubogu EE, Kivisäkk P, Tucky B, Kidd G, Kingsbury GA, Chang A, Fox RJ, Mack M, Sniderman MB, Ravid R, Staugaitis SM, Stins MF, Ransohoff RM. Modulating CCR2 and CCL2 at the blood-brain barrier: relevance for multiple sclerosis pathogenesis. Brain. 2006;129:212–223. doi: 10.1093/brain/awh655. [DOI] [PubMed] [Google Scholar]
- McCaughan GW, Clark MJ, Barclay AN. Characterization of the human homolog of the rat MRC OX-2 membrane glycoprotein. Immunogenetics. 1987;25:329–335. doi: 10.1007/BF00404426. [DOI] [PubMed] [Google Scholar]
- McMahon EJ, Bailey SL, Castenada CV, Waldner H, Miller SD. Epitope spreading initiates in the CNS in two mouse models of multiple sclerosis. Nat Med. 2005;11:335–339. doi: 10.1038/nm1202. [DOI] [PubMed] [Google Scholar]
- Medana I, Martinic MA, Wekerle H, Neumann H. Transection of major histocompatibility complex class I-induced neurites by cytotoxic T lymphocytes. Am J Pathol. 2001;159:809–815. doi: 10.1016/S0002-9440(10)61755-5. [DOI] [PMC free article] [PubMed] [Google Scholar]
- Napoli I, Neumann H. Protective effects of microglia in multiple sclerosis. Exp Neurol. 2009 doi: 10.1016/j.expneurol.2009.04.024. [DOI] [PubMed] [Google Scholar]
- Ponomarev ED, Shriver LP, Maresz K, Dittel BN. Microglial cell activation and proliferation precedes the onset of CNS autoimmunity. J Neurosci Res. 2005;81:374–389. doi: 10.1002/jnr.20488. [DOI] [PubMed] [Google Scholar]
- Rijkers ES, de Ruiter T, Baridi A, Veninga H, Hoek RM, Meyaard L. The inhibitory CD200R is differentially expressed on human and mouse T and B lymphocytes. Mol Immunol. 2008;45:1126–1135. doi: 10.1016/j.molimm.2007.07.013. [DOI] [PubMed] [Google Scholar]
- Rosenblum MD, Woodliff JE, Madsen NA, McOlash LJ, Keller MR, Truitt RL. Characterization of CD 200-receptor expression in the murine epidermis. J Invest Dermatol. 2005;125:1130–1138. doi: 10.1111/j.0022-202X.2005.23948.x. [DOI] [PubMed] [Google Scholar]
- Simelyte E, Criado G, Essex D, Uger RA, Feldmann M, Williams RO. CD200-FC, a novel antiarthritic biologic agent that targets proinflammatory cytokine expression in the joints of mice with collagen-induced arthritis. Arthritis Rheum. 2008;58:1038–1043. doi: 10.1002/art.23378. [DOI] [PubMed] [Google Scholar]
- Streit WJ, Conde JR, Fendrick SE, Flanary BE, Mariani CL. Role of microglia in the central nervous system's immune response. Neurol Res. 2005;27:685–691. doi: 10.1179/016164105X49463a. [DOI] [PubMed] [Google Scholar]
- Taupin V, Renno T, Bourbonnière L, Peterson AC, Rodriguez M, Owens T. Increased severity of experimental autoimmune encephalomyelitis, chronic macrophage/microglial reactivity, and demyelination in transgenic mice producing tumor necrosis factor-alpha in the central nervous system. Eur J Immunol. 1997;27:905–913. doi: 10.1002/eji.1830270416. [DOI] [PubMed] [Google Scholar]
- Ure DR, Rodriguez M. Preservation of neurologic function during inflammatory demyelination correlates with axon sparing in a mouse model of multiple sclerosis. Neuroscience. 2002;111:399–411. doi: 10.1016/s0306-4522(02)00012-x. [DOI] [PubMed] [Google Scholar]
- Walker DG, Dalsing-Hernandez JE, Campbell NA, Lue LF. Decreased expression of CD200 and CD200 receptor in Alzheimer's disease: a potential mechanism leading to chronic inflammation. Exp Neurol. 2009;215:5–19. doi: 10.1016/j.expneurol.2008.09.003. [DOI] [PMC free article] [PubMed] [Google Scholar]
- Weiner HL. The challenge of multiple sclerosis: how do we cure a chronic heterogeneous disease? Ann Neurol. 2009;65:239–248. doi: 10.1002/ana.21640. [DOI] [PubMed] [Google Scholar]
- Wright GJ, Puklavec MJ, Willis AC, Hoek RM, Sedgwick JD, Brown MH, Barclay AN. Lymphoid/neuronal cell surface OX2 glycoprotein recognizes a novel receptor on macrophages implicated in the control of their function. Immunity. 2000;13:233–242. doi: 10.1016/s1074-7613(00)00023-6. [DOI] [PubMed] [Google Scholar]
- Wright GJ, Jones M, Puklavec MJ, Brown MH, Barclay AN. The unusual distribution of the neuronal/lymphoid cell surface CD200 (OX2) glycoprotein is conserved in humans. Immunology. 2001;102:173–179. doi: 10.1046/j.1365-2567.2001.01163.x. [DOI] [PMC free article] [PubMed] [Google Scholar]
- Wright GJ, Cherwinski H, Foster-Cuevas M, Brooke G, Puklavec MJ, Bigler M, Song Y, Jenmalm M, Gorman D, McClanahan T, Liu MR, Brown MH, Sedgwick JD, Phillips JH, Barclay AN. Characterization of the CD200 receptor family in mice and humans and their interactions with CD200. J Immunol. 2003;171:3034–3046. doi: 10.4049/jimmunol.171.6.3034. [DOI] [PubMed] [Google Scholar]
- Zeinstra E, Wilczak N, Streefland C, De Keyser J. Astrocytes in chronic active multiple sclerosis plaques express MHC class II molecules. Neuroreport. 2000;11:89–91. doi: 10.1097/00001756-200001170-00018. [DOI] [PubMed] [Google Scholar]
- Zeis T, Graumann U, Reynolds R, Schaeren-Wiemers N. Normal-appearing white matter in multiple sclerosis is in a subtle balance between inflammation and neuroprotection. Brain. 2008;131:288–303. doi: 10.1093/brain/awm291. [DOI] [PubMed] [Google Scholar]
- Zhang S, Cherwinski H, Sedgwick JD, Phillips JH. Molecular mechanisms of CD200 inhibition of mast cell activation. J Immunol. 2004;173:6786–6793. doi: 10.4049/jimmunol.173.11.6786. [DOI] [PubMed] [Google Scholar]