Abstract
Dual-trap laser tweezers Raman spectroscopy (LTRS) and elastic light scattering (ELS) were used to investigate dynamic processes during high-temperature treatment of individual spores of Bacillus cereus, Bacillus megaterium, and Bacillus subtilis in water. Major conclusions from these studies included the following. (i) After spores of all three species were added to water at 80 to 90°C, the level of the 1:1 complex of Ca2+ and dipicolinic acid (CaDPA; ∼25% of the dry weight of the spore core) in individual spores remained relatively constant during a highly variable lag time (Tlag), and then CaDPA was released within 1 to 2 min. (ii) The Tlag values prior to rapid CaDPA release and thus the times for wet-heat killing of individual spores of all three species were very heterogeneous. (iii) The heterogeneity in kinetics of wet-heat killing of individual spores was not due to differences in the microscopic physical environments during heat treatment. (iv) During the wet-heat treatment of spores of all three species, spore protein denaturation largely but not completely accompanied rapid CaDPA release, as some changes in protein structure preceded rapid CaDPA release. (v) Changes in the ELS from individual spores of all three species were strongly correlated with the release of CaDPA. The ELS intensities of B. cereus and B. megaterium spores decreased gradually and reached minima at T1 when ∼80% of spore CaDPA was released, then increased rapidly until T2 when full CaDPA release was complete, and then remained nearly constant. The ELS intensity of B. subtilis spores showed similar features, although the intensity changed minimally, if at all, prior to T1. (vi) Carotenoids in B. megaterium spores' inner membranes exhibited two changes during heat treatment. First, the carotenoid's two Raman bands at 1,155 and 1,516 cm−1 decreased rapidly to a low value and to zero, respectively, well before Tlag, and then the residual 1,155-cm−1 band disappeared, in parallel with the rapid CaDPA release beginning at Tlag.
Bacterial spores of Bacillus species are formed in sporulation and are metabolically dormant and extremely resistant to a variety of harsh conditions, including heat, radiation, and many toxic chemicals (37). Since spores of these species are generally present in foodstuffs and cause food spoilage and food-borne disease (37, 38), there has long been interest in the mechanisms of both spore resistance and spore killing, especially for wet heat, the agent most commonly used to kill spores. The killing of dormant spores by wet heat generally requires temperatures about 40°C higher than those for the killing of growing cells of the same strain (37, 43). A number of factors influence spore wet-heat resistance, with a major factor being the spore core's water content, as spores with higher core water content are less wet-heat resistant than are spores with lower core water (15, 25). The high level of pyridine-2,6-dicarboxylic acid (dipicolinic acid [DPA]) and the types of its associated divalent cations, predominantly Ca2+, that comprise ∼25% of the dry weight of the core also contribute to spore wet-heat resistance, although how low core water content and CaDPA protect spores against wet heat is not known. The protection of spore DNA against depurination by its saturation with a group of α/β-type small, acid-soluble spore proteins also contributes to spore wet-heat resistance (14, 23, 33, 37).
Despite knowledge of a number of factors important in spore wet-heat resistance, the mechanism for wet-heat killing of spores is not known. Wet heat does not kill spores by DNA damage or oxidative damage (35, 37). Instead, spore killing by this agent is associated with protein denaturation and enzyme inactivation (2, 7, 44), although specific proteins for which damage causes spore death have not been identified. Wet-heat treatment also often results in the release of the spore core's large depot of CaDPA. The mechanism for this CaDPA release is not known but is presumably associated with the rupture of the spore's inner membrane (7). In addition, the relationship between protein denaturation and CaDPA release is not clear, although recent work suggests that significant protein denaturation can occur prior to CaDPA release (7). Almost all information on spore killing by moist heat has been obtained with spore populations, and essentially nothing is known about the behavior of individual spores exposed to potentially lethal temperatures in water. Given the likely heterogeneity of spores in populations, in particular in their wet-heat resistances (16, 18, 39, 40), it could be most informative to analyze the behavior of individual spores exposed to high temperatures in water.
Raman spectroscopy is widely used in biochemical studies, as this technique has high sensitivity and responds rapidly to subtle changes in molecule structure (1, 22, 31). In addition, when Raman spectroscopy is combined with confocal microscopy and optical tweezers, the resultant laser tweezers Raman spectroscopy (LTRS) allows the nondestructive, noninvasive detection of biochemical processes at the single-cell level (9, 10, 19, 46). Indeed, LTRS has been used to analyze the DPA level and the germination of individual Bacillus spores (5, 19, 30). In order to obtain information more rapidly, dual- and multitrap laser tweezers have been developed to allow multiple individual cells or particles to be analyzed simultaneously (11, 13, 24, 27), and the dual trap has been used to measure the hydrodynamic cross-correlations of two particles (24). In addition to Raman scattering, the elastic light scattering (ELS) from trapped individual cells also provides valuable information on cell shape, orientation, refractive index, and morphology (12, 45) and has been used to monitor spore germination dynamics as well (30).
In this work, we report studies of wet-heat treatment of individual spores of three different Bacillus species by dual-trap LTRS and ELS. A number of important processes related to wet-heat inactivation of spores, including CaDPA release and protein denaturation, and the correlation between these processes were investigated by monitoring changes in Raman scattering at CaDPA-, protein structure-, and phenylalanine-specific bands and changes in ELS intensity.
MATERIALS AND METHODS
Bacillus strains, spore preparation, and storage.
The Bacillus strains used in this work were B. cereus T (originally obtained from H. O. Halvorson), B. megaterium QM B1551 (originally obtained from H. S. Levinson), and two isogenic B. subtilis strains, PS832 (originally obtained from D. J. Tipper) and PS533 (34). Both are prototrophic derivatives of strain 168. B. subtilis PS533 is PS832 that carries plasmid pUB110, which encodes resistance to kanamycin (10 μg/ml). Spores of these strains were prepared as follows: B. cereus spores at 30°C in liquid-defined sporulation medium (6); B. megaterium spores at 30°C in liquid-supplemented nutrient broth medium (17); and B. subtilis spores at 37°C on 2× SG medium agar plates without antibiotics (29). After harvesting, the spores were suspended in cold water, purified by repeated centrifugation and resuspension in cold water, and stored at 4°C in water protected from light. All spore preparations were free (>98%) of growing or sporulating cells and germinated spores as determined by phase-contrast microscopy.
Dual-trap optical tweezers and Raman spectroscopy.
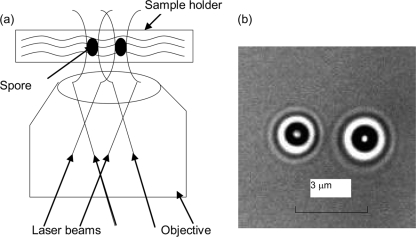
The dual-trap optical tweezers system used in this work was constructed from a previous LTRS system (47). The laser beam emitted from a laser diode at 785 nm was divided into two orthogonally polarized beams by a polarized beam splitter (PBS). The two beams were recombined by another PBS, reflected by a Raman edge long-wave pass LP01-808U-25 filter (Semrock Corporation, Rochester, NY), converted into circular polarized beams by a quarter-wave plate, and then introduced into an inverted Nikon TE2000-S microscope (Nikon Instruments, Melville, NY). The two laser beams were introduced into a Nikon 100× (numerical aperture [NA] of 1.3) objective with different angles at the rear aperture and formed two optical traps separated by ∼3 μm on the focal plane, as shown schematically in Fig. 1a. Two spores suspended in the microscope sample holder were confined in the dual traps about 10 μm above the coverslip (Fig. 1b). The backscattering Raman light excited by the trapping lasers was collected by the same objective, returned, passed through the long-wave pass filter, and then focused onto the entrance slit of a Jobin Yvon Triax 320 spectrograph (Horiba Jobin Yvon Inc., Edison, NJ) equipped with a nitrogen-cooled charge-coupled detector (CCD). Inside the spectrograph, the Raman scattering light from the two trapped spores was dispersed by a grating and imaged onto different rows of the nitrogen-cooled CCD so that the spectra could be acquired simultaneously. The Raman spectra were recorded from 600 to 1,800 cm−1, with a spectral resolution of ∼6 cm−1. A background spectrum without spores in the traps was recorded under the same conditions and subtracted from the spectra of individual spores.
FIG. 1.
Schematic diagram of dual-trap optical tweezers (a) and the bright-field images of two trapped spores separated by ∼3 μm (b).
Elastic light scattering.
The backward ELS from the two trapped spores passed though a beam splitter and a long-wave pass filter and reflected partially toward the side port of the microscope, to which a CCD camera (QSI 520; Quantum Scientific Imaging, Dana Point, CA) was mounted. This scattered light was imaged onto two different regions (50 pixels by 50 pixels) on the CCD chip that were separated by 50 pixels from center to center, and the interference between the scattering light was very small. The counts of image data then were summed over all pixels in the corresponding region giving the ELS intensity from each spore. An optical attenuator was necessary to avoid saturation of the CCD. A background image was taken under the same conditions without spores in the traps and subtracted from the images of individual spores to reduce the influence of scattering light from the interface between the water and the coverslip.
Wet-heat treatment of bacterial spores.
Spore wet-heat treatment was in distilled water at 90°C (B. subtilis) or 80°C (B. cereus and B. megaterium) for 20 to 30 min. The sample holder for the dual-trap LTRS system was filled with water (∼600 μl), preheated, and kept at 90°C or 80°C using a temperature-stabilized controller, and an aliquot of spores (∼20 μl of 4°C water; ∼2 × 10⁶ spores/ml) was injected into the sample chamber. The volume of the sample chamber was big enough (∼600 μl) such that the addition of spore samples had only a minimal influence on the temperature of the water in the sample holder.
Measurement of dynamics of individual spores during wet-heat treatment.
After the addition of spore samples to the sample holder as described above, a pair of spores was captured in the dual traps in ∼1.5 min (defined as T0), and measurements were begun at T0. The laser power of each trap used in this work was 7.5 mW, and Raman spectra of the trapped spores were recorded, with an acquisition time of 30 s. The ELS intensities were acquired simultaneously by the CCD camera, with an exposure time of 20 ms and an acquisition interval (resolution) of 1 s. The dynamics during spore wet-heat treatment were monitored by Raman spectroscopy and ELS for 20 to 30 min. After this procedure was completed, a new spore sample from the same preparation was loaded, and the measurement was repeated. For each Bacillus strain analyzed, 20 individual spores were randomly trapped and investigated.
The CaDPA level in individual spores was determined from the Raman scattering intensities at 1,017 cm−1 (averaged over 7 adjacent spectral data points), as described previously (19). The status of proteins in spores was monitored by the intensities of Raman spectral bands at 1,004 and 1,655 cm−1 (averaged over 7 adjacent data points), again as described previously (7). For B. megaterium spores that had significant carotenoid levels (26, 32), the intensities of peaks at 1,155 and 1,516 cm−1 were also calculated (averaged over 11 adjacent data points) to analyze carotenoid status during wet-heat treatment. For convenience of description, the Raman scattering intensities at all these bands were normalized to the initial values at T0. The ESL data were smoothed by five-point averaging and also normalized to the initial value for the same reason.
RESULTS
Wet-heat treatment of B. cereus spore populations.
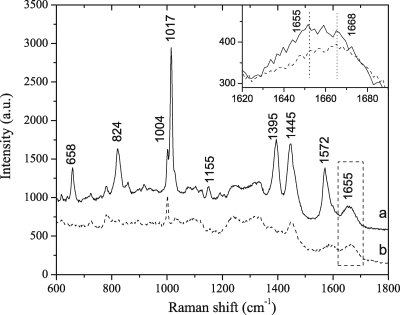
Preliminary work with our spore populations showed that incubation of B. subtilis spores in 90°C water gave 90 to 98% killing in ∼25 min; similar results were obtained when B. cereus and B. megaterium spore preparations were incubated in 80°C water (data not shown). Figure 2 shows the average Raman spectra of 20 B. cereus spores from an untreated population (Fig. 2, curve a) and a population heat treated in water at 80°C for 20 min (Fig. 2, curve b). The bands at 658, 824, 1,017, 1,395, and 1,572 cm−1 are from CaDPA (19, 21); the band at 1,004 cm−1 is due to phenylalanine in spore protein; and the bands at 1,655 and 1,668 cm−1 are associated with α-helical and irregular structures of protein amide I (peptide bond C=O stretch), respectively (20). The Raman spectra also had a weak band at 1,155 cm−1 that corresponds to the C-C stretch vibration of carotenoids that is a prominent band in B. megaterium spores (3, 26, 32). The results shown in Fig. 2 indicated that the CaDPA-specific Raman bands disappeared after the B. cereus spores were incubated for 20 min at 80°C. Although spores killed by wet heat can retain CaDPA, the release of CaDPA would almost certainly result in rapid spore inactivation via the replacement of CaDPA in the spore core by water and the resultant rapid core protein denaturation (7). The weak band at 1,155 cm−1 also disappeared, and the intensity of the band at 1,004 cm−1 was reduced, largely in parallel with CaDPA release. In addition, the intensity of the Raman band at 1,655 cm−1 was reduced, and the band at 1,668 cm−1 became more prominent after heat treatment, indicating that much of the spore proteins' structure had changed from an α-helical to an irregular and presumably denatured state. Similar results have been obtained for individual B. subtilis spores in populations (7).
FIG. 2.
Average Raman spectra of 20 individual B. cereus spores. Curve a is for untreated spores, and curve b is for spores that were incubated in 80°C water for 20 min. The baselines of the two curves were shifted for display. The inset shows the magnified spectra in the range of the protein amide I bands. Note that the positions of the bands assigned to the amide I bands of proteins in α-helical and irregular structures in the inset (and in Fig. 3 and 10) are designated 1,655 and 1,668 cm−1, respectively, in agreement with nomenclature in previous work (20), even though the precise positions of these two bands varied somewhat between experiments. a.u., arbitrary units.
Wet-heat treatment of individual B. cereus spores.
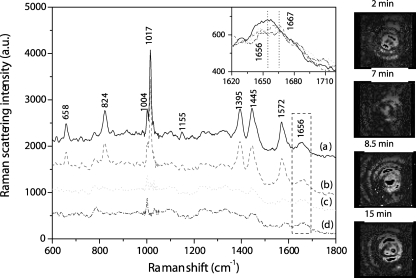
Although the average spectral data discussed above provided some information on changes taking place during spore wet-heat treatment, these results were only an average of the behaviors of many different spores whose individual behaviors during heat treatment could differ significantly. Indeed, answers to a number of important questions about wet-heat inactivation of spores, including reasons for heterogeneity in the wet-heat resistance of individual spores in populations, and the relationships between CaDPA release, protein denaturation, and spore killing, will require information on these phenomena for individual spores. Figure 3 shows the Raman spectra of a typical B. cereus spore during incubation at 80°C. The curve (Fig. 3, curve b) indicates that after 7 min of incubation the spore contained the same amount of CaDPA as that at the beginning of measurement, and the intensities of Raman bands at 1,004 and 1,155 cm−1 also remained unchanged. However, the spectral intensity at 1,655 cm−1 had decreased, and the peak at 1,668 cm−1 had become more prominent (Fig. 3, inset), suggesting that significant spore protein denaturation had taken place after 7 min at 80°C. However, by 8.5 min, all bands due to CaDPA, as well as the 1,155-cm−1 band, had disappeared; the intensity of the band at 1,004 cm−1 was reduced; and there was a further decrease in the intensity of the 1,655-cm−1 band (Fig. 3, curve c), although there were no further changes over the next 6.5 min (Fig. 3, curve d). Similar dynamic phenomena (e.g., protein denaturation prior to rapid CaDPA release) were observed with 20 other individual B. cereus spores analyzed (data not shown).
FIG. 3.
Raman spectra of a single B. cereus spore heat treated in water at 80°C and the corresponding images taken under the illumination of trapping laser. Curves a to d are for heat treatment for 2, 7, 8.5, and 15 min, respectively. The inset shows the magnified spectra in the range of the protein amide I bands. The baselines were shifted for display. The vertical dotted lines show the positions of the amide I Raman bands from protein in an α-helical (1,655-cm−1) or irregular (1,668-cm−1) structure.
The images of this same spore taken under the illumination of a trapping laser are also shown in Fig. 3. Interestingly, the bright ring in the center of the spore seen at 2 min became dim just before the CaDPA was released and became bright again following CaDPA release, and then a new bright ring appeared around the central ring. The bright rings possibly arose from interference between the backward scattering lights from the spore's front and rear interfaces. Changes in the intensities of these rings may also reflect changes in the shape, size, or refractive index of the spore or the position of the spore in the trap or changes in some or all of these parameters.
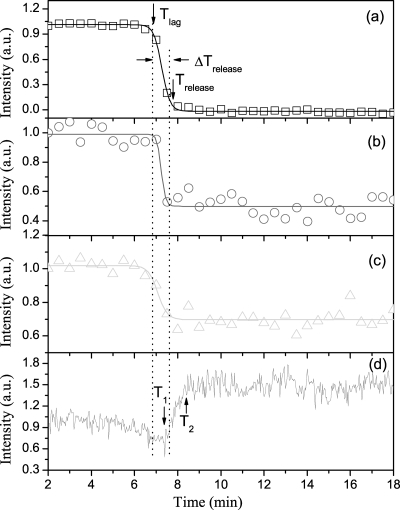
To quantitatively describe features of CaDPA release and protein denaturation during spore wet-heat treatment, the intensities of Raman spectral bands at 1,017, 1,004 and 1,655 cm−1 for the single B. cereus spore analyzed in Fig. 3 were plotted as a function of heating time (Fig. 4). The intensities of bands at 1,017 and 1,004 cm−1 remained nearly constant for 6.5 to 7 min and then rapidly decreased in ∼1 min (Fig. 4a and b). During rapid CaDPA release, the intensity of the 1,017-cm−1 band decreased to zero, suggesting that the spore released all of its CaDPA into the medium, while the intensities of the phenylalanine- and protein structure-specific bands fell only 30 to 50%, suggestive of denaturation of some spore proteins. However, the decrease in the intensity of the protein structure-specific band at 1,655 cm−1 took place a bit earlier than did changes in the other two bands, suggesting again that protein denaturation slightly preceded rapid CaDPA release. As shown in Fig. 4, the Raman spectral intensities of the three bands were fit well by Boltzmann functions, and the times at which the spore's CaDPA level fell by 8% and 92% were defined as the lag time, Tlag, and release time, Trelease, respectively. The great majority (84%) of the spore's CaDPA was released in ∼1 min, between Tlag and Trelease.
FIG. 4.
Raman scattering intensities of a typical B. cereus spore during wet-heat treatment at 80°C. The Raman scattering and ELS intensities for the spore described in the legend for Fig. 3 were determined for various times and plotted as a function of incubation time at 80°C. (a to c) Plots for bands at 1,017, 1,004, and 1,655 cm−1, respectively, are shown, and the experimental data are fit with Boltzmann functions (solid lines). (d) The ELS intensity of this same spore is shown. The two vertical dotted lines mark the positions of Tlag and Trelease.
As described above, the brightness and pattern of the B. cereus spore's image observed under the illumination of the trapping laser also changed during heat treatment. To describe this change quantitatively, the counts of the image data were summed over all pixels to give the ELS intensity of single spores. When the ELS intensity of a single B. cereus spore was plotted as a function of heating time (Fig. 4d), the intensity decreased gradually ∼30%; reached a minimum at T1 shortly after Tlag but earlier than Trelease; then began to increase rapidly ∼1.5-fold until T2, shortly after Trelease; and finally remained nearly constant. The decrease and increase in ELS intensity before, during, and after CaDPA release during spore heat treatment suggest that significant changes in the structures and/or states of spore components occur during this process.
Kinetic parameters for changes in multiple individual B. cereus spores during wet-heat treatment.
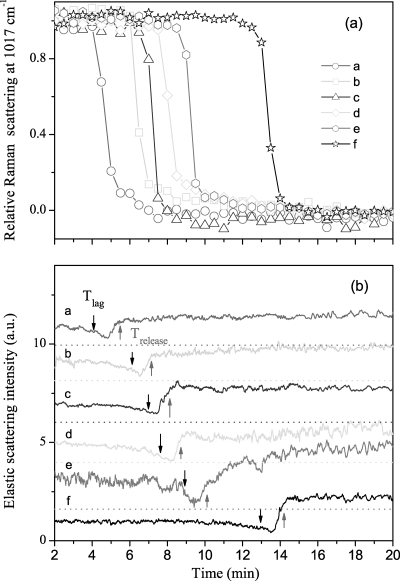
With knowledge of the kinetics of changes in an individual B. cereus spore during wet-heat treatment in hand, we then turned to analysis of the wet-heat treatment of multiple individual B. cereus spores, since the wet-heat resistance of individual spores from the same spore preparation can vary significantly, as noted above. The Raman spectral intensities of the 1,017-cm−1 CaDPA-specific band and the ELS intensities of six individual B. cereus spores as a function of incubation time at 80°C are shown in Fig. 5. The mean values and standard deviations for Tlag, Trelease, ΔTrelease, T1, and T2 and the mean CaDPA levels at T1 for 20 individual B. cereus spores incubated at 80°C are also given in Table 1. The values of Tlag and Trelease varied significantly from spore to spore, although the time required for release of the majority of spores' CaDPA (ΔTrelease = Trelease − Tlag) was nearly the same (∼1.5 min) for all individual spores. The changes in ELS intensity during incubation at 80°C were also always associated with CaDPA release, as the ELS intensities of each spore decreased gradually and reached their minima at T1, when ∼80% of the spore's CaDPA was released, and increased rapidly to constant values at T2, when spores had released all of their CaDPA. It should be noted that results from a few spores that did not show CaDPA release in ∼30 min were discarded in this experiment, as well as in experiments with B. megaterium and B. subtilis spores (data not shown).
FIG. 5.
CaDPA release and ELS intensities for six individual B. cereus spores during wet-heat treatment at 80°C. (a) Relative intensities of the CaDPA-specific Raman band at 1,017 cm−1 for six individual spores (spores a to f) were determined as described in Materials and Methods. (b) Relative ELS intensities of the six spores described in the legend for panel a were determined as described in Materials and Methods. The baselines of ELS intensity were shifted for display, and the dashed line below each ELS signal is the corresponding zero level. The downward and upward arrows mark Tlag and Trelease, respectively, for each spore.
TABLE 1.
Mean values and standard deviations of Tlag, Trelease, ΔTrelease, T1, and T2 and mean CaDPA levels at T1 of 20 individual spores incubated at high temperatures in watera
| Spore and temperature | Tlag (min) | Trelease (min) | ΔTrelease (min) | T1 (min) | CaDPA level at T1 (%) | T2 (min) |
|---|---|---|---|---|---|---|
| B. megaterium at 80°C | 6.1 ± 3.4 | 7.1 ± 3.3 | 1.0 ± 0.3 | 6.8 ± 3.4 | 24.0 | 7.5 ± 3.3 |
| B. cereus at 80°C | 7.7 ± 4.1 | 8.8 ± 4.1 | 1.1 ± 0.2 | 8.6 ± 4.1 | 20.0 | 9.7 ± 4.3 |
| PS832 at 90°C | 11.2 ± 5.6 | 12.6 ± 6.4 | 1.4 ± 1.0 | 11.6 ± 5.7 | 53.0 | 12.8 ± 6.2 |
| PS533 at 90°C | 14.4 ± 6.8 | 16.3 ± 7.9 | 2.0 ± 1.4 | 14.9 ± 7.0 | 41.0 | 16.5 ± 8.1 |
Spores of various Bacillus species or strains were incubated in water at various temperatures, and Raman spectra and ELS intensities for 20 individual spores in a dual trap as well as various parameters were determined as described in Materials and Methods and other portions of the text.
Kinetic parameters for changes in multiple individual B. megaterium and B. subtilis spores during wet-heat treatment.
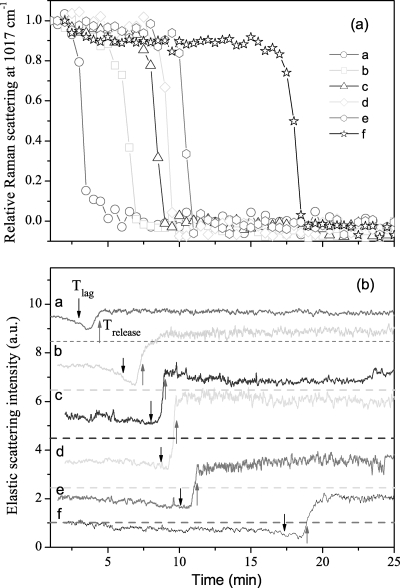
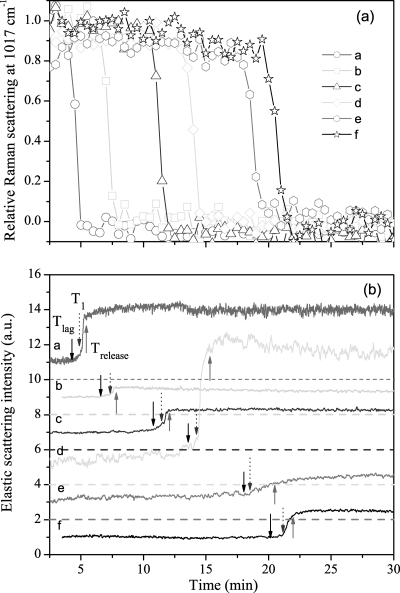
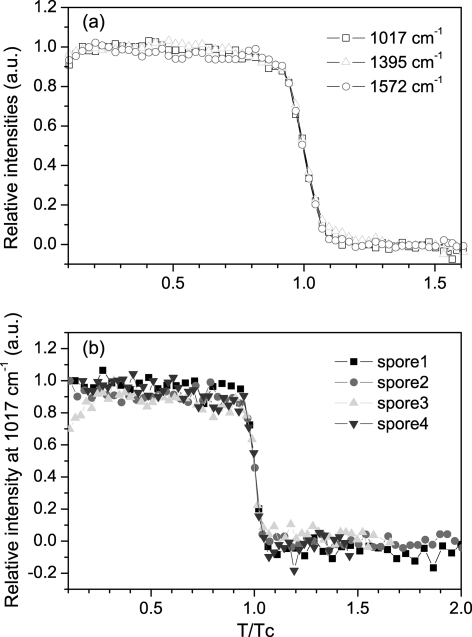
To compare the kinetics of changes during wet-heat treatment in individual B. cereus spores with those of spores of other Bacillus species, we also examined 20 individual B. megaterium and B. subtilis spores incubated at 80°C and 90°C, respectively. The Raman spectral intensities of the main CaDPA band at 1,017 cm−1 as well as the ELS intensities of six individual B. megaterium and B. subtilis PS533 spores during high-temperature incubation are shown in Fig. 6 and 7, and kinetic parameters for 20 individual spores of both species are summarized in Table 1. As was seen with B. cereus spores, the Tlag values prior to initiation of rapid CaDPA release varied significantly between individual spores, although the ΔTrelease values were relatively constant. Also as seen with B. cereus spores, there was little if any decrease in CaDPA content during heat treatment prior to Tlag. This was seen most dramatically when the averaged intensities of CaDPA-specific Raman bands at 1,017, 1,395, and 1,570 cm−1 for 10 B. subtilis PS533 spores were plotted as a function of incubation time in 90°C water and the relative times for individual spores were normalized to the time, Tc, at which 50% of the spore's CaDPA was retained (Fig. 8a). Strikingly, all CaDPA-specific bands exhibited nearly identical behaviors, and the spore's CaDPA level remained constant prior to rapid CaDPA release beginning at Tlag. In addition, when CaDPA release as measured from the intensities of the 1,017-cm−1 bands in four individual spores was plotted in the same way (Fig. 8b), the rapid CaDPA release for individual spores took place almost in parallel, even though individual spores had values for Tlag that varied ≥2-fold (Fig. 7 and data not shown). Essentially identical results were obtained when similar analyses were carried out for multiple individual B. cereus or B. megaterium spores incubated at 80°C (data not shown). In contrast to the lack of change in the intensities of spores' CaDPA-specific Raman bands prior to Tlag noted above, there are significant changes in the ratios of intensities of CaDPA-specific Raman bands upon wet-heat activation of individual B. cereus and B. subtilis spores (47). The reason the latter differences were not seen in the current work is likely because wet-heat inactivation was carried out at temperatures 15 to 20°C higher than those for heat activation, and thus heat activation-related changes in the spores' Raman spectra would have taken place in ≤1.5 min, before acquisition of Raman spectra (4, 47). Indeed, by the time the B. cereus and B. subtilis spores were trapped, the ratios of intensities of CaDPA-specific Raman bands had changed to close to the corresponding values for heat-activated spores (Table 2). Perhaps not surprisingly, this suggests that during incubation at wet-heat killing temperatures, the individual spores had undergone heat activation changes in the state of CaDPA long before the spores were killed.
FIG. 6.
CaDPA release and ELS intensities for six individual B. megaterium spores during wet-heat treatment at 80°C. (a) Relative intensities of the Raman spectral band at 1,017 cm−1 for six individual spores (spores a to f) were determined as described in Materials and Methods. (b) Relative ELS intensities of the six spores described in the legend for panel a were determined as described in Materials and Methods. The baselines of ELS intensity were shifted for display, and the dashed line below each ELS signal is the corresponding zero level. The downward and upward arrows mark Tlag and Trelease, respectively, for each spore.
FIG. 7.
CaDPA release and ELS intensities for six individual B. subtilis PS533 spores during wet-heat treatment at 90°C. (a) Relative intensities of the Raman spectral band at 1,017 cm−1 for six individual spores (spores a to f) were determined as described in Materials and Methods. (b) Relative ELS intensities of the six spores described in the legend for panel a were determined as described in Materials and Methods. The baselines of ELS intensity were shifted for display, and the dashed line below each ELS signal is the corresponding zero level. The solid downward, solid upward, and dotted downward arrows mark Tlag, Trelease, and T1, respectively, for each spore.
FIG. 8.
Intensities of CaDPA-specific bands from spores of B. subtilis PS533 as a function of time at 90°C. (a) Averaged intensities of CaDPA-specific Raman bands from 10 individual spores were normalized to the Tc at which the spore retains half of its initial CaDPA level after the spores were added to 90°C water. (b) Intensities of the 1,017-cm−1 Raman band of four individual spores as a function of time at 90°C, with time values for individual spores normalized to Tc as described above.
TABLE 2.
Ratios of the intensities of characteristic Raman bands of B. cereus and B. subtilis sporesa
| Spores and conditions used | I1,017/I824 | I1,395/I824 | I1,570/I824 |
|---|---|---|---|
| B. cereus at 25°Cb | 3.03 ± 0.09 | 1.79 ± 0.06 | 1.24 ± 0.05 |
| B. cereus at 65°C for 30 minb | 2.61 ± 0.08 | 1.33 ± 0.06 | 1.01 ± 0.04 |
| B. cereus at 80°Cc | 2.62 ± 0.09 | 1.25 ± 0.08 | 1.11 ± 0.04 |
| B. subtilis at 25°Cb | 2.19 ± 0.08 | 0.97 ± 0.05 | 0.87 ± 0.05 |
| B. subtilis at 70°C for 30 minb | 1.92 ± 0.08 | 0.85 ± 0.04 | 0.81 ± 0.03 |
| B. subtilis at 90°Cc | 1.86 ± 0.19 | 0.79 ± 0.04 | 0.76 ± 0.12 |
B. subtilis strain PS832 was used. I, intensity of Raman band at the indicated wavelength (cm−1).
Data for untreated spores at 25°C and heat-activated spores held at heat activation temperatures (65 or 70°C) in water are from reference 47.
B. cereus and B. subtilis (strain PS832) spores were injected into water at heat-killing temperatures, and intensities of CaDPA-specific Raman bands were determined as described in Materials and Methods and other portions of the text. The intensity ratios were determined just after the spores were trapped and averaged over 10 individual spores.
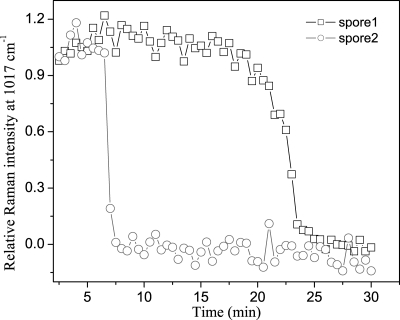
Correlations between changes in DPA and ELS intensity during wet-heat treatment of the B. megaterium and B. subtilis spores were also largely similar to those seen with B. cereus spores, including the decrease in ELS intensity prior to Tlag with B. megaterium spores (Fig. 6b). However, the ELS intensity from individual B. subtilis spores, either strain PS533 (Fig. 7b) or PS832 (data not shown), did not decrease during Tlag but remained nearly constant and then increased toward the end of rapid CaDPA release, the latter as was the case with B. cereus and B. megaterium spores. Consequently, for B. subtilis spores, T1 was defined as the time at which the ELS intensities began to rise rapidly (Fig. 7b).
Comparison of kinetic parameters of the two spores in the dual trap during wet-heat treatment.
The results noted above indicated that individual spores from the same spore preparation have marked differences in their dynamic responses to incubation at high temperatures in water, and it will be important to identify the reasons for these differences. It is not clear if differences in the microscopic physical environment during wet-heat treatment itself, such as the temperature, pressure, and medium's thermal convection, might be responsible for heterogeneity in the wet-heat resistance of individual spores in populations. This concern could, however, be addressed through the use of the dual-trap optical tweezers, since the minimal separation (∼3 μm) of the spores in the two traps makes it highly likely that the two trapped spores are exposed to essentially the same microenvironment. Figure 9 shows the relative Raman spectral intensities of the CaDPA-specific 1,017-cm−1 band for a typical pair of B. subtilis PS533 spores confined in the dual trap. It is obvious that this pair of spores exhibited totally different wet-heat resistances, although their CaDPA contents as determined by the absolute Raman spectral intensities of the band at 1,017 cm−1 were almost the same (data not shown). Twenty pairs of PS533 spores were compared in this fashion, and the correlation coefficient between Tlag1 and Tlag2 was calculated to be a ρ12 (Pearson's correlation coefficient) of 2.4%, where subscripts 1 and 2 represent the spores in the two traps. This value for ρ12 indicates that the difference in wet-heat resistances between the two spores in the dual trap is not due to different microenvironments during wet-heat treatment but rather stems from heterogeneity between different individual spores.
FIG. 9.
CaDPA release from a typical pair of B. subtilis PS533 spores during wet-heat treatment at 90°C. This pair of spores was confined in dual traps separated by ∼3 μm.
Status of carotenoids during wet-heat treatment of B. megaterium spores.
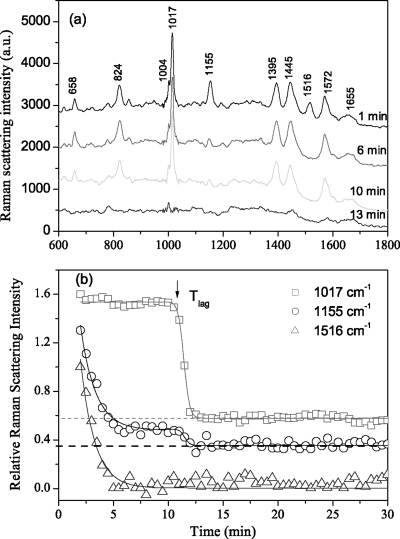
In addition to the prominent Raman bands seen with B. cereus and B. subtilis spores, B. megaterium spores also exhibit two additional major Raman bands at 1,155 and 1,516 cm−1 due to the C-C and C=C stretch vibrations of carotenoids (3), as shown in Fig. 10a. This B. megaterium carotenoid is thought to be located in the spore's inner membrane (26, 32) but is largely if not completely absent from B. cereus and B. subtilis spores (Fig. 2; data not shown), although B. cereus and B. subtilis spores do exhibit a small Raman band at 1,155 cm−1 (Fig. 2 and 3; data not shown). Figure 10a and b show the Raman spectra and the calculated intensities of bands at 1,017, 1,155, and 1,516 cm−1 of a typical B. megaterium spore during incubation at 80°C. The intensities of the carotenoid-specific bands dropped rapidly during incubation at 80°C, and the band at 1,516 cm−1 had disappeared by 6 min. The intensity of the 1,155-cm−1 band exhibited two periods of change. Initially, a fast change paralleled the change in the 1,516-cm−1 band and decreased the band's intensity to ≤10% of its initial value, although this decreased amplitude may be underestimated due to the delay in spectrum acquisition because of the time needed to fix two spores in the dual trap; indeed, some B. megaterium spores had largely lost these two bands by the time they were trapped (data not shown). Interestingly, the reduced height of the 1,155-cm−1 band in B. megaterium spores prior to Trelease was comparable to the height of this band in B. cereus and B. subtilis spores at either T0 or Tlag (Fig. 2, 3, and 10; data not shown). However, after Tlag, the residual intensity of the 1,155-cm−1 band in B. megaterium spores decreased rapidly to zero (Fig. 10), as was also the case during wet-heat treatment of B. cereus and B. subtilis spores (Fig. 3; data not shown).
FIG. 10.
Effect of wet-heat treatment at 80°C on carotenoids in B. megaterium spores. Raman spectra of a typical B. megaterium spore incubated in water at 80°C for different times at the 1st, 6th, 10th, and 13th min after the addition to heated water (a) and the spectral intensities of bands at 1,017, 1,155, and 1,516 cm−1 as a function of time at 80°C (b) were determined as described in Materials and Methods. The zero levels of bands at 1,017 and 1,155 cm−1 were shifted upward for display and are marked by the dashed lines that cross throughout the relevant spectra.
DISCUSSION
The results reported in this communication allow a number of new, significant conclusions about wet-heat inactivation of individual spores of Bacillus species, conclusions that could not be drawn from studies of the wet-heat treatment of spore populations. Most of these conclusions are the same for spores of three different Bacillus species, suggesting that these conclusions are general ones for spores of all Bacillus species.
The first conclusion is that during incubation in water at heat-killing temperatures, Bacillus spores exhibit no significant change in their CaDPA content until Tlag and then release the majority of their CaDPA in 1 to 2 min in ΔTrelease. The mechanism that determines CaDPA release during ΔTrelease is not clear. However, it seems likely that this rapid CaDPA release is due to a breakdown of the spore's major permeability barrier to small molecules, and this permeability barrier is most likely the spore's inner membrane (37, 38). In addition, it is not exactly clear how CaDPA leaves the spore core during heat treatment. During spore germination, CaDPA is also almost completely released in 1 to 2 min (5, 30), and while it is not known how this release is triggered, CaDPA is suggested to be released via inner membrane channels composed at least in part of SpoVA proteins (41, 42). Perhaps high-temperature treatment somehow triggers the rapid synchronous opening of these normal CaDPA channels, either by action on the channels themselves or indirectly by effects on the spore's inner membrane. Alternatively, there may be such a drastic change in inner membrane structure that all core small molecules, not just CaDPA, are rapidly released in parallel during wet-heat treatment. Indeed, all core small molecules are released during spore wet-heat treatment (21, 37, 38), although the rates of rapid release of different core small molecules are not known for individual spores. In addition, not all core small molecules are released during spore germination (36), so it may be possible to determine if small-molecule release during wet-heat treatment is similar in its selectivity to that seen with spore germination.
The second conclusion is that while values of ΔTrelease during spore heat inactivation are relatively constant for different individual spores, either in one species or across species, the variation in Tlag is extremely large, most notably between individual spores in the same spore preparation. The reason for these differences between individual spores in populations is not some heterogeneity in the physical microenvironment during wet-heat treatment, but a likely cause is spore heterogeneity due to differences in the microenvironments of different cells in the same sporulating culture, perhaps because different cells in a culture sporulate at different times. While the overall physical and chemical environments during sporulation are the same for all sporulating cells in a population, the microenvironments may vary significantly, in particular because of differences in the kinetics of sporulation of different cells in the population (18, 39, 40). Such differences in spore formation may in turn result in slight differences in the levels of various components important in spore moist-heat resistance such as core water, divalent cations, and CaDPA, as well as slight differences in structures of important spore layers, such as the peptidoglycan cortex. A number of these slight differences might act synergistically to cause significant differences in the heat resistance of individual spores in populations, and a challenge for the future will be to identify those parameters responsible for the heterogeneity in spore wet-heat resistance and how this heterogeneity arises during sporulation.
The third conclusion is that during wet-heat treatment, some spore proteins are denatured or damaged in parallel with and even slightly prior to rapid CaDPA release during wet heat treatment, as some spore protein changes from an α-helical structure to one that is irregular and likely denatured. The state of phenylalanine in spore proteins also changes in parallel with and to some degree even before rapid CaDPA release, and this change may also be related to protein damage or denaturation. Given that protein damage can inactivate protein function, this suggests that protein damage is a major reason that wet heat kills spores of Bacillus species, as was suggested recently (7), although specific proteins to which damage causes spore death during wet-heat treatment have not been identified.
It was also notable with individual spores exposed to wet heat that there was significant change in overall spore protein structure prior to rapid CaDPA release. This suggests that during wet-heat treatment some spores should retain CaDPA for a short period, even if they are already dead from protein damage, and some B. subtilis spores in populations treated with wet heat have been shown to do just that (7). Presumably wet heat causes damage to some crucial protein or proteins such that while CaDPA is retained, the spores are not viable, and even if they can germinate, they cannot progress into outgrowth (7, 8). However, with further wet-heat treatment, more protein damage accumulates, including damage to proteins in the spore's inner membrane, and ultimately, this damaged membrane ruptures, leading to rapid CaDPA release. Unfortunately, we have no way at present to know exactly when individual spores being observed during wet-heat treatment actually die, although available evidence indicates that B. subtilis spores that have lost all CaDPA during wet-heat treatment are definitely dead (7). However, spores that retain CaDPA during wet-heat treatment may be dead, still alive, or only conditionally alive, depending on the conditions used for recovering viable spores (7, 8).
The fourth conclusion concerns correlations between the times for changes in spores' ELS intensities and CaDPA release during wet-heat treatment. For B. cereus and B. megaterium spores, ELS intensities decreased gradually during wet-heat treatment, reaching minimum values at T1, when about 80% of the spores' CaDPA had been released, and then rose rapidly until T2, when CaDPA release was complete. The ELS intensities of B. subtilis spores during wet-heat treatment exhibited similar features, except that ELS intensities remained constant prior to T1. Increases in ELS intensity are possibly related to abrupt and/or significant changes in the spore core refractive index due to CaDPA release and its replacement by water. Inhomogeneity of the refractive index inside the spore may also generate more scattering centers that scatter more incident photons (30). Changes in the refractive index of spore core components also may result in minute transitions in spores' axial position in the optical trap, since changes in the ratio of the particle's refractive index to the refractive index of the medium leads to a reequilibration of scattering force and gradient force in the axial direction (28). When the scattering force decreases or the gradient force increases, the spore will be trapped more closely to the focus of the laser. However, the reasons that the ELS intensities of B. cereus and B. megaterium spores decrease gradually prior to T1 and why this is not seen with B. subtilis spores are not clear.
The last novel conclusion concerns the carotenoid or carotenoids present in high levels in B. megaterium spores, supposedly in the spore inner membrane (26, 32). Carotenoid-specific Raman bands at 1,155 and 1,516 cm−1 decreased rapidly beginning as soon as these spores were exposed to elevated temperatures, with the 1,516-cm−1 peak disappearing completely and well before rapid CaDPA release. However, the intensity of the band at 1,155 cm−1 changed in two stages, an initially large decrease well before Tlag and then a rapid decrease to zero accompanying rapid CaDPA release. The mechanism for the changes in the intensity of carotenoid-specific Raman bands is not clear but is possibly related to photo-oxidation of carotenoids induced by the trapping laser at elevated temperatures, although experiments carried out at room temperature indicated that this effect was not pronounced (data not shown). In addition, the residual intensity of the 1,155-cm−1 band prior to Tlag may not be due to a carotenoid but to CaDPA (19). However, if the carotenoid is indeed in the spore's inner membrane (26, 32), then changes in spores' carotenoid Raman spectra during wet-heat treatment may be a reflection of striking changes in the environment and structure of the spore inner membrane during this treatment.
Acknowledgments
This work was supported by a grant from the Army Research Office (Y.-Q.L./P.S.) and by a Multi University Research Initiative award from the Department of Defense (P.S./Y.-Q.L.).
Footnotes
Published ahead of print on 22 January 2010.
REFERENCES
- 1.Bakker Schut, T. C., G. J. Puppels, Y. M. Kraan, J. Greve, L. L. van der Maas, and C. G. Figdor. 1997. Intracellular carotenoid levels measured by Raman microspectrocopy: comparison of lymphocytes from lung cancer patients and healthy individuals. Int. J. Cancer 74:20-25. [DOI] [PubMed] [Google Scholar]
- 2.Belliveau, B. H., T. C. Beaman, S. Pankratz, and P. Gerhardt. 1992. Heat killing of bacterial spores analyzed by differential scanning calorimetry. J. Bacteriol. 174:4463-4474. [DOI] [PMC free article] [PubMed] [Google Scholar]
- 3.Bernstein, P. S., D.-Y. Zhao, M. Sharifzadeh, I. V. Ermakov, and W. Gellermann. 2004. Resonance Raman measurement of macular carotenoids in the living human eye. Arch. Biochem. Biophys. 430:163-169. [DOI] [PubMed] [Google Scholar]
- 4.Busta, F. F., and Z. J. Ordal. 1964. Heat-activation kinetics of endospores of Bacillus subtilis. J. Food Sci. 29:345-353. [Google Scholar]
- 5.Chen, D., S. S. Huang, and Y. Q. Li. 2006. Real-time detection of kinetic germination and heterogeneity of single Bacillus spores by laser tweezers Raman spectroscopy. Anal. Chem. 78:6936-6941. [DOI] [PubMed] [Google Scholar]
- 6.Clements, M. O., and A. Moir. 1998. Role of the gerI operon of Bacillus cereus 569 in the response of spores to germinants. J. Bacteriol. 180:1787-1797. [DOI] [PMC free article] [PubMed] [Google Scholar]
- 7.Coleman, W. H., D. Chen, Y.-Q. Li, A. E. Cowan, and P. Setlow. 2007. How moist heat kills spores of Bacillus subtilis. J. Bacteriol. 189:8458-8466. [DOI] [PMC free article] [PubMed] [Google Scholar]
- 8.Coleman, W. H., and P. Setlow. 2009. Analysis of damage due to moist heat treatment of spores of Bacillus subtilis. J. Appl. Microbiol. 106:1600-1607. [DOI] [PubMed] [Google Scholar]
- 9.Creely, C. M., G. P. Singh, and D. Petrovet. 2005. Dual wavelength optical tweezers for confocal Raman spectroscopy. Opt. Commun. 245:465-470. [Google Scholar]
- 10.De Luca, A. C., G. Rusciano, R. Ciancia, V. Martinelli, G. Pesce, B. Rotoli, L. Selvaggi, and A. Sasso. 2008. Spectroscopical and mechanical characterization of normal and thalassemic red blood cells by Raman tweezers. Opt. Express 16:7943-7958. [DOI] [PubMed] [Google Scholar]
- 11.Dharmadhikari, J. A., A. K. Dharmadhikari, V. S. Makhija, and D. Mathur. 2007. Multiple optical traps with a single laser beam using a simple and inexpensive mechanical element. Curr. Sci. 93:1265-1270. [Google Scholar]
- 12.Doornbos, R. M. P., M. Schaeffer, A. G. Hoekstra, P. M. A. Sloot, B. G. de Grooth, and J. Greve. 1996. Elastic light-scattering measurements of single biological cells in an optical trap. Appl. Opt. 35:729-734. [DOI] [PubMed] [Google Scholar]
- 13.Dufresne, E. R., and D. G. Grier. 1998. Optical tweezer arrays and optical substrates created with diffractive optics. Rev. Sci. Instr. 69:1974-1977. [Google Scholar]
- 14.Fairhead, H., B. Setlow, and P. Setlow. 1993. Prevention of DNA damage in spores and in vitro by small, acid-soluble proteins from Bacillus species. J. Bacteriol. 175:1367-1374. [DOI] [PMC free article] [PubMed] [Google Scholar]
- 15.Gerhardt, P., and R. E. Marquis. 1989. Spore thermoresistance mechanisms, p. 43-64. In I. Smith, R. A. Slepecky, and P. Setlow (ed.), Regulation of procaryotic development: structural and functional analysis of bacterial sporulation and germination. American Society for Microbiology, Washington, DC.
- 16.Ghosh, S., P. Zhang, Y.-Q. Li, and P. Setlow. 2009. Superdormant spores of Bacillus species have elevated wet-heat resistance and temperature requirements for heat activation. J. Bacteriol. 191:5584-5591. [DOI] [PMC free article] [PubMed] [Google Scholar]
- 17.Goldrick, S., and P. Setlow. 1983. Expression of a Bacillus megaterium sporulation-specific gene in Bacillus subtilis. J. Bacteriol. 155:1459-1462. [DOI] [PMC free article] [PubMed] [Google Scholar]
- 18.Hornstra, L. M., A. T. Beek, J. P. Smelt, W. W. Kallemeijn, and S. Brul. 2009. On the origin of heterogeneity in (preservation) resistance of Bacillus spores: input for a ‘systems’ analysis approach of bacterial spore outgrowth. Int. J. Food Microbiol. 134:9-15. [DOI] [PubMed] [Google Scholar]
- 19.Huang, S. S., D. Chen, P. L. Pelczar, V. R. Vepachedu, P. Setlow, and Y.-Q. Li. 2007. Levels of Ca2+-dipicolinic acid in individual Bacillus spores determined using microfluidic Raman tweezers. J. Bacteriol. 189:4681-4687. [DOI] [PMC free article] [PubMed] [Google Scholar]
- 20.Kitagawa, T., and S. Hirota. 2002. Raman spectroscopy of proteins, p. 3426-3446. In J. M. Chalmers and P. R. Griffiths (ed.), Handbook of vibrational spectroscopy, vol. 5. John Wiley, Hoboken, NJ. [Google Scholar]
- 21.Magge, A., A. C. Granger, P. G. Wahome, B. Setlow, V. R. Vepachedu, C. A. Loshon, L. Peng, D. Chen, Y.-Q. Li, and P. Setlow. 2008. Role of dipicolinic acid in the germination, stability, and viability of spores of Bacillus subtilis. J. Bacteriol. 190:4798-4807. [DOI] [PMC free article] [PubMed] [Google Scholar]
- 22.Mahadevan-Jansen, A. R., and R. Richards-Kortum. 1996. Raman spectroscopy for the detection of cancers and precancers. J. Biomed. Opt. 1:31-70. [DOI] [PubMed] [Google Scholar]
- 23.Marquis, R. E., J. Sim, and S. Y. Shin. 1994. Molecular mechanisms of resistance to heat and oxidative damage. J. Appl. Bacteriol. 76:40S-48S. [DOI] [PubMed] [Google Scholar]
- 24.Meiners, J.-C., and S. R. Quake. 1999. Direct measurement of hydrodynamic cross correlations between two particles in an external potential. Phys. Rev. Lett. 82:2211-2214. [Google Scholar]
- 25.Melly, E., P. C. Genest, M. E. Gilmore, S. Little, D. L. Popham, A. Driks, and P. Setlow. 2002. Analysis of the properties of spores of Bacillus subtilis prepared at different temperatures. J. Appl. Microbiol. 92:1105-1115. [DOI] [PubMed] [Google Scholar]
- 26.Mitchell, C., S. Iyer, J. F. Skomurski, and J. C. Vary. 1986. Red pigment in Bacillus megaterium spores. Appl. Environ. Microbiol. 52:64-67. [DOI] [PMC free article] [PubMed] [Google Scholar]
- 27.Moffitt, J. R., Y. R. Chemla, D. Izhaky, and C. Bustamante. 2006. Differential detection of dual traps improves the spatial resolution of optical tweezers. Proc. Natl. Acad. Sci. U. S. A. 103:9006-9011. [DOI] [PMC free article] [PubMed] [Google Scholar]
- 28.Neuman, K. C., and S. M. Block. 2004. Optical trapping. Rev. Sci. Instrum. 75:2787-2809. [DOI] [PMC free article] [PubMed] [Google Scholar]
- 29.Paidhungat, M., B. Setlow, A. Driks, and P. Setlow. 2000. Characterization of spores of Bacillus subtilis which lack dipicolinic acid. J. Bacteriol. 182:5505-5512. [DOI] [PMC free article] [PubMed] [Google Scholar]
- 30.Peng, L., D. Chen, P. Setlow, and Y. Q. Li. 2009. Elastic and inelastic light scattering from single bacterial spores in an optical trap allows the monitoring of spore germination dynamics. Anal. Chem. 81:4035-4042. [DOI] [PMC free article] [PubMed] [Google Scholar]
- 31.Puppels, G. J., H. S. P. Garritsen, G. M. J. Segersnolten, F. F. M. Demul, and J. Greve. 1991. Raman microspectroscopic approach to the study of human granulocytes. Biophys. J. 60:1046-1056. [DOI] [PMC free article] [PubMed] [Google Scholar]
- 32.Racine, F. M., and J. C. Vary. 1980. Isolation and properties of membranes from Bacillus megaterium spores. J. Bacteriol. 143:1208-1214. [DOI] [PMC free article] [PubMed] [Google Scholar]
- 33.Setlow, B., and P. Setlow. 1994. Heat inactivation of Bacillus subtilis spores lacking small, acid-soluble spore proteins is accompanied by generation of abasic sites in spore DNA. J. Bacteriol. 176:2111-2113. [DOI] [PMC free article] [PubMed] [Google Scholar]
- 34.Setlow, B., and P. Setlow. 1996. Role of DNA repair in Bacillus subtilis spore resistance. J. Bacteriol. 178:3486-3495. [DOI] [PMC free article] [PubMed] [Google Scholar]
- 35.Setlow, B., and P. Setlow. 1998. Heat killing of Bacillus subtilis spores in water is not due to oxidative damage. Appl. Environ. Microbiol. 64:4109-4112. [DOI] [PMC free article] [PubMed] [Google Scholar]
- 36.Setlow, B., P. G. Wahome, and P. Setlow. 2008. Release of small molecules during germination of spores of Bacillus species. J. Bacteriol. 190:4759-4763. [DOI] [PMC free article] [PubMed] [Google Scholar]
- 37.Setlow, P. 2006. Spores of Bacillus subtilis: their resistance to and killing by radiation, heat and chemicals. J. Appl. Microbiol. 101:514-525. [DOI] [PubMed] [Google Scholar]
- 38.Setlow, P., and E. A. Johnson. 2007. Spores and their significance, p. 35-67. In M. P. Doyle, L. R. Beuchat, and T. J. Montville (ed.), Food microbiology: fundamentals, and frontiers, 3rd ed. ASM Press, Washington, DC.
- 39.Smits, W. K., O. P. Kuipers, and J. W. Veening. 2006. Phenotypic variation in bacteria: the role of feedback regulation. Nat. Rev. Microbiol. 4:259-271. [DOI] [PubMed] [Google Scholar]
- 40.Veening, J. W., E. J. Stewart, T. W. Berngruber, F. Taddei, O. P. Kuipers, and L. W. Hamoen. 2008. Bet-hedging and epigenetic inheritance in bacterial cell development. Proc. Natl. Acad. Sci. U. S. A. 105:4393-4398. [DOI] [PMC free article] [PubMed] [Google Scholar]
- 41.Vepachedu, V. R., and P. Setlow. 2004. Analysis of the germination of spores of Bacillus subtilis with temperature sensitive spo mutations in the spoVA operon. FEMS Microbiol. Lett. 239:71-77. [DOI] [PubMed] [Google Scholar]
- 42.Vepachedu, V. R., and P. Setlow. 2007. Role of SpoVA proteins in the release of dipicolinic acid during germination of Bacillus subtilis spores triggered by dodecylamine or lysozyme. J. Bacteriol. 189:1565-1572. [DOI] [PMC free article] [PubMed] [Google Scholar]
- 43.Warth, A. D. 1978. Relationship between the heat resistance of spores and the optimum temperature and maximum growth temperatures of Bacillus species. J. Bacteriol. 134:699-705. [DOI] [PMC free article] [PubMed] [Google Scholar]
- 44.Warth, A. D. 1980. Heat stability of Bacillus enzymes within spores and in extracts. J. Bacteriol. 143:27-34. [DOI] [PMC free article] [PubMed] [Google Scholar]
- 45.Watson, D., N. Hagen, J. Diver, P. Marchand, and M. Chachisvillis. 2004. Elastic light scattering from single cells: orientational dynamics in optical trap. Biophys. J. 87:1298-1306. [DOI] [PMC free article] [PubMed] [Google Scholar]
- 46.Xie, C. G., M. A. Dinno, and Y. Q. Li. 2002. Near-infrared Raman spectroscopy of single optically trapped biological cells. Opt. Lett. 27:249-251. [DOI] [PubMed] [Google Scholar]
- 47.Zhang, P. F., P. Setlow, and Y.-Q. Li. 2009. Characterization of single heat-activated Bacillus spores using laser tweezers Raman spectroscopy. Opt. Express 17:16480-16491. [DOI] [PubMed] [Google Scholar]


