

Abstract
The mammalian CNS contains an abundant, widely distributed population of glial cells that serve as oligodendrocyte progenitors. It has been reported that these NG2-immunoreactive cells (NG2+ cells) form synapses and generate action potentials, suggesting that neural-evoked excitation of these progenitors may regulate oligodendrogenesis. However, recent studies also suggest that NG2+ cells are comprised of functionally distinct groups that differ in their ability to respond to neuronal activity, undergo differentiation, and experience injury following ischemia. To better define the physiological properties of NG2+ cells, we used transgenic mice that allowed an unbiased sampling of this population and unambiguous identification of cells in discrete states of differentiation. Using acute brain slices prepared from developing and mature mice, we found that NG2+ cells in diverse brain regions share a core set of physiological properties, including expression of voltage-gated Na+ (NaV) channels and ionotropic glutamate receptors, and formation of synapses with glutamatergic neurons. Although small amplitude Na+ spikes could be elicited in some NG2+ cells during the first postnatal week, they were not capable of generating action potentials. Transition of these progenitors to the premyelinating stage was accompanied by the rapid removal of synaptic input, as well as downregulation of AMPA and NMDA receptors and NaV channels. Thus, prior reports of physiological heterogeneity among NG2+ cells may reflect analysis of cells in later stages of maturation. These results suggest that NG2+ cells are uniquely positioned within the oligodendrocyte lineage to monitor the firing patterns of surrounding neurons.
Introduction
Action potentials allow neurons to integrate, amplify, and ultimately distill subthreshold responses into an all-or-nothing impulse to other, often distant members within a circuit and can influence gene expression and synaptic strength by triggering the activation of voltage-gated Ca2+ channels. Indeed, the ability to generate action potentials is considered a defining characteristic of neuronal identity. However, recent studies have suggested that a distinct class of glial cells, termed NG2+ cells (polydendrocytes), that are abundant in both gray and white matter of the CNS also have the ability to generate action potentials (Chittajallu et al., 2004; Káradóttir et al., 2008; Ge et al., 2009). Genetic fate mapping studies indicate that many NG2+ cells serve as progenitors for oligodendrocytes (OLs) (Rivers et al., 2008; Zhu et al., 2008b; Zhu et al., 2008a), suggesting that the excitability of these cells may be important for oligodendrogenesis. Nevertheless, not all NG2+ cells are excitable (Chittajallu et al., 2004; Káradóttir et al., 2008; Ge et al., 2009), raising questions about whether this behavior is restricted to a particular stage of CNS development or maturation state of these progenitors.
Although NG2+ cells lack an axon, they share other characteristics with neurons. In particular, they express ionotropic neurotransmitter receptors (Barres et al., 1990; Berger et al., 1992) and form direct synapses with glutamatergic neurons in both gray and white matter (Bergles et al., 2000; Jabs et al., 2005; Lin et al., 2005; Ge et al., 2006; Kukley et al., 2007; Ziskin et al., 2007; Mangin et al., 2008). Glutamate receptor activation has been shown to alter the proliferation, migration, and differentiation of NG2+ cells in vitro (Gallo et al., 1996; Yuan et al., 1998; Gudz et al., 2006), suggesting that this rapid form of communication may also regulate oligodendrocyte formation. Moreover, the expression of glutamate receptors with significant Ca2+ permeability is thought to render oligodendrocyte lineage cells susceptible to excitotoxic damage during ischemia (Back, 2006). However, it is not yet known when during development neuron-NG2+ cell synapses are formed or what stages within the oligodendrocyte lineage engage in synaptic signaling with neurons.
Recent studies have reported that some NG2+ cells lack both glutamatergic synapses and voltage-gated Na+ (NaV) channels (Káradóttir et al., 2008), suggesting that there may be separate groups of NG2+ cells with distinct physiological functions. Indeed, lineage tracing studies indicate that some NG2+ cells in the mature brain cease proliferating and rarely, if ever, undergo differentiation (Rivers et al., 2008). It is possible that NG2+ cells that exhibit excitability and form synapses participate in other aspects of brain function, such as serving as neuronal progenitors (Belachew et al., 2003; Rivers et al., 2008). However, the relationship between the fate of NG2+ cells and their physiological properties has not been determined.
Here, we defined the prevalence of excitability and synaptic connectivity within the NG2+ cell population in gray and white matter throughout development, using transgenic mice to obtain both an unbiased sample of the NG2+ cell population and to identify cells in distinct stages of oligodendrocyte maturation. In contrast to previous reports, we found that few NG2+ cells were excitable, and that this behavior was restricted to early postnatal development. In addition, after the first postnatal week, all NG2+ cells received synaptic input from neurons. Synaptic signaling was rapidly lost, and both glutamate receptors and NaV channels were downregulated as NG2+ cells differentiated into oligodendrocytes. These studies indicate that NG2+ cells are uniquely positioned within the oligodendrocyte lineage to respond to rapid changes in neuronal activity, and that prior reports of physiological heterogeneity among NG2+ cells are likely to have resulted from analysis of differentiating cells.
Materials and Methods
Transgenic mice.
NG2-DsRed bacterial artificial chromosome (BAC) transgenic mice expressing DsRed-T1 under the control of the NG2 promoter were described previously (Ziskin et al., 2007; Zhu et al., 2008b). NG2-CreER BAC transgenic mice were generated by replacing the DsRed cDNA sequence in the previously described NG2-DsRed BAC transgene with creERTM cDNA sequence (Hayashi et al., 2002) using a cDNA clone provided by Dr. Hirohide Takebayashi (Kumamoto University, Kumamoto City, Japan). BAC recombination was achieved as previously described (Zhu et al., 2008b), and purified recombinant BAC DNA was microinjected into fertilized oocytes. Founders were obtained and crossed to the Z/EG (lacZ/EGFP) line of reporter mice (Novak et al., 2000). All experiments were performed in strict accordance with protocols approved by the Animal Care and Use Committee at Johns Hopkins University.
Slice preparation.
Mice were given a single 1 mg intraperitoneal injection of 4-hydroxy-tamoxifen (4HT) between postnatal day (P)14–21. At 2–25 d postinjection (PI), mice were anesthetized with isofluorane and decapitated; their brains were dissected into an ice-cold N-methyl-d-glucamine (NMDG)-based solution containing the following (in mm): 135 NMDG, 1 KCl, 1.2 KH2PO4, 20 choline bicarbonate, 10 glucose, 1.5 MgCl2, and 0.5 CaCl2 (pH 7.4, 310 mOsm). Forebrain slices (250 μm thick) were prepared using a vibratome equipped with sapphire blade in ice-cold NMDG-based cutting solution. Following sectioning, slices were transferred to artificial CSF (ACSF) containing the following (in mm): 119 NaCl, 2.5 KCl, 2.5 CaCl2, 1.3 MgCl2, 1 NaH2PO4, 26.2 NaHCO3, and 11 glucose (290 mOsm) and were maintained at 37°C for 30 min, and at room temperature thereafter. Both NMDG solution and ACSF were bubbled continuously with 95% O2/5% CO2. All experiments were performed at room temperature.
Electrophysiology.
NG2+ cells were visualized with an upright microscope (Zeiss Axioskop FS2) equipped with both DIC optics and filter sets for DsRed (HQ:TRITC 41002c, Chroma) and GFP (Brightline, GFP-A-Basic-ZHE, Semrock), and two charge-coupled device (CCD) cameras (Sony XC-73 and XC-EI30). A 40× water-immersion objective (Zeiss Acroplan 40× IR) was used for most experiments and a 20× water-immersion objective (Olympus UMPlanFl 20×/0.50 W) was used for UV-uncaging experiments. Whole-cell recordings were made under visual control using both fluorescence and IR-DIC as a guide. NG2+ cells [oligodendrocyte progenitor cells (OPCs)] could be clearly distinguished from pericytes, which also express DsRed in NG2-DsRed mice (Ziskin et al., 2007), on the basis of their distinct morphologies (Krueger and Bechmann, 2009). For hypertonic solution (HS) and UV-uncaging experiments, the electrode solution consisted of the following (in mm): 100 CsCH3SO3H [cesium methanesulfonate (CsMeS)], 20 tetraethylammonium (TEA) chloride, 20 HEPES, 1 MgCl2, 10 EGTA, 2 sodium ATP, and 0.2 sodium GTP (pH 7.3, 295 mOsm). For experiments performed in current-clamp mode, CsMeS was replaced with KCH3SO3H [potassium methanesulfonate (KMeS)] in the electrode solution and TEA was omitted. Pipette resistance was 3.2–4.2 MΩ and recordings were made without series resistance compensation. HS (normal ACSF containing 500 mm sucrose; 850–900 mOsm) was focally delivered through a glass pipette (resistance 1–1.5 MΩ) using a pressure application system (Toohey, Pressure System IIc) using 4–5 psi. The HS-containing pipette was positioned within the slice ∼40–60 μm from the soma of the recorded cell. For experiments with bafilomycin A1 (Baf), brain sections were prepared as described above, but following recovery in ACSF at 37°C, were transferred to ACSF containing either 2 μm Baf (vesicular ATPase inhibitor; Biomol) or vehicle (DMSO) for at least 2 h before recording. For examination of recorded cell morphology, neurobiotin (0.2%, Vector Laboratories) was included in the recording pipette. For glutamate uncaging experiments, MNI-l-glutamate (500 μm, Tocris Bioscience) was locally perfused over the slice with a wide-bore glass pipette. Photolysis was accomplished with a 1 ms flash of UV light from a Stabilite 2017 argon laser (Spectra Physics) in a 100 μm circle centered on the cell body, as described previously (Huang et al., 2004). All uncaging experiments were performed in normal ACSF, except for a subset of recordings in mature oligodendrocytes testing for sensitivity of the uncaging response to CPP, which were performed in ACSF containing 0 Mg2+ and 30 μm d-serine (a coagonist at the NMDA receptor glycine binding site; Aldrich). The following agents were applied by addition to the superfusing ACSF: TTX (NaV antagonist; Ascent Scientific, 1 μΜ), gabazine (SR-95531; GABA receptor antagonist; Tocris Bioscience, 5 μΜ), RS-CPP (NMDA receptor antagonist; Tocris Bioscience, 5 or 20 μm for uncaging), 2,3-dihydroxy-6-nitro-7-sulfamoyl-benzo(f)quinoxaline (NBQX; competitive AMPA/kainate receptor antagonist; Tocris Bioscience, 5 or 50 μm for uncaging), GYKI 53655 (AMPA selective, noncompetitive antagonist; IVAX 100 μΜ), and TBOA (competitive glutamate transporter blocker; Tocris Bioscience, 300 μΜ).
Analysis.
Responses were recorded using a MultiClamp 700A amplifier (Molecular Devices), filtered at 3 kHz, digitized at 50 kHz and recorded to disk using pClamp9.2 software (Molecular Devices). Data were analyzed off-line using Clampfit (Molecular Devices), Origin (OriginLab) and Mini analysis (Synaptosoft) software. Input resistance and membrane capacitance were calculated from a 10 mV depolarizing step from a holding potential of −80 mV. The amplitude of NaV was calculated from a 70 mV depolarizing step (holding potential −80 mV) performed before and after addition of TTX to the bath and within 2 min of initiating whole-cell recording. Resting membrane potential was measured within 30 s of establishing whole-cell recording (KMeS-based internal solution). The response to HS was quantified by counting the number of mEPSCs (>5 pA amplitude, <1 ms rise time as measured in MiniAnalysis software) for 15 s after the initiation of a 10 s HS application. For each cell, the total number of mEPSCs from two successive puffs (separated by at least 1.5 min) was taken to be the magnitude of the response to hypertonic challenge. For clarity, slow alterations in holding current observed during application of hypertonic solution were subtracted from baseline using pCLAMP software. For hypertonic solution and uncaging experiments in differentiating cells, DsRed intensity was used to guide selection of cells for recording and basic membrane properties were used to categorize the stage of differentiation as follows: cells with NaV current and <35 pF capacitance were considered NG2+ cells, cells with or without NaV with >35 pF capacitance and >500 MΩ membrane resistance were considered premyelinating oligodendrocytes (pre-OLs), and cells that lacked NaV currents with <500 MΩ membrane resistance were considered oligodendrocytes. The amplitudes of uncaging responses were calculated by subtracting current responses before and after addition of NBQX/GYKI53655 (for AMPAR-mediated responses) and RS-CPP (for NMDAR-mediated responses) to the bath. Data are expressed as mean ± SEM throughout, and statistical significance was determined using the Mann–Whitney test with a cutoff value of 0.05 and Kruskal–Wallis ANOVA with sequential Bonferroni correction for multiple comparisons.
Histology.
Mice were anesthetized with pentobarbital and subjected to cardiac perfusion with 4% paraformaldehyde in 0.1 m sodium phosphate buffer in accordance with a protocol approved by the Animal Care and Use Committee at Johns Hopkins University. Brain tissue was isolated and postfixed in this solution for 6–18 h at 4°C, then washed in phosphate buffer, cryoprotected in 30% sucrose, and sectioned at 30–60 μm on a sliding microtome (Leica). Free-floating sections were then permeabilized/blocked with 0.3% Triton X-100 and 5% normal donkey serum in 0.1 m sodium phosphate buffer for 2 h at room temperature or 4°C overnight. Sections were incubated with primary antibodies prepared in permeabilizing/blocking solution for 4 h at room temperature or 4°C overnight. Sections were incubated with secondary antibodies in 5% normal donkey serum in 0.1 m sodium phosphate buffer for 2 h at room temperature. For immunolabeling with CC1 antibody, which marks mature oligodendrocytes (Bhat et al., 1996), sections were treated with LAB solution (Polysciences) for 10–15 min before blocking. For recovery of neurobiotin-filled cells, brain sections were transferred directly from the recording setup into 4% paraformaldehyde in 0.1 m sodium phosphate buffer and were incubated for 2–6 h at 4°C and then transferred to 0.1 m sodium phosphate buffer. Following permeabilization/blocking as described above, sections were incubated with Alexa488- (1:500, Invitrogen) or Cy5- (1:500, Jackson ImmunoResearch)-conjugated streptavidin for detection of neurobiotin. Control sections incubated with secondary antibody alone did not result in labeling of cells. Primary antibodies used were as follows: rabbit and guinea pig anti-NG2 (1:500; gift from Dr. Stallcup, Burnham Institute, La Jolla, CA), rabbit anti-GFP (1:500, gift from Dr. Huganir, Johns Hopkins University, Baltimore, MD), chicken anti-GFP (1:500, Millipore Bioscience Research Reagents), guinea pig anti-GFAP (1:500, Advanced ImmunoChemical), rabbit anti-IBA1 (1:500, Wako), CC1 (1:50, Anti-APC/Ab-7, Calbiochem), guinea pig anti-Olig2 (1:10,000, gift from Dr. Ben Novitch, UCLA, Los Angeles, CA), and rabbit anti-Olig2 (1:500, Millipore). Secondary antibodies (raised in donkey) were as follows: Alexa 488- (Invitrogen) and Cy2-, Cy3-, or Cy5-conjugated secondary antibodies to rabbit, mouse, goat or guinea pig (1:500; Jackson ImmunoResearch).
Image acquisition and analysis.
Fluorescence images were collected with a LSM 510 Meta confocal microscope (Zeiss) using 40× (EC Plan-Neofluar, Zeiss), 25× (LD LCI Plan-Apochromat, Zeiss), or 63× (Plan-Apochromat, Zeiss) oil-immersion objectives and 488 nm, 561 nm and 633 nm laser lines filtered using 500–550 nm bandpass, 575–615 nm bandpass, and 635 nm long pass for meta detector. Z-stack images were taken at 0.3 μm intervals. To evaluate colocalization between GFP+ cells and NG2, PDGFαR, CC1, GFAP, and IBA1 immunostaining in NG2-CreER;Z/EG transgenic mice, images were acquired with the LSM 510 Meta confocal and imported into Imaris image analysis software for examination of fluorescence overlap in 3 dimensions. For quantification of overlap between GFP+ cells and NG2 and CC1, 100–350 GFP+ cells were examined from four mice at 2 d PI, two mice at 14 d PI, and four mice at 19–21 d PI. Overlap between GFP and Olig2 was examined in 187 GFP+ cells in four mice at 2 d PI. For quantification of overlap between GFP+ cells and markers for astrocytes and microglia (GFAP and IBA), 115–130 GFP+ cells from four mice were examined at 19 d PI.
Microarray analysis.
Cahoy et al. (2008) acutely purified neurons and glial cells from mouse brain and created a transcription database for each specific cell type using Affymetrix GeneChip Mouse Genome 430 2.0 and Exon 1.0 ST arrays. To examine changes in gene expression that accompany oligodendrocyte differentiation, we downloaded their raw data on OPCs, pre-OLs, and myelinating OLs from the NCBI Gene Expression Omnibus (GEO, http://www.ncbi.nlm.nih.gov/geo/) submission GSE9566. Affymetrix Mouse 430 CEL files were downloaded into the Partek Gene Suite and the data were adjusted for GC content, RMA (Irizarry et al., 2003) normalized with quantile normalization and mean probe summarization, and converted into Log2 notation. Gene expression was compared pair wise among the three cell classes in terms of the Log2 fold change of mean signal values, and two-sample t tests were run to determine statistical significance.
Results
NG2+ cells express voltage-gated sodium channels but do not fire action potentials
To determine the prevalence of NaV channels and the extent of excitability within the widely distributed population of NG2+ cells in mammalian brain, we used NG2-DsRed BAC transgenic mice (Ziskin et al., 2007; Zhu et al., 2008b) to identify NG2+ cells in two gray matter regions [hippocampus (HC) and cerebellar molecular layer (CB ml)] and two white matter regions [corpus callosum (CC) and cerebellar white matter (CB wm)] at different stages of development. Whole-cell voltage-clamp recordings in acute brain slices prepared from mature NG2-DsRed mice (P40–P45) revealed that all NG2+ cells in these brain regions exhibited TTX-sensitive currents (CC 18/18 cells, HC 14/14 cells, CB ml 9/9 cells, CB wm 8/8 cells) (Fig. 1a,b). NaV channel-mediated currents were also observed in all NG2+ cells (134/134 cells) in these brain regions at three earlier developmental periods (P5–P8, P12–P15, P20–P26), and there was no consistent change in NaV current density with age (Fig. 1b). These data suggest that NaV channel expression is a universal property of NG2+ cells in both gray and white matter regions of the developing and mature brain.
Figure 1.

NG2+ cells express voltage-gated Na+ channels but are inexcitable. a, TTX-sensitive inward currents induced by 70 mV depolarization from a holding potential of −80 mV in a P12 CA1 pyramidal neuron (left) and a P13 callosal NG2+ cell (right); illustration of how amplitude of peak NaV current was determined (far right). b, Comparison of NaV current density in NG2+ cells in CC, CA1 HC, CB ml, and CB wm at multiple developmental time points; n for each group indicated at the base of the column. NaV channel expression was not significantly altered across development in each brain region (for P5–P8 vs P40–P45, p = 0.60 CC, p = 0.78 HC, p = 0.36 CB wm; for P12–P15 vs P40–P45, p = 0.71 CB ml). c, Response of NG2+ cells in mature mice (P40–P45) to depolarizing current injection; for each brain region, two examples are shown; red trace, injection of 160 pA current. Black asterisk highlights responses where the first positive current injection was 500 pA. d, Response of NG2+ cells to depolarizing current injection at early developmental time points (P5–P8 CC, HC, CB wm and P12–P15 CB ml); for each brain region two examples are shown; red trace, injection of 160 pA current. Red asterisk highlights response where depolarization triggered a small Na+ spike. Black asterisk highlights responses where the largest current injection was 70 pA.
Although NG2+ cells express NaV channels, generation of an action potential requires a complex interplay of NaV and potassium conductances, and an appropriate membrane resistance. To determine whether NG2+ cells are capable of firing action potentials (APs), we measured the response of NG2+ cells to injection of depolarizing currents. While voltage-activated conductances were evident in these recordings, NG2+ cells in mature mice (P40–P45) did not fire action potentials (0/8 CC, 0/11 HC, 0/5 CB ml, 0/10 CB wm cells fired APs) (Fig. 1c). Similar results were observed at intermediate developmental time periods (P12–P15 and P20–P26) (0/10 CC, 0/6 HC, 0/12 CB ml, 0/14 CB wm cells fired APs). At the earliest developmental periods examined (P5–P8), some cells in the corpus callosum (4/7 cells) generated a single spike upon depolarization (Fig. 1d; supplemental Fig. 1, available at www.jneurosci.org as supplemental material), similar to responses observed in NG2+ cells in the developing cortex (Chittajallu et al., 2004; Ge et al., 2009); however, these spikes did not meet criteria normally used to define APs, as they exhibited a high threshold for activation (−22 ± 1 mV), their amplitudes increased with larger current injections, and they did not substantially overshoot 0 mV (peak depolarization: 0.4 ± 1 mV). In addition, cells that exhibited these spikes were unable to sustain repetitive firing with continued depolarization, they did not exhibit spontaneous firing, and NG2+ cells in other brain regions at these ages did not exhibit such spikes (0/6 HC, 0/5 CB wm cells); the molecular layer of the cerebellum was not analyzed, as it is not fully formed at this age. Together, these data indicate that during early postnatal development the membrane properties of some NG2+ cells are permissive for generation of small Na+ spikes in response to a depolarizing stimulus, but that this rudimentary form of excitability does not persist into adulthood.
All NG2+ cells form synapses with neurons
In neurons that are not tonically active, action potentials are normally triggered in response to excitatory synaptic input. NG2+ cells receive depolarizing synaptic input from glutamatergic neurons (Bergles et al., 2000; Lin and Bergles, 2004); however, recent studies suggest that these synapses may only exist in a subset of NG2+ cells (Káradóttir et al., 2008), and NG2+ cells that received synaptic input exhibited enhanced susceptibility to excitotoxic damage after ischemia. Due to this selective vulnerability, it is important to determine the extent to which this population of progenitors engages in synaptic signaling in different brain regions. Measuring the innervation of NG2+ cells is challenging because these axo-glial synapses exhibit low rates of spontaneous release (Bergles et al., 2000; Lin et al., 2005; Ziskin et al., 2007) and because responses evoked through stimulation of surrounding axons depend critically on the position of the stimulus electrode.
To obtain an unbiased measure of synaptic connectivity with these glial cells, we made whole-cell voltage-clamp recordings from NG2+ cells and focally applied hypertonic solution (500 mm sucrose in aCSF) to force fusion of docked, primed synaptic vesicles from presynaptic membranes in contact with these cells. This manipulation has been used extensively to study vesicular release from nerve terminals (Fatt and Katz, 1952), and draws upon the same pool of vesicles that is released in response to action potentials (Stevens and Tsujimoto, 1995; Rosenmund and Stevens, 1996). In the presence of antagonists for NaV channels (TTX, 1 μm), GABAA receptors (gabazine, 5 μm), and NMDA receptors (R,S-CPP, 5 μm), HS reliably elicited bursts of transient inward currents in NG2+ cells (Fig. 2a,b) that were blocked by the AMPA receptor antagonist NBQX (5 μm, n = 10) (Fig. 2c). The amplitudes and kinetics (10–90% rise: 0.4 ms, τ decay: 1.2 ms) of these HS-elicited events (Fig. 2d) were similar to spontaneous miniature EPSCs (mEPSCs) recorded from NG2+ cells previously (Bergles et al., 2000; Lin et al., 2005; Kukley et al., 2007; Ziskin et al., 2007). Moreover, pretreatment of brain slices with the vesicular ATPase inhibitor Baf (2 μm), which prevents loading of neurotransmitter into synaptic vesicles (Bowman et al., 1988), significantly reduced HS-evoked responses in NG2+ cells in both gray (control: 131 ± 23 mEPSCs, Baf: 18 ± 9 mEPSCs, p = 0.0008) and white matter (control: 188 ± 51 mEPSCs, Baf: 39 ± 19 mEPSCs, p = 0.0008) (Fig. 2e,f), consistent with the ability of Baf to decrease evoked glutamate release at axo-NG2+ cell synapses in the corpus callosum (Ziskin et al., 2007). These results indicate that hypertonic challenge drives vesicular release of glutamate at defined neuron-NG2+ cell synapses, and can be used to provide a more objective measure of synaptic connectivity between neurons and NG2+ cells.
Figure 2.

Hypertonic solution induces vesicular release of glutamate at neuron-NG2+ cell synapses. a, Response of a callosal NG2+ cell (P24 mouse) to HS (recorded in 1 μm TTX, 5 μm gabazine, and 5 μm RS-CPP). b, Expanded time scale for the region indicated in a by the open bar; mEPSCs identified by asterisks are further expanded at right. c, Response of the same NG2+ cell to hypertonic challenge following addition of NBQX (5 μm) to the bath. d, Amplitude distribution for HS-elicited mEPSCs in a; inset shows an average trace prepared from all mEPSCs (10–90% rise = 0.4 ms), with a single exponential fit with a τ decay of 1.2 ms shown in gray. Calibration, 5 pA and 2.5 ms. e, HS response of callosal NG2+ cell from a control brain slice (Ctr; top; preincubated with DMSO) and a brain slice preincubated with 2 μm Baf (bottom; both from same mouse, P25). f, Quantification of HS responses from all bafilomycin and control recordings in CC and HC; Ctr CC n = 9, Baf CC n = 9, *p = 0.0008; Ctr HC n = 6, Baf HC n = 9, **p = 0.0008.
Analysis of axo-glial synaptic signaling in mature mice (P40–P45) revealed that all NG2+ cells displayed robust mEPSCs in response to hypertonic challenge (Fig. 3a,c) (CC n = 12, HC n = 10, CB ml n = 8, CB wm n = 9). Unexpectedly, NG2+ cells in the corpus callosum, a brain region largely devoid of neurons, displayed significantly larger HS-evoked responses (370 ± 43 events) than NG2+ cells in other brain regions (HC, 149 ± 30 mEPSCs; CB ml, 165 ± 27 mEPSCs; CB wm, 73 ± 17 mEPSCs) (Fig. 3c). The kinetics and amplitudes of HS-elicited mEPSCs did not differ significantly between NG2+ cells in different brain regions, suggesting that postsynaptic receptor density and receptor subunit composition are similar among neuron-NG2+ cell synapses (supplemental Fig. 2a, available at www.jneurosci.org as supplemental material). At the earliest postnatal periods examined (P5–P10), hypertonic challenge also evoked synaptic responses in the majority of NG2+ cells (Fig. 3b,c) (CC, 5/7 cells; HC, 5/5 cells; CB wm, 9/9 cells), and at intermediate developmental periods (P12–P15 and P20–P26), hypertonic challenge elicited synaptic responses in all NG2+ cells (74/74 cells; n = 5–18 cells per age, per region). The degree of synaptic connectivity was not correlated with the length of time elapsed after slice preparation (supplemental Fig. 2b, available at www.jneurosci.org as supplemental material), suggesting that these junctions are not formed or removed as part of an injury response. These findings demonstrate that this rapid form of neuron-glial communication is established during early postnatal development in parallel with synapse formation between neurons, and suggest that all NG2+ cells engage in synaptic signaling after the first postnatal week.
Figure 3.

Glutamatergic synapses are established with NG2+ cells during the first postnatal week. a, Sample responses to HS from NG2+ cells in CC, CA1 HC, CB ml, and CB wm in mature mice. b, Sample HS responses from NG2+ cells in early postnatal periods. Postnatal age is indicated in parentheses for each trace in a and b. c, Quantification of HS-elicited mEPSCs from all recorded NG2+ cells in each brain region; n for each group indicated at the base of the column. *, P40–P45 CC vs HC p = 0.0005, P40–P45 CC vs CB ml p = 0.0009, P40–P45 CC vs CB wm p = 0.00001; **, P40–P45 CB wm vs HC p = 0.04, P40–P45 CB wm vs CB ml p = 0.01; ***, P5–P8 HC vs CC, p = 0.004. Following the first postnatal week, all NG2+ cells examined exhibited synaptic currents.
Identification of oligodendrocyte progenitors in distinct stages of differentiation
At later stages of mouse development, NG2+ cells exhibited more negative resting potentials (P5–P8: −69 ± 16 mV; P40–P45: −90 ± 2 mV) and lower membrane resistances (P5–P8: 2.1 ± 2 GΩ; P40–P45: 131 ± 176 MΩ), but physiologically distinct populations of progenitors were not evident on the basis of these properties (supplemental Fig. 3, available at www.jneurosci.org as supplemental material), NaV channel expression, or synaptic connectivity. However, NG2+ cells continue to proliferate and retain the ability to differentiate in the adult brain (Reyners et al., 1986; Rivers et al., 2008). Thus, one possible explanation for the reported physiological heterogeneity among NG2+ cells (Chittajallu et al., 2004; Chen et al., 2008; Káradóttir et al., 2008; Mangin et al., 2008; Ge et al., 2009), is that the dynamic nature of this cell population makes it difficult to distinguish true progenitors from cells that have begun to differentiate. Changes in membrane properties that accompany the maturation of oligodendrocyte progenitors have been examined in culture (Sontheimer et al., 1989), but it has not been possible to reliably identify distinct stages of progenitor maturation in situ. To establish whether synaptic contacts are maintained during NG2+ cell differentiation and to clarify whether excitability is present at later stages of oligodendrocyte maturation, we developed transgenic mice that express inducible Cre-recombinase under control of the NG2 promoter (NG2-CreER) and bred these animals to Z/EG reporter mice (Novak et al., 2000) (Fig. 4a). When NG2-CreER;Z/EG mice were injected with 4-OH-tamoxifen (4HT) during the peak of oligodendrogenesis (P14–P21) (Verity and Campagnoni, 1988; Foran and Peterson, 1992) and analyzed 2 d later, 91 ± 1% of GFP+ cells in the corpus callosum were NG2+ (352 cells, four mice); the remaining NG2−GFP+ cells were Olig2+, indicating that these cells remained within the oligodendrocyte lineage and likely had begun to differentiate (Fig. 4c,e). At 14 d postinjection, GFP+NG2+ cells were still evident, but GFP+NG2− cells had become widespread (Fig. 4b). When mice were analyzed 19–22 d after 4HT administration, 76 ± 5% of GFP+ cells exhibited immunoreactivity to the oligodendrocyte-specific antibody CC1 (233 cells, four mice), while 22 ± 4% of GFP+ cells remained NG2+ (245 cells, four mice) (Fig. 4d,e). NG2+ cells did not differentiate into astrocytes or microglia (supplemental Fig. 4a,b, available at www.jneurosci.org as supplemental material), indicating that this approach labels a cohort of progenitors in the corpus callosum, most of which differentiate into oligodendrocytes within a 20 d period.
Figure 4.
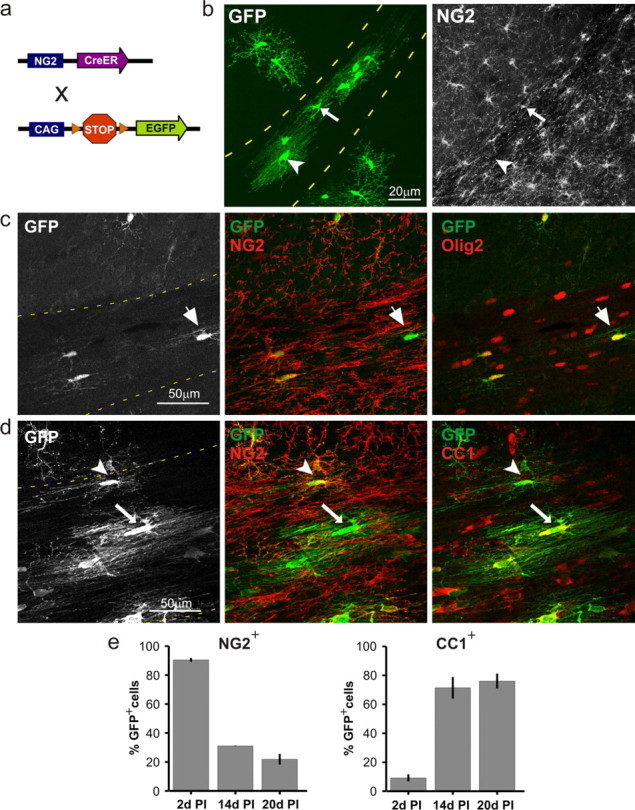
Labeling oligodendrocyte lineage cells in vivo using NG2-CreER;Z/EG transgenic mice. a, Diagram of the transgenic breeding strategy. b, Coronal forebrain section from an NG2-CreER;Z/EG mouse injected with 4-hydroxy-tamoxifen (4HT) at P16 and analyzed 14 d later (P16 + 14); arrow and arrowhead highlight NG2+ and NG2− GFP+ cells, respectively, in corpus callosum. c, GFP+ cells in the corpus callosum of a mouse analyzed 2 d after 4HT administration (P14 + 2); large arrow highlights a GFP+NG2− cell that exhibited immunoreactivity to the oligodendrocyte lineage marker Olig2. d, GFP+ cells in the corpus callosum at 19 d post-4HT administration (P14 + 19); the arrowhead highlights one GFP+NG2+CC1− cell and the arrow highlights one GFP+ cell that was NG2−CC1+. e, Percentage of GFP+ cells that were NG2 immunoreactive (NG2+) or CC1 immunoreactive (CC1+) at different times following (4HT) administration (PI). Boundary of corpus callosum indicated by dashed yellow line in b–d.
To identify cells at distinct stages of oligodendrocyte development, we crossed NG2-CreER;Z/EG mice with NG2-DsRed mice (Fig. 5a), because NG2 promoter activity (and DsRed fluorescence) decreases rapidly as these progenitors begin to mature (Ziskin et al., 2007; Zhu et al., 2008b). Following 4HT administration to NG2-CreER;Z/EG;NG2-DsRed mice, NG2+ cells should be GFP+DsRed+, pre-OLs should be GFP+DsRed+/−, and mature OLs should be GFP+DsRed−. Indeed, when these triple transgenic mice were examined 5–25 d after 4HT administration, GFP+ cells with variable DsRed expression were visible in the corpus callosum (Fig. 5b), and whole-cell current-clamp recordings in acute coronal slices revealed that these cells exhibited diverse physiological properties. We assigned cells to one of three groups based on their membrane properties, intensity of DsRed fluorescence, and morphology, as assessed through neurobiotin histochemistry (Fig. 5c,d and Table 1). Group 1 cells exhibited voltage-activated conductances upon depolarization, had very negative resting potentials, and displayed bipolar morphologies, properties typical of white matter NG2+ cells (Dawson et al., 2003; Chittajallu et al., 2004; Kukley et al., 2007; Ziskin et al., 2007). Group 2 cells rarely exhibited voltage-activated conductances, had higher membrane resistances, larger membrane capacitances, and extended highly ramified processes in a radial orientation, a key feature of pre-OLs (Ono et al., 2001). Group 3 cells also lacked voltage-activated conductances, had more positive resting potentials, displayed much lower membrane resistances, and exhibited a prolonged decay to baseline following depolarization, as previously reported for OLs (Sontheimer et al., 1989). Cells in this latter group formed parallel processes aligned with callosal axons, as expected for OLs. Previous studies have shown that oligodendrocyte progenitors decrease expression of NaV channels as differentiation proceeds in vitro (Sontheimer et al., 1989). Consistent with these observations, all group 1 cells exhibited NaV currents (current density: 37 ± 5 pA/pF; n = 21), whereas only 2/6 group 2 cells (current density = 3 ± 1 pA/pF for NaV channel-expressing cells) and 0/18 group 3 cells had NaV currents (Fig. 5e). In keeping with our previous observations, group 1 cells (NG2+ cells) did not fire action potentials upon depolarization (0/21 cells) despite expression of NaV channels, and cells at later stages of oligodendrocyte maturation were similarly inexcitable (0/6 group 2 cells and 0/18 group 3 cells generated Na+ spikes) (Fig. 5c), as would be expected given the decrease in NaV channel expression. These findings highlight the rapid physiological changes that accompany NG2+ cell differentiation, and show that a combination of GFP/DsRed imaging and physiological analysis in these transgenic mice can reliably distinguish oligodendrocyte lineage cells in distinct stages of maturation.
Figure 5.

Identification of oligodendrocyte lineage cells in distinct stages of differentiation. a, Strategy used to generate NG2-CreER;Z/EG;NG2-DsRed transgenic mice. b, Acute brain slice from a triple transgenic mouse (P16 + 21 d PI) showing GFP+ cells in corpus callosum with variable DsRed fluorescence; arrowhead and arrow highlight GFP+ cells that exhibited reduced and no DsRed fluorescence, respectively. c, Morphologies of representative GFP+ cells recorded from triple transgenic mice; numbers correspond to data points shown in d; inset shows response of that cell to depolarizing current injection; red trace, 160 pA current injection; calibration, 25 mV/100 ms. d, Plot of membrane capacitance versus resting membrane potential for GFP+ cells (recorded from mice at P14–P21 + 5–25 d PI), colored according to relative DsRed fluorescence. Dashed lines indicate the groups into which cells were classified, and data points identified by numbers correspond to cells in c. e, Plot in d colored according to NaV current amplitude.
Table 1.
Physiological properties of oligodendrocyte lineage cells
| N | Vm (mV) | Cm (pF) | NaV (pA) | Rinput (MΩ) | |
|---|---|---|---|---|---|
| Differentiation stage | |||||
| NG2+ cells (group 1) | 21 | −89 ± 0.4 | 20 ± 1.3 | 664 ± 86 | 293 ± 87 |
| Pre-OLs (group 2) | 6 | −87 ± 0.9 | 74 ± 8.5 | 71 ± 43 | 439 ± 89 |
| OLs (group 3) | 21 | −58 ± 1.7 | 48 ± 6.6 | 0.000 | 58 ± 15 |
| Statistical significance | |||||
| NG2+ cells versus pre-OL | p < 0.05 | p < 0.001 | p < 0.001 | p < 0.05 | |
| NG2+ cells versus OL | p < 0.001 | p < 0.001 | p < 0.001 | p < 0.001 | |
| Pre-OL versus OL | p < 0.001 | NS | p < 0.05 | p < 0.001 |
NS, Not significant; Vm, resting membrane potential; Cm, membrane capacitance; Rinput, membrane resistance.
Synaptic signaling and glutamate receptor expression are rapidly decreased during NG2+ cell differentiation
To determine whether synaptic input to oligodendrocyte lineage cells is altered during differentiation, we recorded their responses to focally applied hypertonic solution, as described above. In NG2-CreER;Z/EG;NG2-DsRed mice, HS elicited bursts of mEPSCs in all NG2+ cells (average: 328 ± 58 mEPSCs, n = 16), but in only 2/8 pre-OLs (4.5 ± 3.5 mEPSCs, for cells that responded) and in 0/10 OLs (Fig. 6a–c), indicating that axo-glial synaptic junctions in the corpus callosum are rapidly lost as NG2+ cells begin to differentiate into oligodendrocytes. As expected, this loss of synaptic input was accompanied by a decrease in NaV current density (Fig. 6b). To determine whether the loss of synaptic signaling is accompanied by changes in surface glutamate receptors, we measured the response of oligodendrocyte lineage cells to photolysis of caged glutamate. In all NG2+ cells examined (n = 27), photolysis of MNI-l-glutamate triggered inward currents (981 ± 118 pA) that were blocked by AMPA receptor antagonists (NBQX and GYKI 53655) (Fig. 6d). Glutamate uncaging similarly induced AMPA receptor currents in all pre-OLs (n = 25); however, the magnitude of these currents (345 ± 75 pA) was significantly smaller (p = 0.0003) (Fig. 6e; supplemental Fig. 5, available at www.jneurosci.org as supplemental material). As pre-OLs are much larger than NG2+ cells, this 2.8-fold reduction in AMPA receptor current represented a 12.6-fold decrease in receptor density (Fig. 6g). Glutamate uncaging also generated inward currents in all OLs (n = 30); however, these currents were only partially blocked by NBQX/GYKI 53655, and the AMPA receptor component (76 ± 22 pA) was substantially smaller than that observed in either NG2+ cells or pre-OLs (p < 0.0005) (Fig. 6f,g). Most of the uncaging response in OLs was blocked by the glutamate transporter antagonist TBOA (Fig. 6f), in accordance with previous findings (Regan et al., 2007). Together, these data indicate that the surface expression of AMPA receptors is markedly reduced as NG2+ cells differentiate into oligodendrocytes.
Figure 6.

Oligodendrogenesis is accompanied by loss of synaptic input and a decrease in glutamate receptor expression. a, Plot of number of mEPSCs versus membrane capacitance. Cells were classified as NG2+ cells, pre-OLs, or OLs based on DsRed fluorescence, membrane capacitance, membrane resistance, and NaV current density. b, Graph in a colored according to whether NaV current was detected, showing the tight correlation between loss of synapses and loss of NaV current. c, HS response of cells indicated by numbers in a and b. d, Response of a representative NG2+ cell to glutamate uncaging (black dot), recorded at −80 and 40 mV (in NBQX/GYKI53655). e, Response of a representative pre-OL to glutamate uncaging at −80 and 40 mV (in NBQX/GYKI53655). f, Response of representative OLs to glutamate uncaging recorded at −80 mV showing effects of NBQX/GYKI53655, RS-CPP (upper trace, 0 Mg2+ ACSF/30 μm d-serine), and TBOA (lower trace, normal ACSF); insets show initial response at faster time scale. Bar, 20 ms. g, Quantification of peak AMPAR current normalized to membrane capacitance for NG2+ cells (n = 8), pre-OLs (n = 8), and OLs (n = 13); red asterisk: NG2+ cell vs pre-OL and NG2+ cell vs OL, p < 0.001; blue asterisk: OL vs pre-OL, p < 0.001.
Recent studies suggest that oligodendrocyte progenitors (Káradóttir et al., 2005; Ziskin et al., 2007) and mature oligodendrocytes (Káradóttir et al., 2005; Salter and Fern, 2005; Micu et al., 2006) also express NMDA receptors, which may contribute to excitotoxic white matter damage during ischemia. To evaluate whether NMDA receptor density is also altered during oligodendrocyte development, glutamate uncaging was performed in the presence of AMPA receptor antagonists at a holding potential of 40 mV (to relieve Mg2+ block of NMDA receptors). Under these conditions, glutamate uncaging elicited small outward currents in 15/18 NG2+ cells (21 ± 3 pA, n = 15) that were blocked by the NMDA receptor antagonist CPP (Fig. 6d). In contrast, CPP-sensitive currents were observed in only 3/15 pre-OLs (12 ± 2 pA, n = 3) (Fig. 6e), indicating that NMDA receptors also are rapidly downregulated as NG2+ cells differentiate. Comparable analysis of NMDA receptor expression by mature OLs was not possible, as their low membrane resistance prevented effective voltage clamp at 40 mV. However, when glutamate uncaging was performed in aCSF containing 0 mm Mg2+, 30 μm d-serine (an NMDA receptor coagonist), and NBQX/GYKI53655 at −80 mV, CPP only slightly reduced peak currents in OLs (15 ± 3 pA, n = 10) (Fig. 6f). These results suggest that NMDA receptors are not substantially upregulated as pre-OLs mature into OLs, in contradiction to previous findings (Káradóttir et al., 2005).
As an independent means for investigating the physiological changes that accompany NG2+ cell differentiation, we analyzed gene expression profiling data obtained from acutely isolated oligodendrocyte progenitors, premyelinating oligodendrocytes, and mature oligodendrocytes (Cahoy et al., 2008). Examination of mRNAs for PDGFαR and NG2 indicate that these transcripts are significantly upregulated in NG2+ cells (OPCs) compared with pre-OLs and OLs, while transcripts for MBP, CNPase, MOG, and MAG are highly downregulated in NG2+ cells compared with OLs (Fig. 7a; supplemental Table 1, available at www.jneurosci.org as supplemental material), confirming that these samples were prepared from cells in distinct stages of oligodendrocyte development. In accordance with the physiological studies reported here, mRNAs encoding most principal CNS NaV channel subunits (Scn1a, Scn2a1, Scn3a) were significantly upregulated in progenitors compared with OLs. Scn8a, which is expressed in cerebellar granule cells, hippocampal pyramidal and granule cells, and is highly concentrated at nodes of Ranvier, was not significantly altered, nor were transcripts that encode skeletal (Scn4a), cardiac (Scn5a/Scn7a), and dorsal root ganglion (Scn7a/Scn9a/Scn10a/Scn11a) NaV channels. In agreement with our glutamate uncaging analysis, mRNAs encoding AMPA receptor subunits GluR1-4 were highly upregulated in progenitors relative to both pre-OLs and OLs. Similarly, mRNA transcripts for the obligate NMDA receptor subunit NR1, as well as NR2D and NR3A, were significantly enriched in progenitors relative to OLs. These findings provide further confirmation of the profound physiological changes that NG2+ cells undergo after differentiation is initiated, and suggest that these changes reflect a rapid decrease in the expression of NaV channel, AMPA receptor, and NMDA receptor genes by oligodendrocyte lineage cells.
Figure 7.
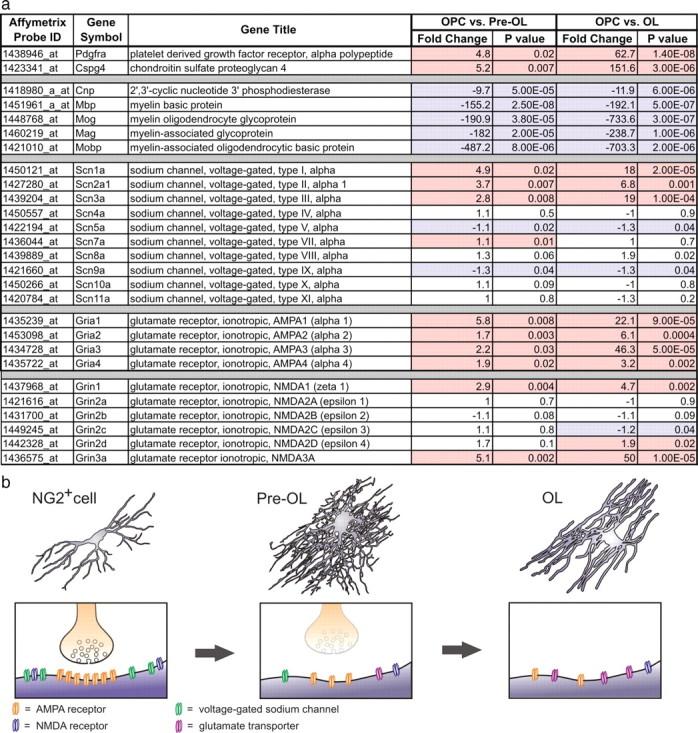
Gene expression profiling shows that mRNAs encoding glutamate receptor and NaV channel subunits decrease as NG2+ cells differentiate. a, Table showing mRNA transcripts that are significantly altered in NG2+ cells (OPCs) compared with pre-OLs and OLs. Transcripts that should be highly enriched in NG2+ cells (e.g., PDGFαR and CSPG4/NG2) and mature oligodendrocytes (CNP, MBP, MOG, MAG, MOBP) are shown at the top. For each transcript, the Affymetrix probe set showing the most significant alteration across differentiation is shown. Transcripts significantly enriched in OPCs are highlighted in red. Transcripts significantly downregulated in OPCs are highlighted in blue. Some gene titles have been shortened to conserve space, fold changes have been rounded to the nearest decimal, and p values have been rounded up. A complete list of Affymetrix probe sets for each transcript shown in the table is included in supplemental Table 1, available at www.jneurosci.org as supplemental material. b, Diagram illustrating the morphological changes (top) that NG2+ cells undergo as they differentiate into oligodendrocytes. Bottom, Extent of synaptic signaling and relative abundance of surface glutamate receptors and NaV channels during these distinct stages of oligodendrocyte development.
Discussion
NG2+ cells are an abundant, widely distributed class of glia in the mammalian CNS that exhibit properties distinct from astrocytes, oligodendrocytes, and microglia. Although many NG2+ cells serve as oligodendrocyte progenitors during development, their roles in the mature nervous system are less well understood. Recent studies have suggested that NG2+ cells are comprised of functionally distinct groups that differ in their capacity to respond to neuronal activity, their ability to differentiate into oligodendrocytes, and their susceptibility to damage during ischemia (Mallon et al., 2002; Káradóttir et al., 2008; Guo et al., 2009). However, our studies indicate that NG2+ cells in diverse brain regions share a core set of properties that include the expression of NaV channels and ionotropic glutamate receptors, as well as the formation of synapses with glutamatergic neurons. Although they express NaV channels, NG2+ cells were not capable of firing action potentials. Transition of these progenitors to the premyelinating stage was accompanied by rapid removal of synapses and downregulation of both AMPA and NMDA receptors. These studies indicate that NG2+ cells are uniquely positioned within the oligodendrocyte lineage to monitor the firing patterns of surrounding neurons.
Excitability within the oligodendrocyte lineage
In neurons, NaV channels are expressed at high density and are responsible for generation and propagation of action potentials. Although glial cells in the mammalian CNS lack the ability to sustain regenerative voltage changes, NG2+ cells in culture and in situ have consistently been shown to express NaV channels (Barres et al., 1989, 1990; Bergles et al., 2000; Chittajallu et al., 2004; Lin and Bergles, 2004; Lin et al., 2005; Ge et al., 2006; Chen et al., 2008; Káradóttir et al., 2008), and several studies in young mice indicate that depolarization induces Na+ spikes in some NG2+ cells (Chittajallu et al., 2004; Ge et al., 2009). However, there is not yet a consensus about whether NaV channel expression is present in NG2+ cells throughout the brain or whether they can generate bona fide action potentials. If NG2+ cells generate action potentials it would challenge their classification as glia, and raise the possibility that they can synchronize their output and perhaps transmit signals to surrounding neurons. Moreover, as the ability of oligodendrocyte lineage cells to fire action potentials has been linked to their vulnerability to excitotoxicity during ischemia (Káradóttir et al., 2008), targeting this feature of their physiology could be an effective therapeutic approach for minimizing ischemic white matter damage.
Action potentials are classically defined as regenerative, all-or-nothing events, with a discrete threshold of activation (normally ∼−40 mV), invariant amplitude, and a peak depolarization that approaches the sodium equilibrium potential (ENa) (Purves, 2001). In accordance with previous studies, injection of positive current led to a Na+-dependent spike in a small proportion of NG2+ cells (Fig. 1d). However, this behavior was limited to early postnatal development, when these cells exhibit a higher membrane resistance and lower resting conductance to K+. In all cases, these spikes did not fulfill the criteria for action potentials, as they displayed variable amplitudes and wave forms depending on the amplitude of injected current (supplemental Fig. 1, available at www.jneurosci.org as supplemental material), exhibited a peak depolarization (0.4 ± 1 mV) far from ENa (∼50 mV) and high activation thresholds (−22 ± 1 mV). In addition, NG2+ cells were not capable of generating more than one spike in response to sustained depolarization, and spontaneous spike generation was never observed. These results show that NaV channel-mediated spikes are induced in NG2+ cells only following depolarizations that are unlikely to be produced by in vivo patterns of activity. Although NG2+ cells in the mature brain also express NaV channels, they have a much higher resting conductance to K+, which prevents generation of Na+ spikes.
A recent study reported that a subset of NG2+ cells in the developing rat cerebellar white matter exhibit regenerative responses that meet the criteria for action potentials (Káradóttir et al., 2008); moreover, these cells were also able to generate trains of action potentials with sustained depolarization. We did not observe such firing behavior in any NG2+ cells in the brain regions examined in this study, which included the cerebellar white matter at a comparable age. It is unlikely that species differences account for this discrepancy, as prior studies have shown that NG2+ cells in rat and mouse exhibit comparable properties (Bergles et al., 2000; Chittajallu et al., 2004; Lin and Bergles, 2004; Jabs et al., 2005; Ge et al., 2006; Mangin et al., 2008). Although we cannot exclude the possibility that NG2+ cells not sampled here exhibit robust excitability, immunostaining revealed that DsRed, which was used to select cells for recording, is expressed in 98% (186/190) of NG2+ cells at P7, and 99% (141/143) of NG2+ cells at P14 in the cerebellar white matter of NG2-DsRed mice (supplemental Fig. 6, available at www.jneurosci.org as supplemental material), indicating that the ability to generate action potentials is not a common feature of these glial cells. It is known that the cerebellar white matter is densely populated by interneuron precursors during the first two postnatal weeks (Maricich and Herrup, 1999; Weisheit et al., 2006). It is possible that the excitable cells described by Káradóttir et al. (2008) correspond to interneurons, rather than NG2+ cells.
Despite their inability to generate action potentials, we found that all NG2+ cells (183/183 cells) expressed NaV channels, regardless of brain region or period of development. The expression of NaV channels could indicate that NG2+ cells are in the initial stages of transitioning to a neuronal fate, as it has been suggested that NG2+ cells serve as multipotent progenitors with the capacity to differentiate into neurons (Belachew et al., 2003; Rivers et al., 2008; Guo et al., 2009). However, the density of NaV channel expression was not correlated with the degree of synaptic connectivity (supplemental Fig. 2c, available at www.jneurosci.org as supplemental material); if synaptic input were used to trigger action potentials, or if these cells were maturing into neurons, these attributes would be expected to develop in parallel. Furthermore, synaptic connectivity and NaV channel expression were present in NG2+ cells within the corpus callosum at a time when the majority of these cells develop into oligodendrocytes (Fig. 4a–e). If NaV channels are not used to generate action potentials, why are they expressed? NaV channels are also expressed by other nonexcitable cells in the CNS, including astrocytes, oligodendrocytes, and microglia (Verkhratsky and Steinhäuser, 2000). In microglia, NaV channels are important for both phagocytic activity and migration (Black et al., 2009), and in tumor cells NaV channels can regulate proliferation and adhesive interactions with other cells (Kaczmarek, 2006). As NG2+ cells retain the ability to migrate and proliferate in the adult brain, it is possible that NaV channels also contribute to these dynamic behaviors.
Glutamate signaling within the oligodendrocyte lineage
Paracrine cues from neurons are sufficient to direct numerous glial cell behaviors (Fields and Burnstock, 2006; Biber et al., 2007; Nave and Trapp, 2008), yet neurons form direct synaptic junctions with NG2+ cells throughout the brain, allowing rapid, precise signaling. In vitro studies indicate that glutamate receptor activation influences the migration, proliferation and differentiation of NG2+ cells (Gallo et al., 1996; Yuan et al., 1998; Gudz et al., 2006), suggesting that this pathway for communication plays an essential role in oligodendrogenesis. Although neuronal activity has been shown to influence the behavior of oligodendrocyte lineage cells in vivo (Barres and Raff, 1993; Levine, 1994; Stevens et al., 2002), it is not yet known whether these effects are mediated through signaling at axon-NG2+ cell synaptic junctions. A recent study reported that only a subset of NG2+ cells form synapses with neurons (Káradóttir et al., 2008), and that only those cells that engage in synaptic signaling are vulnerable to injury following ischemia (Káradóttir et al., 2008). Here we used focal application of hypertonic solution, an approach routinely used to measure the pool of docked vesicles in nerve terminals (Rosenmund and Stevens, 1996; Zhou et al., 2000), to provide a relatively unbiased measure of NG2+ cell synaptic connectivity in four brain regions at different stages of development. Neuron-NG2+ cell synaptic signaling emerged during the first postnatal week, after which all NG2+ cells in both gray and white matter received glutamatergic synaptic input. In addition, synaptic inputs were rapidly lost as NG2+ cells differentiated, indicating that this mode of rapid signaling is restricted to the progenitor state. These results suggest that previous reports of NG2+ cells that lack glutamatergic synapses (Chittajallu et al., 2004; Káradóttir et al., 2008; Ge et al., 2009) may have inadvertently examined cells that were in the process of differentiation.
Perinatal hypoxia/ischemia can lead to a profound loss of white matter, which is thought to contribute to the neurological symptoms underlying cerebral palsy (Folkerth, 2005; Johnston and Hoon, 2006). Immature oligodendrocytes are particularly vulnerable to ischemic injury (Fern and Möller, 2000; Back et al., 2001, 2002; Riddle et al., 2006), and pharmacological studies indicate that AMPA and NMDA receptors participate in ischemia-induced cell death (Káradóttir et al., 2005; Salter and Fern, 2005; Back, 2006; Micu et al., 2006; Tekkök et al., 2007), suggesting that excitotoxic damage to oligodendrocyte progenitors can have profound consequences for the development of myelin. In accordance with previous findings (Ziskin et al., 2007), glutamate uncaging indicated that AMPA and NMDA receptors are expressed by NG2+ cells in the corpus callosum. In contrast to Káradóttir et al. (2005), we did not encounter a subset of NG2+ cells that lacked glutamatergic synapses, nor did we observe an increase in NMDA receptor expression as progenitors matured into oligodendrocytes. Rather, both AMPA and NMDA receptor currents were dramatically reduced at the premyelinating stage, and were further diminished in oligodendrocytes (Fig. 6d–g). Our findings are in concordance with gene expression data indicating that mRNAs encoding most glutamate receptor subunits are significantly lower in premyelinating oligodendrocytes and mature oligodendrocytes than in oligodendrocyte progenitors (Cahoy et al., 2008). The higher expression of glutamate receptors by oligodendrocyte progenitors may provide an explanation for the enhanced vulnerability of these cells to ischemic injury. Selective deletion of glutamate receptors from the oligodendrocyte lineage using genetic approaches will help determine the contribution of these receptors to the maturation of these progenitors and the loss of white matter following perinatal hypoxia/ischemia.
Footnotes
This work was supported by U.S. National Institutes of Health Grants NS051509 (D.E.B.), PAR-02-059 (D.E.B.), and NS049267 (A.N.), the National Alliance for Research on Schizophrenia and Depression (D.E.B.), and the National Multiple Sclerosis Society (A.N.). We thank H. Takebayashi (Kumamoto University, Kumamoto City, Japan) for providing BAC cloning reagents, W. B. Stallcup (Burnham Institute, San Diego) for antibodies to NG2, R. Huganir (Johns Hopkins University, Baltimore) for antibodies to GFP, B. Novitch (University of California, Los Angeles) for antibodies to Olig2, N. Nishiyama and N. Ye for assistance with genotyping and mouse breeding, the IVAX Drug Research Institute for GYKI 53655, C. Talbot (JHMI Microarray Core) for assistance with gene expression analysis, and S. Kang for advice about in vivo Cre-mediated recombination.
References
- Back SA. Perinatal white matter injury: the changing spectrum of pathology and emerging insights into pathogenetic mechanisms. Ment Retard Dev Disabil Res Rev. 2006;12:129–140. doi: 10.1002/mrdd.20107. [DOI] [PubMed] [Google Scholar]
- Back SA, Luo NL, Borenstein NS, Levine JM, Volpe JJ, Kinney HC. Late oligodendrocyte progenitors coincide with the developmental window of vulnerability for human perinatal white matter injury. J Neurosci. 2001;21:1302–1312. doi: 10.1523/JNEUROSCI.21-04-01302.2001. [DOI] [PMC free article] [PubMed] [Google Scholar]
- Back SA, Han BH, Luo NL, Chricton CA, Xanthoudakis S, Tam J, Arvin KL, Holtzman DM. Selective vulnerability of late oligodendrocyte progenitors to hypoxia–ischemia. J Neurosci. 2002;22:455–463. doi: 10.1523/JNEUROSCI.22-02-00455.2002. [DOI] [PMC free article] [PubMed] [Google Scholar]
- Barres BA, Raff MC. Proliferation of oligodendrocyte precursor cells depends on electrical activity in axons. Nature. 1993;361:258–260. doi: 10.1038/361258a0. [DOI] [PubMed] [Google Scholar]
- Barres BA, Chun LL, Corey DP. Glial and neuronal forms of the voltage-dependent sodium channel: characteristics and cell-type distribution. Neuron. 1989;2:1375–1388. doi: 10.1016/0896-6273(89)90076-7. [DOI] [PubMed] [Google Scholar]
- Barres BA, Koroshetz WJ, Swartz KJ, Chun LL, Corey DP. Ion channel expression by white matter glia: the O-2A glial progenitor cell. Neuron. 1990;4:507–524. doi: 10.1016/0896-6273(90)90109-s. [DOI] [PubMed] [Google Scholar]
- Belachew S, Chittajallu R, Aguirre AA, Yuan X, Kirby M, Anderson S, Gallo V. Postnatal NG2 proteoglycan-expressing progenitor cells are intrinsically multipotent and generate functional neurons. J Cell Biol. 2003;161:169–186. doi: 10.1083/jcb.200210110. [DOI] [PMC free article] [PubMed] [Google Scholar]
- Berger T, Walz W, Schnitzer J, Kettenmann H. GABA- and glutamate-activated currents in glial cells of the mouse corpus callosum slice. J Neurosci Res. 1992;31:21–27. doi: 10.1002/jnr.490310104. [DOI] [PubMed] [Google Scholar]
- Bergles DE, Roberts JD, Somogyi P, Jahr CE. Glutamatergic synapses on oligodendrocyte precursor cells in the hippocampus. Nature. 2000;405:187–191. doi: 10.1038/35012083. [DOI] [PubMed] [Google Scholar]
- Bhat RV, Axt KJ, Fosnaugh JS, Smith KJ, Johnson KA, Hill DE, Kinzler KW, Baraban JM. Expression of the APC tumor suppressor protein in oligodendroglia. Glia. 1996;17:169–174. doi: 10.1002/(SICI)1098-1136(199606)17:2<169::AID-GLIA8>3.0.CO;2-Y. [DOI] [PubMed] [Google Scholar]
- Biber K, Neumann H, Inoue K, Boddeke HW. Neuronal ‘On’ and ‘Off’ signals control microglia. Trends Neurosci. 2007;30:596–602. doi: 10.1016/j.tins.2007.08.007. [DOI] [PubMed] [Google Scholar]
- Black JA, Liu S, Waxman SG. Sodium channel activity modulates multiple functions in microglia. Glia. 2009;57:1072–1081. doi: 10.1002/glia.20830. [DOI] [PubMed] [Google Scholar]
- Bowman EJ, Siebers A, Altendorf K. Bafilomycins: a class of inhibitors of membrane ATPases from microorganisms, animal cells, and plant cells. Proc Natl Acad Sci U S A. 1988;85:7972–7976. doi: 10.1073/pnas.85.21.7972. [DOI] [PMC free article] [PubMed] [Google Scholar]
- Cahoy JD, Emery B, Kaushal A, Foo LC, Zamanian JL, Christopherson KS, Xing Y, Lubischer JL, Krieg PA, Krupenko SA, Thompson WJ, Barres BA. A transcriptome database for astrocytes, neurons, and oligodendrocytes: a new resource for understanding brain development and function. J Neurosci. 2008;28:264–278. doi: 10.1523/JNEUROSCI.4178-07.2008. [DOI] [PMC free article] [PubMed] [Google Scholar]
- Chen PH, Cai WQ, Wang LY, Deng QY. A morphological and electrophysiological study on the postnatal development of oligodendrocyte precursor cells in the rat brain. Brain Res. 2008;1243:27–37. doi: 10.1016/j.brainres.2008.09.029. [DOI] [PubMed] [Google Scholar]
- Chittajallu R, Aguirre A, Gallo V. NG2-positive cells in the mouse white and grey matter display distinct physiological properties. J Physiol. 2004;561:109–122. doi: 10.1113/jphysiol.2004.074252. [DOI] [PMC free article] [PubMed] [Google Scholar]
- Dawson MR, Polito A, Levine JM, Reynolds R. NG2-expressing glial progenitor cells: an abundant and widespread population of cycling cells in the adult rat CNS. Mol Cell Neurosci. 2003;24:476–488. doi: 10.1016/s1044-7431(03)00210-0. [DOI] [PubMed] [Google Scholar]
- Fatt P, Katz B. Spontaneous subthreshold activity at motor nerve endings. J Physiol. 1952;117:109–128. [PMC free article] [PubMed] [Google Scholar]
- Fern R, Möller T. Rapid ischemic cell death in immature oligodendrocytes: a fatal glutamate release feedback loop. J Neurosci. 2000;20:34–42. doi: 10.1523/JNEUROSCI.20-01-00034.2000. [DOI] [PMC free article] [PubMed] [Google Scholar]
- Fields RD, Burnstock G. Purinergic signalling in neuron-glia interactions. Nat Rev Neurosci. 2006;7:423–436. doi: 10.1038/nrn1928. [DOI] [PMC free article] [PubMed] [Google Scholar]
- Folkerth RD. Neuropathologic substrate of cerebral palsy. J Child Neurol. 2005;20:940–949. doi: 10.1177/08830738050200120301. [DOI] [PubMed] [Google Scholar]
- Foran DR, Peterson AC. Myelin acquisition in the central nervous system of the mouse revealed by an MBP-Lac Z transgene. J Neurosci. 1992;12:4890–4897. doi: 10.1523/JNEUROSCI.12-12-04890.1992. [DOI] [PMC free article] [PubMed] [Google Scholar]
- Gallo V, Zhou JM, McBain CJ, Wright P, Knutson PL, Armstrong RC. Oligodendrocyte progenitor cell proliferation and lineage progression are regulated by glutamate receptor-mediated K+ channel block. J Neurosci. 1996;16:2659–2670. doi: 10.1523/JNEUROSCI.16-08-02659.1996. [DOI] [PMC free article] [PubMed] [Google Scholar]
- Ge WP, Yang XJ, Zhang Z, Wang HK, Shen W, Deng QD, Duan S. Long-term potentiation of neuron-glia synapses mediated by Ca2+-permeable AMPA receptors. Science. 2006;312:1533–1537. doi: 10.1126/science.1124669. [DOI] [PubMed] [Google Scholar]
- Ge WP, Zhou W, Luo Q, Jan LY, Jan YN. Dividing glial cells maintain differentiated properties including complex morphology and functional synapses. Proc Natl Acad Sci U S A. 2009;106:328–333. doi: 10.1073/pnas.0811353106. [DOI] [PMC free article] [PubMed] [Google Scholar]
- Gudz TI, Komuro H, Macklin WB. Glutamate stimulates oligodendrocyte progenitor migration mediated via an αv integrin/myelin proteolipid protein complex. J Neurosci. 2006;26:2458–2466. doi: 10.1523/JNEUROSCI.4054-05.2006. [DOI] [PMC free article] [PubMed] [Google Scholar]
- Guo F, Ma J, McCauley E, Bannerman P, Pleasure D. Early postnatal proteolipid promoter-expressing progenitors produce multilineage cells in vivo. J Neurosci. 2009;29:7256–7270. doi: 10.1523/JNEUROSCI.5653-08.2009. [DOI] [PMC free article] [PubMed] [Google Scholar]
- Hayashi S, Lewis P, Pevny L, McMahon AP. Efficient gene modulation in mouse epiblast using a Sox2Cre transgenic mouse strain. Mech Dev. 2002;119(Suppl 1):S97–S101. doi: 10.1016/s0925-4773(03)00099-6. [DOI] [PubMed] [Google Scholar]
- Huang YH, Sinha SR, Tanaka K, Rothstein JD, Bergles DE. Astrocyte glutamate transporters regulate metabotropic glutamate receptor-mediated excitation of hippocampal interneurons. J Neurosci. 2004;24:4551–4559. doi: 10.1523/JNEUROSCI.5217-03.2004. [DOI] [PMC free article] [PubMed] [Google Scholar]
- Irizarry RA, Hobbs B, Collin F, Beazer-Barclay YD, Antonellis KJ, Scherf U, Speed TP. Exploration, normalization, and summaries of high density oligonucleotide array probe level data. Biostatistics. 2003;4:249–264. doi: 10.1093/biostatistics/4.2.249. [DOI] [PubMed] [Google Scholar]
- Jabs R, Pivneva T, Hüttmann K, Wyczynski A, Nolte C, Kettenmann H, Steinhäuser C. Synaptic transmission onto hippocampal glial cells with hGFAP promoter activity. J Cell Sci. 2005;118:3791–3803. doi: 10.1242/jcs.02515. [DOI] [PubMed] [Google Scholar]
- Johnston MV, Hoon AH., Jr Cerebral palsy. Neuromolecular Med. 2006;8:435–450. doi: 10.1385/NMM:8:4:435. [DOI] [PubMed] [Google Scholar]
- Kaczmarek LK. Non-conducting functions of voltage-gated ion channels. Nat Rev Neurosci. 2006;7:761–771. doi: 10.1038/nrn1988. [DOI] [PubMed] [Google Scholar]
- Káradóttir R, Cavelier P, Bergersen LH, Attwell D. NMDA receptors are expressed in oligodendrocytes and activated in ischaemia. Nature. 2005;438:1162–1166. doi: 10.1038/nature04302. [DOI] [PMC free article] [PubMed] [Google Scholar]
- Káradóttir R, Hamilton NB, Bakiri Y, Attwell D. Spiking and nonspiking classes of oligodendrocyte precursor glia in CNS white matter. Nat Neurosci. 2008;11:450–456. doi: 10.1038/nn2060. [DOI] [PMC free article] [PubMed] [Google Scholar]
- Krueger M, Bechmann I. CNS pericytes: concepts, misconceptions, and a way out. Glia. 2010;58:1–10. doi: 10.1002/glia.20898. [DOI] [PubMed] [Google Scholar]
- Kukley M, Capetillo-Zarate E, Dietrich D. Vesicular glutamate release from axons in white matter. Nat Neurosci. 2007;10:311–320. doi: 10.1038/nn1850. [DOI] [PubMed] [Google Scholar]
- Levine JM. Increased expression of the NG2 chondroitin-sulfate proteoglycan after brain injury. J Neurosci. 1994;14:4716–4730. doi: 10.1523/JNEUROSCI.14-08-04716.1994. [DOI] [PMC free article] [PubMed] [Google Scholar]
- Lin SC, Bergles DE. Synaptic signaling between GABAergic interneurons and oligodendrocyte precursor cells in the hippocampus. Nat Neurosci. 2004;7:24–32. doi: 10.1038/nn1162. [DOI] [PubMed] [Google Scholar]
- Lin SC, Huck JH, Roberts JD, Macklin WB, Somogyi P, Bergles DE. Climbing fiber innervation of NG2-expressing glia in the mammalian cerebellum. Neuron. 2005;46:773–785. doi: 10.1016/j.neuron.2005.04.025. [DOI] [PubMed] [Google Scholar]
- Mallon BS, Shick HE, Kidd GJ, Macklin WB. Proteolipid promoter activity distinguishes two populations of NG2-positive cells throughout neonatal cortical development. J Neurosci. 2002;22:876–885. doi: 10.1523/JNEUROSCI.22-03-00876.2002. [DOI] [PMC free article] [PubMed] [Google Scholar]
- Mangin JM, Kunze A, Chittajallu R, Gallo V. Satellite NG2 progenitor cells share common glutamatergic inputs with associated interneurons in the mouse dentate gyrus. J Neurosci. 2008;28:7610–7623. doi: 10.1523/JNEUROSCI.1355-08.2008. [DOI] [PMC free article] [PubMed] [Google Scholar]
- Maricich SM, Herrup K. Pax-2 expression defines a subset of GABAergic interneurons and their precursors in the developing murine cerebellum. J Neurobiol. 1999;41:281–294. doi: 10.1002/(sici)1097-4695(19991105)41:2<281::aid-neu10>3.0.co;2-5. [DOI] [PubMed] [Google Scholar]
- Micu I, Jiang Q, Coderre E, Ridsdale A, Zhang L, Woulfe J, Yin X, Trapp BD, McRory JE, Rehak R, Zamponi GW, Wang W, Stys PK. NMDA receptors mediate calcium accumulation in myelin during chemical ischaemia. Nature. 2006;439:988–992. doi: 10.1038/nature04474. [DOI] [PubMed] [Google Scholar]
- Nave KA, Trapp BD. Axon-glial signaling and the glial support of axon function. Annu Rev Neurosci. 2008;31:535–561. doi: 10.1146/annurev.neuro.30.051606.094309. [DOI] [PubMed] [Google Scholar]
- Novak A, Guo C, Yang W, Nagy A, Lobe CG. Z/EG, a double reporter mouse line that expresses enhanced green fluorescent protein upon Cre-mediated excision. Genesis. 2000;28:147–155. [PubMed] [Google Scholar]
- Ono K, Kagawa T, Tsumori T, Yokota S, Yasui Y. Morphological changes and cellular dynamics of oligodendrocyte lineage cells in the developing vertebrate central nervous system. Dev Neurosci. 2001;23:346–355. doi: 10.1159/000048718. [DOI] [PubMed] [Google Scholar]
- Purves D, Augustine GJ, Fitzpatrick D, Katz LC, LaMantia AS, McNamara JO, Williams SM, editors. Neuroscience. Ed 2. Sunderland, MA: Sinauer; 2001. [Google Scholar]
- Regan MR, Huang YH, Kim YS, Dykes-Hoberg MI, Jin L, Watkins AM, Bergles DE, Rothstein JD. Variations in promoter activity reveal a differential expression and physiology of glutamate transporters by glia in the developing and mature CNS. J Neurosci. 2007;27:6607–6619. doi: 10.1523/JNEUROSCI.0790-07.2007. [DOI] [PMC free article] [PubMed] [Google Scholar]
- Reyners H, Gianfelici de Reyners E, Regniers L, Maisin JR. A glial progenitor cell in the cerebral cortex of the adult rat. J Neurocytol. 1986;15:53–61. doi: 10.1007/BF02057904. [DOI] [PubMed] [Google Scholar]
- Riddle A, Luo NL, Manese M, Beardsley DJ, Green L, Rorvik DA, Kelly KA, Barlow CH, Kelly JJ, Hohimer AR, Back SA. Spatial heterogeneity in oligodendrocyte lineage maturation and not cerebral blood flow predicts fetal ovine periventricular white matter injury. J Neurosci. 2006;26:3045–3055. doi: 10.1523/JNEUROSCI.5200-05.2006. [DOI] [PMC free article] [PubMed] [Google Scholar]
- Rivers LE, Young KM, Rizzi M, Jamen F, Psachoulia K, Wade A, Kessaris N, Richardson WD. PDGFRA/NG2 glia generate myelinating oligodendrocytes and piriform projection neurons in adult mice. Nat Neurosci. 2008;12:1392–1401. doi: 10.1038/nn.2220. [DOI] [PMC free article] [PubMed] [Google Scholar]
- Rosenmund C, Stevens CF. Definition of the readily releasable pool of vesicles at hippocampal synapses. Neuron. 1996;16:1197–1207. doi: 10.1016/s0896-6273(00)80146-4. [DOI] [PubMed] [Google Scholar]
- Salter MG, Fern R. NMDA receptors are expressed in developing oligodendrocyte processes and mediate injury. Nature. 2005;438:1167–1171. doi: 10.1038/nature04301. [DOI] [PubMed] [Google Scholar]
- Sontheimer H, Trotter J, Schachner M, Kettenmann H. Channel expression correlates with differentiation stage during the development of oligodendrocytes from their precursor cells in culture. Neuron. 1989;2:1135–1145. doi: 10.1016/0896-6273(89)90180-3. [DOI] [PubMed] [Google Scholar]
- Stevens B, Porta S, Haak LL, Gallo V, Fields RD. Adenosine: a neuron-glial transmitter promoting myelination in the CNS in response to action potentials. Neuron. 2002;36:855–868. doi: 10.1016/s0896-6273(02)01067-x. [DOI] [PMC free article] [PubMed] [Google Scholar]
- Stevens CF, Tsujimoto T. Estimates for the pool size of releasable quanta at a single central synapse and for the time required to refill the pool. Proc Natl Acad Sci U S A. 1995;92:846–849. doi: 10.1073/pnas.92.3.846. [DOI] [PMC free article] [PubMed] [Google Scholar]
- Tekkök SB, Ye Z, Ransom BR. Excitotoxic mechanisms of ischemic injury in myelinated white matter. J Cereb Blood Flow Metab. 2007;27:1540–1552. doi: 10.1038/sj.jcbfm.9600455. [DOI] [PubMed] [Google Scholar]
- Verity AN, Campagnoni AT. Regional expression of myelin protein genes in the developing mouse brain: in situ hybridization studies. J Neurosci Res. 1988;21:238–248. doi: 10.1002/jnr.490210216. [DOI] [PubMed] [Google Scholar]
- Verkhratsky A, Steinhäuser C. Ion channels in glial cells. Brain Res Brain Res Rev. 2000;32:380–412. doi: 10.1016/s0165-0173(99)00093-4. [DOI] [PubMed] [Google Scholar]
- Weisheit G, Gliem M, Endl E, Pfeffer PL, Busslinger M, Schilling K. Postnatal development of the murine cerebellar cortex: formation and early dispersal of basket, stellate and Golgi neurons. Eur J Neurosci. 2006;24:466–478. doi: 10.1111/j.1460-9568.2006.04915.x. [DOI] [PubMed] [Google Scholar]
- Yuan X, Eisen AM, McBain CJ, Gallo V. A role for glutamate and its receptors in the regulation of oligodendrocyte development in cerebellar tissue slices. Development. 1998;125:2901–2914. doi: 10.1242/dev.125.15.2901. [DOI] [PubMed] [Google Scholar]
- Zhou Q, Petersen CC, Nicoll RA. Effects of reduced vesicular filling on synaptic transmission in rat hippocampal neurones. J Physiol 525 Pt. 2000;1:195–206. doi: 10.1111/j.1469-7793.2000.t01-1-00195.x. [DOI] [PMC free article] [PubMed] [Google Scholar]
- Zhu X, Hill RA, Nishiyama A. NG2 cells generate oligodendrocytes and gray matter astrocytes in the spinal cord. Neuron Glia Biol. 2008a;4:19–26. doi: 10.1017/S1740925X09000015. [DOI] [PubMed] [Google Scholar]
- Zhu X, Bergles DE, Nishiyama A. NG2 cells generate both oligodendrocytes and gray matter astrocytes. Development. 2008b;135:145–157. doi: 10.1242/dev.004895. [DOI] [PubMed] [Google Scholar]
- Ziskin JL, Nishiyama A, Rubio M, Fukaya M, Bergles DE. Vesicular release of glutamate from unmyelinated axons in white matter. Nat Neurosci. 2007;10:321–330. doi: 10.1038/nn1854. [DOI] [PMC free article] [PubMed] [Google Scholar]