Abstract
Monitoring gas-phase pollutants is essential to understand exposure patterns and to establish a link between exposure and health. Measurement of the low concentrations found outdoors or in indoor living space normally requires large, expensive instruments that use electrical power. In this study colorimetric, passive diffusion tubes, normally used to monitor high concentrations of airborne contaminants in the workplace for sampling periods of a few hours1, were evaluated to measure much lower concentrations of the same pollutants for periods of up to one week. These tubes are small, inexpensive, and require no electrical power. Responses of diffusion tubes for CO, H2S, NO2, SO2, and benzene were studied. Low pollutant concentrations measured with passive diffusion tubes matched reasonably well with true concentrations for all pollutants except NO2. These results suggest that passive diffusion tubes can provide an inexpensive and unobtrusive yet effective method to monitor low pollutant concentrations. Passive diffusion tubes may be particularly useful in surveys where the spatial variability in concentrations is high and where the cost of traditional monitoring instruments is a concern.
IMPLICATIONS
Passive diffusion tubes are simple, inexpensive devices intended to measure high concentrations of gaseous pollutants in the workplace over a few hours. This study shows that these tubes can also measure much lower concentrations of the same pollutants if exposure time is extended; measurable concentrations are at levels typical for air found outdoors or in households. Passive diffusion tubes can, therefore, be useful for indoor and outdoor air quality studies where the intent is to identify locations or circumstances where average concentrations are particularly low or high, and where high accuracy and precision are not required.
INTRODUCTION
In the workplace, the concentration of airborne contaminants can be relatively high and can vary substantially with location. Concentrations must be measured over a fraction of a work shift that typically lasts for only eight hours. Industrial hygienists must assess worker exposure under these conditions, and this need has led to development of colorimetric, passive diffusion tubes that are now commercially available.
Concentrations of the same contaminants in outdoor or indoor air are also of interest; however, these concentrations are usually much lower than those found in the workplace. Techniques appropriate to measure high concentrations in factory air are often not sensitive enough to measure concentrations found outdoors or in households. For example, the lower limit of detection for passive diffusion tubes is not usually low enough to measure the concentrations found outdoors or in households.
Low pollutant concentrations are often measured using large instruments that require electrical power. The size, initial cost, noise, and requirements for electrical power, calibration, and maintenance for these instruments can be problematic. Many such instruments provide measurements with good time resolution, important if acute effects are of primary concern. Small, inexpensive, and silent passive monitors such as passive diffusion tubes do not require power, calibration, or maintenance and can be an attractive alternative if their lower limit of detection can be reduced. The long-term average concentrations that passive monitors provide are of interest where exposure is associated with chronic, rather than acute effects and where spatial variability in concentrations is more important than temporal variability.
Colorimetric, passive diffusion tubes are commercially available for many gaseous contaminants. These tubes are about the size and shape of a pencil and are made of transparent glass. They contain a chemical that reacts with the airborne species of interest to produce a colored stain. The reaction for each of the tubes used in this study is shown in Table 1. As supplied, the tubes are closed at both ends; to sample, one end of the tube is opened and exposed to the air. This end of the tube contains a diffusion barrier that limits the contaminant sampling rate. As the contaminant diffuses into the tube over time and reacts, a colored stain develops and lengthens. The tube manufacturer prints a series of circular lines on the tube, perpendicular to its axis. These lines are labeled in ppm-hours to correspond with the manufacturer’s calibration. Exposure is determined by matching the length of the stain with the value in ppm-hours for the corresponding line.
Table 1.
The reaction principle for each diffusion tube used in this study2 (Gastec Corp., Kanagawa, Japan).
| Species of Interest | Reaction Principle |
|---|---|
| CO | CO + Na2Pd(SO3)2 → Pd + CO2 + SO2 +Na2SO3 |
| H2S | H2S + Pb(CH3COO)2 → PbS + 2CH3COOH |
| NO2 | NO2 + o-Toluidine → yellow product (unspecified) |
| SO2 | SO2 + BaCl2 + H2O → BaSO3 + 2HCl HCl + Base → Chloride |
| Benzene | Benzene + HCHO → brown product (unspecified) |
The average concentration, Cavg, is then determined by dividing exposure in ppm-hours from the tube by exposure time, T. More formally,
| (1) |
where the reading from the diffusion tube captures the value of the integral in Eq. (1).
The value of this integral can be comparable if the concentration is relatively high over a short time period, or if the concentration is relatively low over a long time period. Passive diffusion tubes calibrated by the manufacturer are intended to measure relatively high concentrations for a sampling period measured in hours. In principle, passive diffusion tubes might also be used to measure much lower concentrations of the same pollutants if exposure time is extended.
The purpose of the work described here was to determine whether colorimetric, passive diffusion tubes developed to measure relatively high concentrations over short periods can also be used to measure lower concentrations over longer sampling times.
The present study investigated the ability of passive diffusion tubes to monitor relatively low concentrations of five pollutant gases: CO, H2S, NO2, SO2, and benzene. Three of these, CO, NO2, and SO2, are EPA criteria pollutants3 and of concern in outdoor air. Benzene is regulated in the workplace in most countries and in the U.S. is regulated as a Hazardous Air Pollutant under the Clean Air Act.4 H2S, which is emitted by industrial processes, the breakdown of organic matter, and human as well as animal waste, can lead to deleterious health effects such as dizziness, fatigue, and loss of memory at low exposures.5 Passive diffusion tubes for these pollutants were selected for study because these pollutants could be present indoors due to indoor sources or infiltration of outdoor air, and because some are a concern in outdoor air as well.
Other kinds of passive samplers have been used to monitor these and other air pollutants both indoors and outdoors. Passive Palmes tubes have been used to monitor NO2.6,7 Ogawa passive samplers, configured as double-faced badges, have been used to monitor urban ozone, the presence of NO2 and SO2 in forested areas, and indoor air.6, 8–11 These passive samplers generally contain a chemically treated filter or substrate that requires post-sample processing by methods such as extraction and analysis by UV-VIS spectrophotometry or ion chromatography.12,13 The colorimetric, passive diffusion tubes studied here do not require post-sample processing.
EXPERIMENTS
A schematic of the experimental set up used to evaluate the response of passive diffusion tubes to low pollutant concentrations is shown in Figure 1. Known contaminant concentrations, CT, were generated in one of two ways. For H2S, NO2, SO2, and benzene, compressed house air, controlled by a regulator (Speedaire model 4Z030B, Grainger Inc., Raleigh, NC), passed through an activated carbon (Alltech Associates Inc., Deerfield, IL) and an absolute filter (Gelman Sciences Inc., Ann Arbor, MI) to a calibrated rotameter (Dwyer Instruments Inc., Michigan City, IN) and into a flask that contained a permeation tube (VICI Metronics, Poulsbo, WA). The permeation tube emitted contaminant into the air at a known mass rate M, determined by weighing it every few days for several months. These measurements were extremely consistent with an R2 of 0.999, 0.999, 0.998, and 0.998 for H2S, NO2, SO2, and benzene respectively. This rate, measured under the same conditions at which experiments were run (T = 22 ± 1.5°C, RH ~ 50%), together with the gas-phase density of the contaminant, ρ, and the volumetric flow rate of air through the flask, Q, determined the true contaminant concentration as given by Eq. (2).
| (2) |
Figure 1.
Schematic of diffusion tube testing set up.
In the case of CO, measured flow from a gas cylinder containing a certified CO concentration (Airgas National Welders, Morrisville, NC) was diluted with a clean air flow. In this case CT was determined by multiplying the CO concentration in the cylinder by the ratio of flow from the cylinder to total flow. Concentration was changed from experiment to experiment by changing the clean air flow through the system. Air with the contaminant at a known concentration then passed into a 0.028 m3 chamber that contained diffusion tubes14 in triplicate for the contaminant of interest (Gastec Corp., Kanagawa, Japan).
Table 2 lists the five contaminants, passive diffusion tubes, and concentrations used in this work. For each contaminant, an experiment was conducted at four different concentrations. In each experiment the length of the colored stain that developed in each of three passive diffusion tubes was read on multiple occasions over a period of one week. The concentrations were selected to span a range that corresponds to values each detector tube should be able to detect for an exposure period of one week, if Eq. (1) holds at low concentrations. In all, 253 measurements of ppm-hours were made.
Table 2.
Experimental conditions investigated. For each contaminant and each concentration, stain length was measured for three diffusion tubes on multiple occasions over one week.
| Contaminant | Gastec Diffusion Tube Model Number |
Concentrations Tested, ppm |
|---|---|---|
| CO | CO 1D | 0.60, 1.55, 4.14, 7.54 |
| H2S | H2S 4D | 0.075, 0.13, 0.25, 0.37 |
| NO2 | NO2 9D | 0.035, 0.045, 0.063, 0.13 |
| SO2 | S02 5D | 0.038, 0.050, 0.15, 0.33 |
| benzene | benzene 122DL | 0.31, 0.89, 1.25, 1.86 |
RESULTS AND DISCUSSION
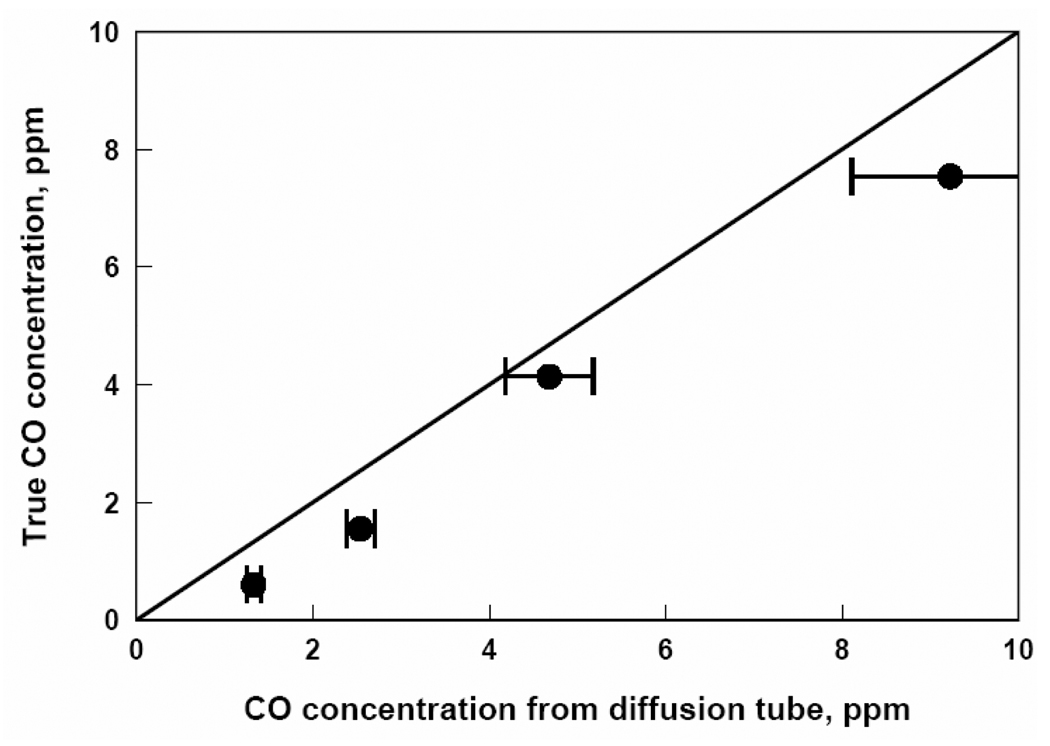
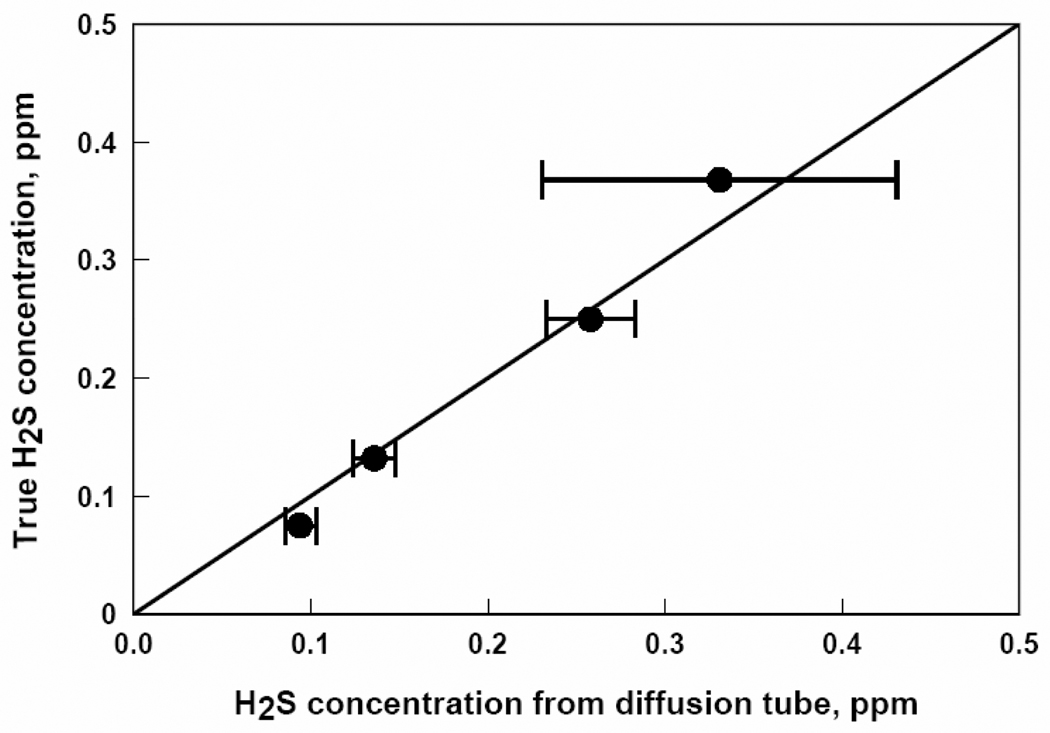
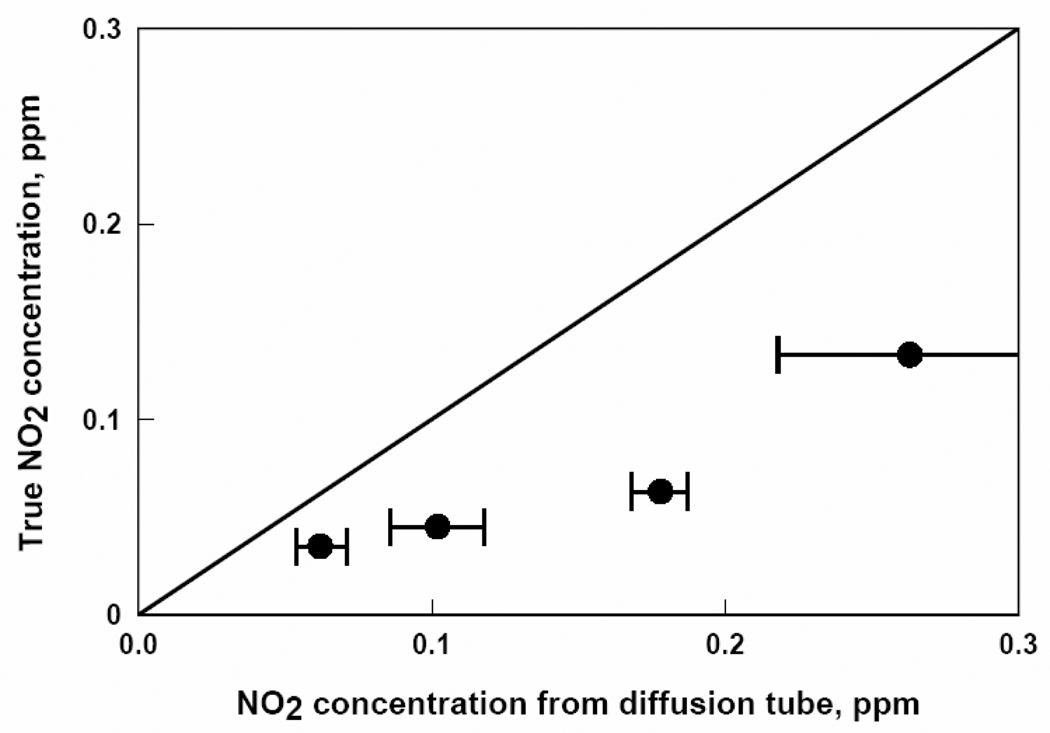
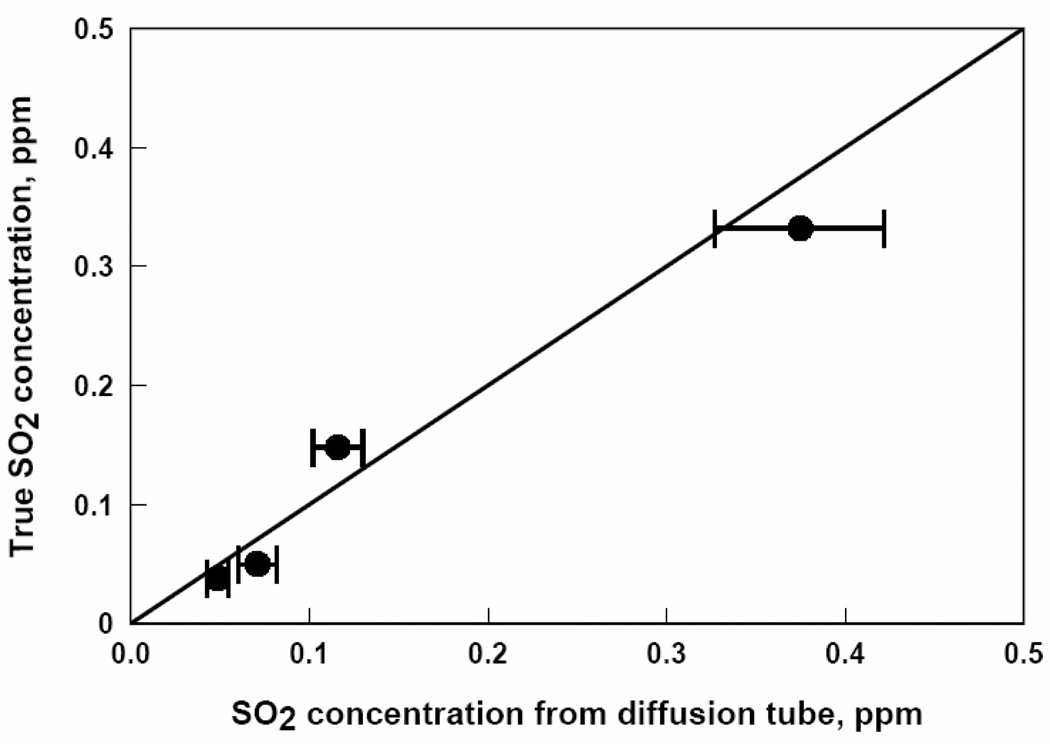
The response of each passive diffusion tube, in ppm-hours, to known contaminant concentrations was divided by its exposure time in hours in accordance with Eq. (1) to determine the average concentration measured by the tube. These data are plotted against true concentrations determined by Eq. (2) for each of the five contaminants in Figures 2, 3, 4, 5, and 6.
Figure 2.
CO concentrations from passive diffusion tubes versus true CO concentrations. Each data point represents a one week exposure to a particular CO concentration.
Figure 3.
H2S concentrations from passive diffusion tubes versus true H2S concentrations. Each data point represents a one week exposure to a particular H2S concentration.
Figure 4.
NO2 concentrations from passive diffusion tubes versus true NO2 concentrations. Each data point represents a one week exposure to a particular NO2 concentration.
Figure 5.
SO2 concentrations from passive diffusion tubes versus true SO2 concentrations. Each data point represents a one week exposure to a particular SO2 concentration.
Figure 6.
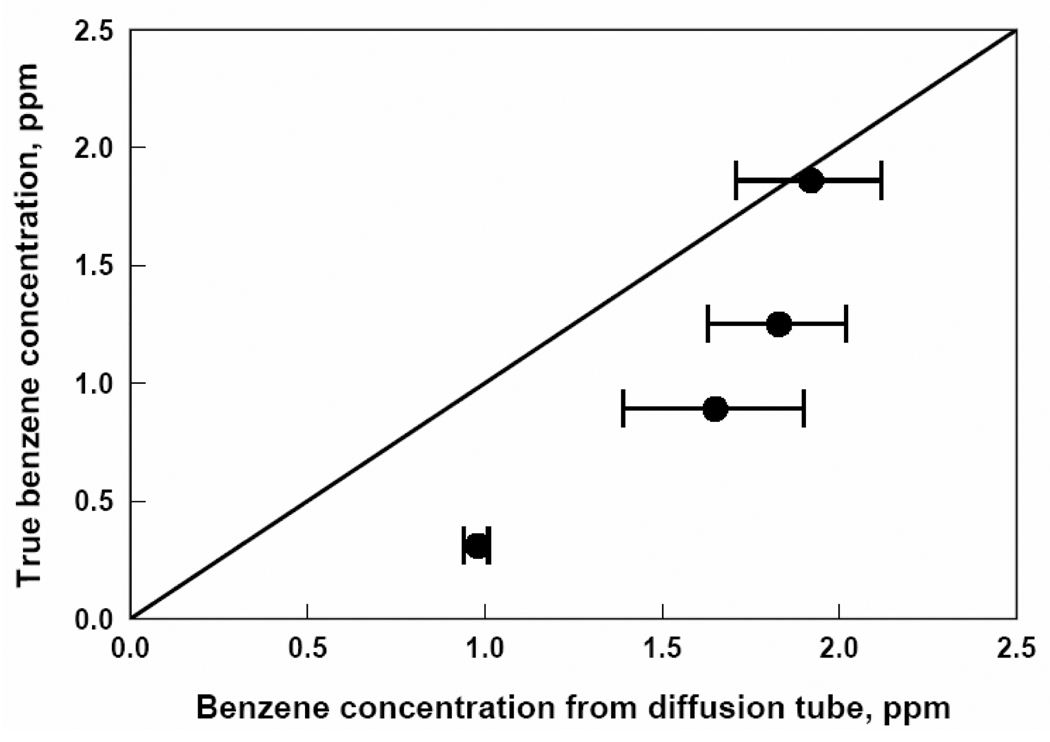
Benzene concentration from passive diffusion tubes versus true benzene concentration. Each data point represents a one week exposure to a particular benzene concentration.
For each contaminant, least squares regression equations were developed to describe the relationship between true concentration, CT, determined using Eq. (2), and the concentration measured using passive diffusion tubes, CM. The effect of exposure time, T, was also included to establish whether exposure time had an independent effect. Equation (3) gives the model investigated, where A , B, and C are the intercept and regression coefficients respectively.
| (3) |
Table 3 lists each coefficient with its ± 95% confidence interval for each regression equation.
Table 3.
Results of regression analysis for relationship between concentrations measured with passive diffusion tubes, CM, and true contaminant concentrations, CT; see Eq. (3).
Concentrations are in ppm and exposure time, T, in hours. Coefficients listed are ± values for 95% confidence intervals. All coefficients are significant at the 95% confidence level (p < 0.05).
| Contaminant | A | B | C | R2 |
|---|---|---|---|---|
| CO | −0.87 ± 0.43 | 0.88 ± 0.05 | 0.0066 ± 0.0049 | 0.96 |
| H2S | −0.022 ± 0.066 | 0.95 ± 0.17 | 0.0005 ± 0.0004 | 0.73 |
| NO2 | 0.036 ± 0.016 | 0.37 ± 0.057 | −0.0002 ± 0.0001 | 0.90 |
| SO2 | 0.055 ± 0.022 | 0.80 ± 0.058 | −0.0004 ± 0.0001 | 0.95 |
| benzene | −0.44 ± 0.43 | 1.08 ± 0.24 | −0.0021 ± 0.0018 | 0.61 |
Table 4 lists, for each compound, the lowest and highest concentrations that can be measured, in principle, using each passive diffusion tube for an exposure time of 168 hours if the manufacturer’s calibrations are correct. These values were determined by dividing the ppm-hour marking for the first and last lines on each passive diffusion tube by 168 hours.
Table 4.
Lowest and highest concentrations that can be measured, in principle, using passive diffusion tubes for an exposure period of 168 hours (one week).
| Contaminant | Lowest value ppm |
Highest value ppm |
|---|---|---|
| CO | 0.3 | 6 |
| H2S | 0.06 | 1.2 |
| NO2 | 0.006 | 0.18 |
| SO2 | 0.01 | 0.60 |
| benzene | 0.12 | 3.0 |
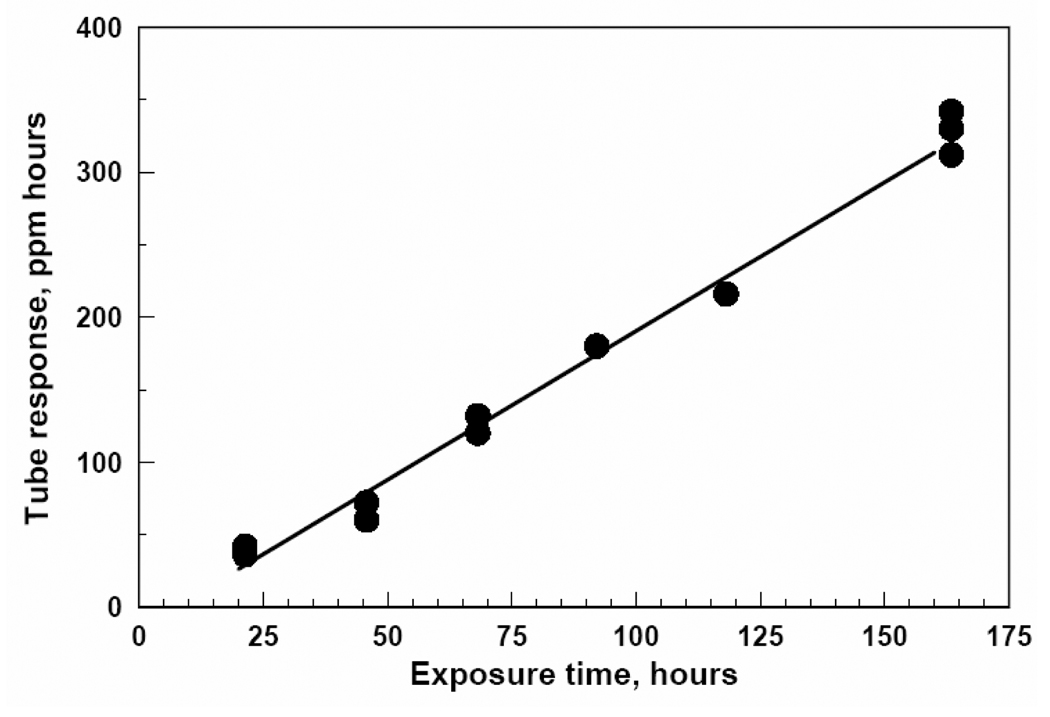
Figure 7 shows the relationship between exposure time and diffusion tube response for the experiment with benzene at a concentration of 1.25 ppm. This figure shows that the three passive diffusion tubes used to monitor benzene at this concentration all responded similarly for each exposure period, and that the response for each tube increased in the same linear way with time. These data suggest low variability in response from tube to tube, and that the manufacturer’s calibration for tube response against cumulative exposure is appropriate. Results were similar for all diffusion tubes and for the five compounds investigated, at all concentrations.
Figure 7.
Response of three passive diffusion tubes for benzene when exposed to a benzene concentration of 1.25 ppm for exposure times up to one week.
Figures 2, 3, 4, 5, and 6 show that the degree of agreement between concentrations measured with the passive diffusion tubes and true concentrations varies with the contaminant measured. In general, concentrations measured with the passive diffusion tubes tended to be higher than the true concentrations, as seen in these plots. This trend can also be seen in the values of regression coefficient B in Table 3, the slope of the correlation line, as all B values were less than unity with the exception of benzene. B values for H2S and benzene were not significantly different than unity as can be seen from their 95% confidence intervals; however, the confidence intervals for these compounds were relatively broad because of variability in the data. B values for CO and SO2 were significantly lower than unity but still reasonably close; their confidence intervals were relatively tight as the data had good reproducibility. The B value for NO2 was also significantly lower and much less than unity; tube response was much more sensitive than suggested by the manufacturer’s calibration.
Table 3 shows that values of the intercept for some of the regression lines, term A in Eq. (3), were significantly different from zero. Table 5 lists the ratio of these intercepts to the minimum and maximum concentrations from Table 4 that can, in principle, be measured using each passive diffusion tube. Table 5 shows that the magnitudes of the intercepts are generally comparable to the lowest concentrations that can potentially be measured, but are less important for higher concentrations. Thus, for concentrations somewhat above the minimums detectable, the correction represented by non-zero intercepts is relatively unimportant.
Table 5.
Ratios of intercept, term A, and maximum time dependent term C, to minimum and maximum concentrations (ppm).
| Contaminant | Term A / | Term C × 168 / | ||
|---|---|---|---|---|
| minimum concentration |
maximum concentration |
minimum concentration |
maximum concentration |
|
| CO | −2.9 | −0.15 | 3.67 | 0.18 |
| H2S | −0.37 | −0.02 | 1.26 | 0.06 |
| NO2 | 5.96 | 0.02 | −6.64 | −0.02 |
| SO2 | 5.49 | 0.09 | −5.92 | −0.10 |
| benzene | −3.64 | −0.15 | −2.9 | −0.12 |
Ideally, passive diffusion tubes would give correct values of measured concentrations regardless of exposure time; however, Table 3 shows that the values for term C in Eq. (3) were significant for all compounds. For the regression model used here, the importance of the time correction term increases with exposure time. This importance can be evaluated by multiplying term C by 168 hours, the maximum exposure time used in these tests, to determine the maximum time correction. The ratio of this value to the minimum and to the maximum concentration potentially measured using each diffusion tube is also given in Table 5. Data in Table 5 show that the maximum time correction term is important when measured concentration is close to the minimum detectable, but relatively unimportant at higher concentrations.
Figure 4 for tests with NO2 shows that concentrations measured with the passive diffusion tubes were substantially higher than true concentrations, a trend also shown by the low value of term B for NO2 in Table 3. Similarly, previous studies15,16 with other types of passive diffusion tubes have shown a 30% overestimation of NO2, attributed to interference from other compounds present in the sampled air. This situation could have occurred in these experiments as well if the permeation device that supplied NO2 to the test chamber also supplied a compound that reacts with the reagent in the passive diffusion tube. If the interfering compound were generated by the permeation device, then the concentration of that compound would change in proportion with the NO2 concentration, and could account for the observed trend in measured concentration with true concentration shown in Figure 4.
Figure 6 shows that detection of benzene was also overestimated, particularly at low concentrations. This finding differs from that in a study by Mukerjee et al. of ambient air near Detroit, MI17 where Perkin Elmer diffusion tubes underestimated rather than overestimated benzene concentrations. The authors attributed this difference to short term spikes observed by the reference method to which the diffusion tube measurements were compared.
CONCLUSIONS
This study has characterized the response of colorimetric, passive diffusion tubes to low concentrations of five gaseous species during one-week exposures. Most diffusion tubes responded linearly to a range of concentrations. Low concentrations measured with passive diffusion tubes for CO, H2S, SO2, and benzene during a sampling period of one week matched true concentrations reasonably well; however, concentrations measured with passive diffusion tubes for NO2 were over twice as high as expected. For all tubes, concentrations measured near the lower detection limit tended to be imprecise unless corrected using intercept and time-dependent terms determined through calibration. One reason for this trend may be that the color change near the lower detection limit tended to be less intense than at the upper limit, introducing potential error in reading the tubes.
These findings suggest that colorimetric, passive diffusion tubes can reasonably be used to measure low concentrations of airborne contaminants during exposure periods of one week. Although results are not as accurate or precise as might be obtained using real-time instruments, results from diffusion tubes can still be of considerable value under circumstances where instrument cost and size, and needs for silence, on-site calibration, and electrical power are concerns. Colorimetric passive diffusion tubes may be particularly useful for surveys of indoor or outdoor air quality in which the intent is to identify locations or circumstances where average concentrations are particularly low or particularly high, and where demands for accuracy and precision are not severe.18
ACKNOWLEDGEMENTS
This research was supported by NIEHS T32 ES7018.
REFERENCES
- 1.McConnaughey PJ, McKee ES, Pritts IM. Passive Colorimetric Dosimeter Tubes for Ammonia, Carbon Monoxide, Carbon Dioxide, Hydrogen Sulfide, Nitrogen Dioxide, and Sulfur Dioxide. Am. Ind. Hyg. Assoc. J. 1985;46(7):357–362. doi: 10.1080/15298668591394978. [DOI] [PubMed] [Google Scholar]
- 2.Gastec Handbook: Environmental Analysis Technology. 8th edn. Kanagawa, Japan: Gastec Corporation; 2008. ed. [Google Scholar]
- 3.U.S. Environmental Protection Agency. http://www.epa.gov/air/urbanair/ [PubMed]
- 4.Wallace LA. Major Sources of Benzene Exposure. Env. Health Persp. 1998;82:165–169. doi: 10.1289/ehp.8982165. [DOI] [PMC free article] [PubMed] [Google Scholar]
- 5.Woodall GM, Jr, Smith RL, Granville GC. Proceedings of the Hydrogen Sulfide Health Research and Risk Assessment Symposium, October 31-November 2, 2000. Inhal. Toxicol. 2005;17:593–639. doi: 10.1080/08958370591000618. [DOI] [PubMed] [Google Scholar]
- 6.Cox RM. The use of passive sampling to monitor forest exposures to O3, NO2, and SO2: a review and some case studies. Environmental Pollution. 2003;126:301–311. doi: 10.1016/s0269-7491(03)00243-4. [DOI] [PubMed] [Google Scholar]
- 7.Chang HY, Morandi MT, Weisel CP. Passive dosimeters for nitrogen dioxide in personal/indoor air sampling: A review. J. Expos. Anal. Environ. Epidemiol. 2008;18:441–451. doi: 10.1038/jes.2008.22. [DOI] [PMC free article] [PubMed] [Google Scholar]
- 8.Varns JL, Mulik JD, Sather ME, Glen G, Smith L, Stallings C. Passive ozone network of Dallas: a modeling opportunity with community involvement. 1. Environ. Sci. Technol. 2001;35(5):845–855. doi: 10.1021/es001311c. [DOI] [PubMed] [Google Scholar]
- 9.Zipprich JL, Harris SA, Fox JC, Borzelleca JF. An analysis of factors that influence personal exposure to nitrogen oxides in residents of Richmond, Virginia. J. Expos. Anal. Environ. Epidemiol. 2002;12:273–285. doi: 10.1038/sj.jea.7500226. [DOI] [PubMed] [Google Scholar]
- 10.Van Roosbroeck S, Wichmann J, Jansenn NAH, Hoek G, van Wijnen JH, Lebret E, Brunekreef B. Long-term personal exposure to traffic-related air pollution among school children, a validation study. Sci. Total Environ. 2006;368:565–573. doi: 10.1016/j.scitotenv.2006.03.034. [DOI] [PubMed] [Google Scholar]
- 11.Karthikeyan S, Perumal S, Balasubramanian R, Zuraimi M, Tham K. Determination of ozone in outdoor and indoor environments using nitrite-impregnated passive samplers followed by ion chromatography. J. Air & Waste Manage. Assoc. 2007;57:974–980. doi: 10.3155/1047-3289.57.8.974. [DOI] [PubMed] [Google Scholar]
- 12.Gibson MD, Guernsey JR, Beauchamp S, Waugh D, Heal MR, Brook JR, Maher R, Gagnon GA, McPherson JP, Bryden B, Gould R, Terashima M. Quantifying the spatial and temporal variation of ground-level ozone in the rural Annapolis Valley, Nova Scotia, Canada using nitrite-impregnated passive samplers. J. Air & Waste Manage. Assoc. 2009;59:310–320. doi: 10.3155/1047-3289.59.3.310. [DOI] [PubMed] [Google Scholar]
- 13.Lee K, Parkhurst WJ, Xue J, Ozkaynak AH, Neuberg D, Spengler JD. Outdoor/indoor/personal ozone exposures of children in Nashville, Tennessee. J. Air & Waste Manage. Assoc. 2004;54:352–359. doi: 10.1080/10473289.2004.10470904. [DOI] [PubMed] [Google Scholar]
- 14.Ferm M. Proceeding from International Conference Measuring Air Pollutants by Diffusive Sampling; Montpellier, France: 2001. [Google Scholar]
- 15.Plaisance H, Piechocki-Minguy A, Garcia-Fouque S, Galloo JC. Influences of meteorological factors on the NO2 measurements by passive diffusion tube. Atmos. Environ. 2004;38:573–580. [Google Scholar]
- 16.Kirby C, Fox M, Waterhouse J, Drye T. Influence of environmental parameters on the accuracy of nitrogen dioxide passive diffusion tubes for ambient measurement. J. Environ. Monit. 2001;3:150–158. doi: 10.1039/b007839p. [DOI] [PubMed] [Google Scholar]
- 17.Mukerjee S, Oliver KD, Seila RL, Jacumin HH, Jr, Croghan C, Daughtrey EH, Jr, Neas LM, Smith LA. Field comparison of passive samplers with reference monitors for ambient volatile organic compounds and nitrogen dioxide under week-long integrals. J. Environ. Monit. 2009;11:220–227. doi: 10.1039/b809588d. [DOI] [PubMed] [Google Scholar]
- 18.Franklin AC, Salmon LG, Wolfson JM, Christoforou CS. Ozone measurements in South Carolina using passive samplers. J. Air & Waste Manage. Assoc. 2004;54:1312–1320. doi: 10.1080/10473289.2004.10470997. [DOI] [PubMed] [Google Scholar]


