Abstract
We are investigating the utility of a new ultrasonic tissue characterization technique, specifically two-dimensional (2-D) spectrum analysis of radio-frequency backscatter signals, which promises to provide quantitative measures of the physical properties of tissue microstructures. Previously successful 1-D spectrum analysis is expanded to 2-D to more fully characterize diagnostically significant features of biological tissue. Two new spectral functions, radially integrated spectral power (RISP) and angularly integrated spectral power (AISP), are defined to quantitatively characterize tissue properties. This new approach is applied to the diagnosis of in vivo ocular melanomas. Our initial results indicate that 2-D spectrum analysis can provide significant new information on tissue anisotropy that are not apparent in 1-D spectra. Acoustic scattering models are applied to relate the 2-D spectral parameters to the physical properties (e.g., size and shape) of biological tissues.
Keywords: ultrasonic tissue characterization, spectrum analysis, spectral parameter, ocular tumor
I. INTRODUCTION
Ultrasound imaging is a commonly used diagnostic modality in medicine. Conventional ultrasound images (B-mode images), however, are qualitative or semi-quantitative. This paper describes an improved ultrasonic tissue characterization technique (UTC), specifically two-dimensional (2-D) spectrum analysis of the ultrasonic radio-frequency (rf) echo signals, that provides quantitative measures of the physical properties of tissue microstructures.
In conventional ultrasound imaging, B-mode images are generated by taking the amplitude of the envelope of the radio-frequency (rf) echo signals received at the ultrasound probe. This process does not retain the phase information of the rf signals. Our UTC technique utilizes both the amplitude and phase information of the ultrasound signals. The major emphasis is placed on characterizing tissues by the frequency dependence of the subwavelength (hence subresolution) backscattering.
It should come as no surprise that the frequency dependence of the backscattering spectrum could reveal the characteristics of subwavelength scatterers. Rayleigh, for example, has shown that subwavelength isotropic scatterers give rise to a scattering intensity proportional to the fourth power of the frequency. In the 1970s, frequency characteristics were analyzed digitally or by applying rf echo signals to analog spectrum analyzers.1,2 Many ultrasonic tissue characterization methods employing 1-D spectrum analysis have been developed for quantitative assessment of tissue microstructures.3–6
One of these procedures matured into a local spectrum analysis that computes the calibrated 1-D power spectrum of the digitized rf signals from a demarcated region-of-interest (ROI) in examined tissues.7 The theoretical interpretation of this procedure, based on wave propagation in a random medium, was given in the early 1980s.8,9 Its clinical applications proliferated in the 1990s to a number of diseases in the eye,10–12 liver,13 breast,14 and prostate.15,16
This paper follows this line of inquiry and extends the ROI spectrum method from the well-established 1-D analysis to two dimensions in an attempt to address more realistic tissue scatter morphology and orientation. The 2-D spectrum analysis method could represent a substantial improvement in terms of gathering more diagnostically significant features regarding tissue microstructures.
We have conducted an initial study that demonstrated the feasibility of employing 2-D spectrum technique to clinical rf data from human intraocular melanomas. The clinical objective is to detect the spaces (channels) formed between conglomerates of tumor cells that are reported to be associated with increased lethality potential in melanomas.17,18 These spaces, usually with flows in them, are encapsulated with extracellular matrix (mainly laminin).
The rest of the paper is organized as follows. We will first describe the 2-D spectrum method including the data acquisition system and the analysis procedure. Then we show an sapplication of the UTC technique in ocular tumor diagnosis. It demonstrates that the 2-D technique can offer quantitative measures of subresolution tissue microstructures in terms of their physical properties.
II. TWO-DIMENSIONAL SPECTRUM ANALYSIS
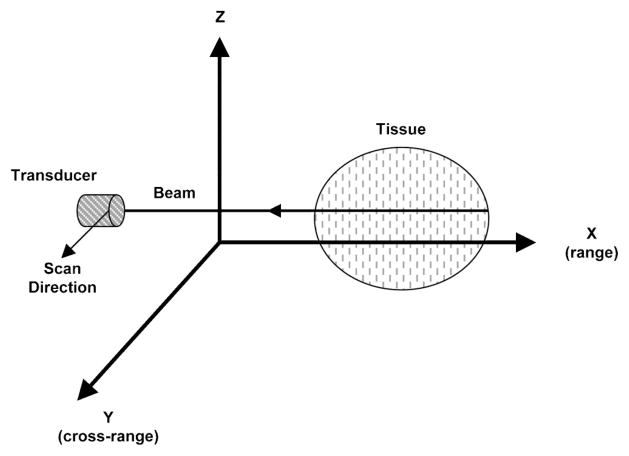
Figure 1 illustrates the configuration for ultrasonic imaging. In 1-D spectrum analysis, rf echo data undergo Fourier transformation only with respect to range (X, along beam direction). In 2-D spectrum analysis, rf data selected from 2-D regions undergo Fourier transform in the range (X) and cross-range (Y, scan direction). The resulting 2-D spectrum S2D(k, μ) is specified in terms of temporal frequency k and spatial frequency μ. Data acquisition and processing are performed using a computer system with hardware interface and software modules.
Fig. 1.
Configuration of ultrasonic scanning of biological tissue.
A. Data acquisition
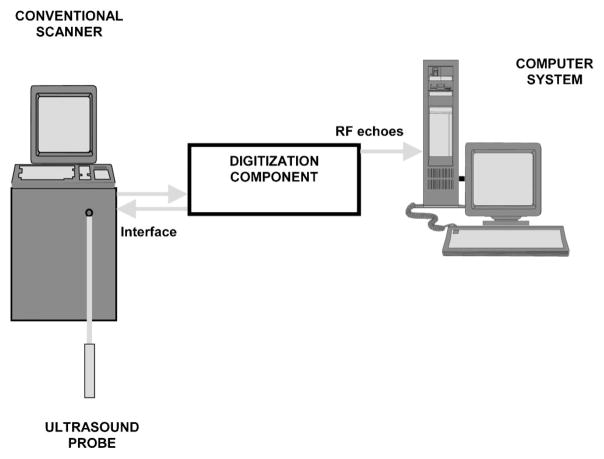
Ultrasonic radio-frequency data acquisition is performed in the course of standard clinical scanning. The data acquisition system has been developed for digitization of rf echo signals received at the clinical ultrasound probe (transducer), as described in the previous reports.9,10 Here they are briefly summarized. Figure 2 shows a diagram of the ultrasonic data acquisition system. It has three main components: a clinical ultrasound scanner, a digitization component, and a computer.
Fig. 2.
Diagram of the ultrasonic scanning system.
The digitization component contains an electronic interface unit and an analog-to-digital (A/D) converter. It acquires the unprocessed rf signals, preferably after linear amplification of the electrical signal from the probe. The idea is to avoid any information loss due to the signal processing steps within the scanner. In medical ultrasound imaging the rf signals are high-frequency signals usually between 3 and 20 MHz.
For spectral computations along range and cross-range directions, the sampling frequencies are chosen to be higher than the Nyquist frequencies to assure adequate sampling. Along the range direction, the data sampling rate is selected to be higher than double the highest usable frequency of the probe (transducer). Along the cross-range direction, the scan line distance is selected to be smaller than the half beam-width. For a typically 10 MHz transducer with 1 cm diameter and 5 cm focal length, the −3 dB beam-width is 0.9 mm.
Acquired data is transferred to a PC for processing. The data acquisition system generates rf data files in a standard format and also displays B-mode images derived from the acquired data.
B. Spectrum analysis procedures
Ultrasonic tissue characterization using 2-D spectrum analysis involved a sequence of operations applied to the digitized rf signals, shown in Fig. 3, summarized as the following:
Fig. 3.
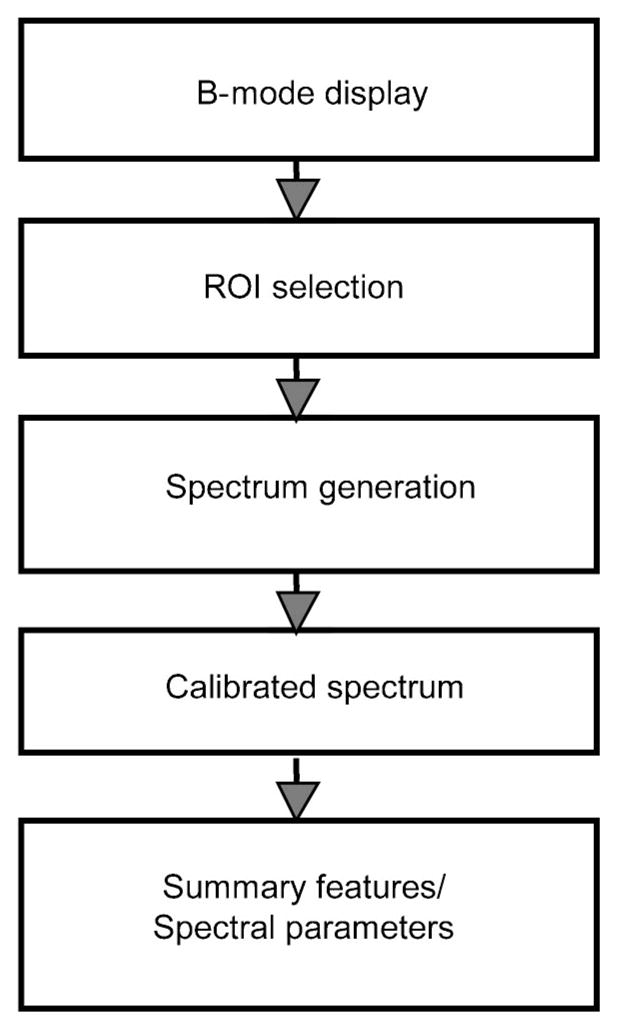
Diagram showing 2-D spectrum analysis procedure.
Step 1: (B-mode display) 2-D spectrum analysis begins with a digital computation of B-mode images from stored rf echo signals captured from each scan plane. This involves rectification and smoothing of rf data to produce video signal display in a spatial pattern corresponding to the scan pattern.
Step 2: (ROI selection) A rectangular region-of-interest (ROI) is positioned and superimposed on the B-mode image. The ROI specifies the region where rf signals (not envelope) will be analyzed, and it is placed within the focal zone of the transducer. The ROI sizes along beam and scan directions are LX and LY, respectively. Spectral resolutions improve as ROI sizes increase. In practice, these sizes may be limited by the actual tissue dimensions. Large value of LX can also lead to significant attenuation within the examined segment.
Step 3: (Spectrum generation) The rf echo signals within the ROI are weighted along the range and cross-range by Hamming functions, zero padded to 1024 points, and then analyzed by a 2-D FFT algorithm. The advantage of a Hamming window is that the resulting Fourier transform has very low spectral side lobes. The resulting 2D spectrum S2D(k, μ) is specified as a function of two spatial frequencies k and μ. The spatial frequency k pertains to the range direction, k = 2πf/c, where f is the temporal frequency and c is the speed of ultrasound propagation in the medium. The spatial frequency μ pertains to cross-range direction. Magnitudes of the 2-D spectrum are squared to obtain a single realization of the 2-D power spectrum. True 2-D power spectra are computed by averaging several such realizations. Since the rf data are real, the power spectrum has the following symmetry:19
In this study, we only plot 2-D power spectra for k>0 and we treat single realizations of a 2-D power spectrum.
Step 4: (Calibrated spectrum) A calibration procedure is performed to remove the effects of the transducer and system electronic modules. The same experimental system and setting is used, except that the scanning target for calibration is an optically flat glass plate placed in the focal plane of the transducer. The angle of the glass plate was adjusted so that the incident beam is normal to the glass plate surface. The calibration spectrum is determined from a 1-D Fourier transform of the echo received from the glass plate surface.8–10 For example, in our ocular study we computed the calibration spectrum using 50 sample points and then averaged over ten scan lines. The calibration power spectrum is subtracted from 2-D tissue spectrum along the range direction to compensate for the temporal-frequency transfer function of the beam and receiver.
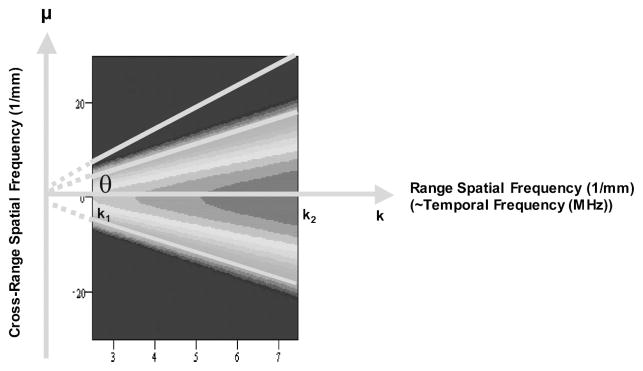
Step 5: (Feature extraction) Two spectral functions, radially integrated spectral power (RISP) and angularly integrated spectral power (AISP), are computed from the 2D power spectrum (in dB), . RISP is defined as an integration of spectral power (in dB) along each radial line in the 2-D spectra as a function of its angle θ measured from the k-axis. The integration extends over the transducer’s bandwidth, as illustrated in Fig. 4. The expression for the RISP is
| (1) |
| (2) |
Fig. 4.
Definition of radially integrated spectral power (RISP).
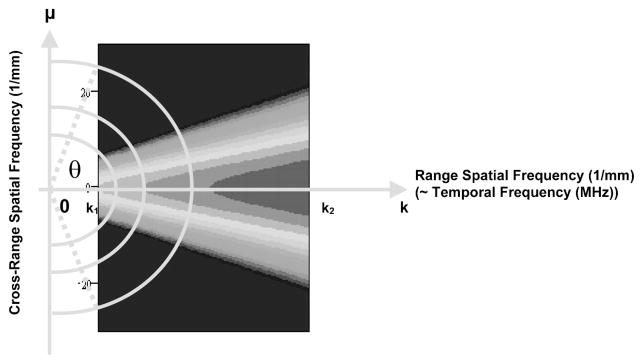
where k1 and k2 are the minimum and maximum spatial frequencies in the bandwidth; θ specifies the angle of the line of integration. Physically, RISP is the distribution of spectral power density for each radial line in the frequency space. AISP is defined as an integration of spectral power ~in dB! over an arc at a specific spatial frequency, as shown in Fig. 5. AISP measures the spectral power distribution on each arc in the frequency space. The arc is the part of a circle of fixed frequency, K, within the frequency range of interest. The expression for AISP is
| (3) |
| (4) |
Fig. 5.
Definition of angularly integrated spectral power (AISP).
where θ1 and θ2 are the minimum and maximum angles within the frequency range of interest; K specifies the frequency of the arc. Four spectral parameters are computed to express the spectra in a summary fashion. They are the peak value and 3 dB width of RISP and the slope and intercept of AISP. These parameters are used to quantitatively estimate the physical properties of the scatterers in tissue.
III. CLINICAL APPLICATION
A. Background
In ophthalmology, 1-D ultrasonic spectrum analysis has been successfully applied to identify tumors in the posterior section of the eye.9,10 These studies employed focused transducers with center frequencies of 10 MHz. Clinical database studies showed that ocular tumors could be classified using 1-D spectral parameters. The studies employed the slope and intercept of a linear regression of the 1-D spectral curve, under the assumption that all the microstructures (scatterers) inside ocular tumors are spherical (isotropic). One-dimensional spectral parameters were able to distinguish among different types of intraocular tumors (metastatic carcinomas and malignant melanomas) and to differentiate between subclasses of melanomas.11,12
A preliminary clinical study has been performed to examine the feasibility of applying 2-D power spectra to ocular tumor characterization. Ultimately we are interested in whether 2-D spectrum analysis can differentiate benign tumors from malignant ones. As 2-D spectrum analysis is thought to provide more information than 1-D analysis, we are particularly interested in knowing whether 2-D analysis could enable us to identify the micro-spaces or channels inside ocular tumors that have been associated with increased lethality. These spaces form between conglomerates of tumor cells that are encapsulated with extracellular matrix (mainly laminin). There are flows in these channels; although possibly not whole blood, perhaps it works like a sort of lymphatic system. They are not seen with Doppler ultrasound because of their small lumens, very low velocities, and low back-scattering level. The encapsulated cell conglomerates are 50–120 microns in diameter, but the spaces (channels) formed between them are maybe 10 microns across.18 These classification capabilities are clinically important because biopsies can not be conducted within the eye and because these tumors may require different treatments, ranging from continued observation to enucleation (surgical removal of the globe).
B. Subjects and data acquisition
In this initial study, two human intraocular tumors have been examined using a 2-D power spectrum method. These in vivo clinical data are provided by the Department of Ophthalmology of Cornell Medical Center. They are part of a separate study of “the clinical detection of prognostically significant histologic features in human uveal melanoma using 1-D ultrasonic spectrum analysis.” Ten MHz ultrasound rf echo data were acquired prior to enucleation in eyes with untreated malignant melanomas.
A Sonovision STT-100 ophthalmic diagnostic ultrasound unit (Sonocare, Saddle River, NJ) equipped with a broadband 10 MHz sector scan probe and a 50 MHz 8 bit A/D converter was used to acquire rf ultrasonic echo data. The scan line separation at the tumor is about 160 μm. The transducer had an aperture diameter of 6 mm and focal length of 25 mm. The transducer nominal frequency is 10 MHz.
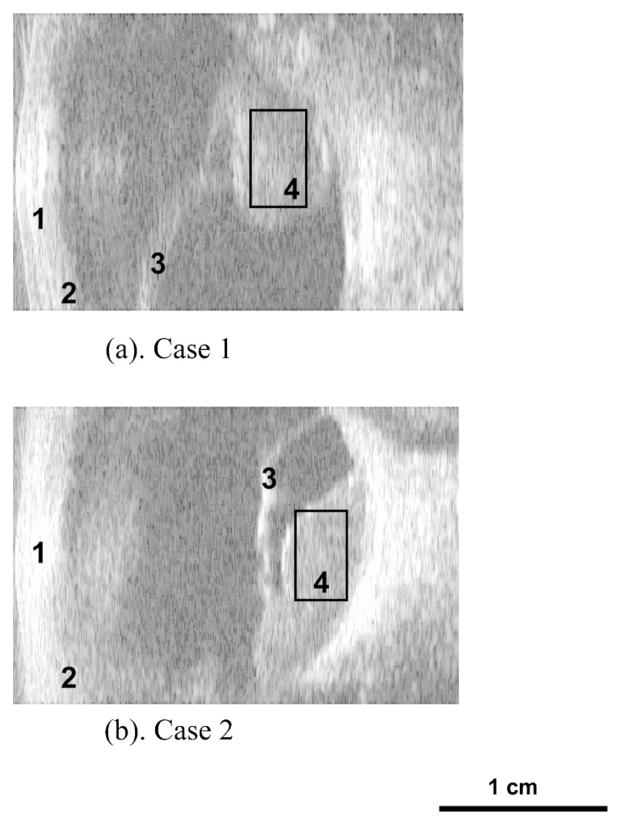
Figure 6 shows the B-mode images of the two posterior ocular melanomas, termed case 1 and case 2. The front of the eye faces the left side of each image. Each scan has an ocular tumor located at the back of the eye where the ROI’s located. Each scan is 31 mm (2048 sample points) along the range direction and 22 mm (128 scan lines) along the cross range from these conventional B-mode images.
Fig. 6.
B-mode images of the eye showing the cornea (1), ciliary body (2), detached retina (3) and ROI inside intraocular melanoma (4): (a) case 1 and (b) case 2.
C. Histology
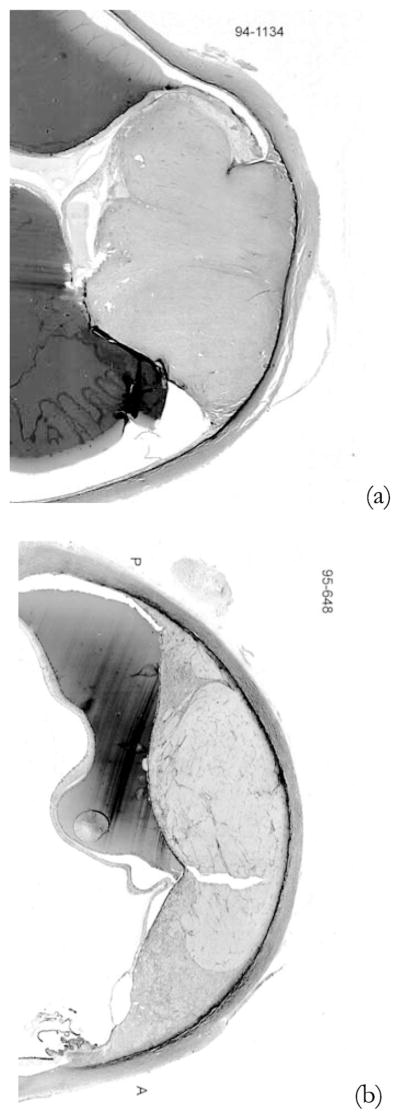
For these two intraocular melanomas, definitive tumor types were obtained from histological examinations subsequent to enucleations that have been previously scheduled. The histology classification for case 1 [Fig. 7(a)] was spindle B melanoma. Case 2 [Fig. 7(b)] was classified as a melanoma with mixed epitheliod cells with spindle B cells. Another pathology finding is that there are extracellular matrix patterns presented in case 2, but not in case 1.
Fig. 7.
Pathology images: (a) case 1 and (b) case 2.
A general understanding of the specific ocular tumors will be useful in later interpretation of the 2-D spectral analysis results. Malignant melanomas of the uveal tract are classified according to their cell type (Callender, 1931). The Callender classification includes the following histopathologic types listed in the order of increasing malignancy: spindle A, spindle B, fascisular, necrotic, epitheliod, and spindle cells. The five-year mortality rate is 14% for spindle B and 51% for mixed cell types.20 In this study, tumor case 1 (spindle B) is less aggressive than tumor case 2 (mixed network).
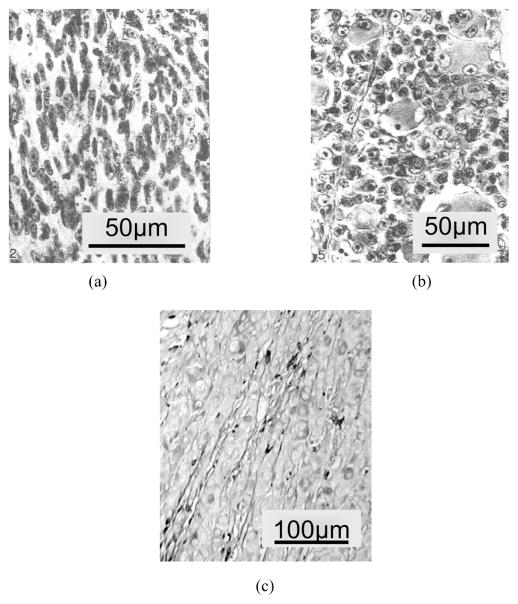
The spindle B cells are spindle-shaped with larger nuclei and contain a more prominent nucleolus, as shown in Fig. 8(a). The epithelioid cells are irregularly polygonal and vary greatly in size and shape, as shown in Fig. 8(b). Figure 8(c) shows the extracelluar matrix inside malignant melanomas, which is reported to be related to the lethality of the intraocular tumors.18
Fig. 8.
(a) Malignant melanoma of choroid: spindle cell, subtype B. (b) Malignant melanoma of choroid: epitheloid cell type. (c) Extracellular matrix patterns in malignant melanoma.
D. Results
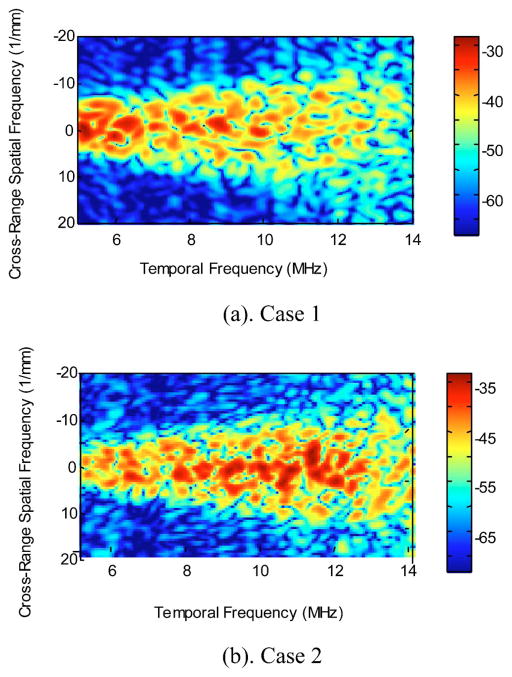
The 2-D power spectra of ocular tumor case 1 and case 2, S2D(k, μ), are presented in Fig. 9. The temporal frequency range is 5 to 14 MHz. This is chosen to assure a high signal-to-noise ratio. The cross-range spatial frequencies are ranging from −20 to 20 mm−1. In this study, all spectra are unaveraged (single realizations) 2-D spectra. As shown in Fig. 6, the ROI for case 1 has dimensions of 4.5 mm (range) by 7.5 mm (cross-range). The ROI for case 2 is 4 mm (range) by 7 mm (cross-range).
Fig. 9.
Two-dimensional power spectra of ocular tumor cases 1 and 2.
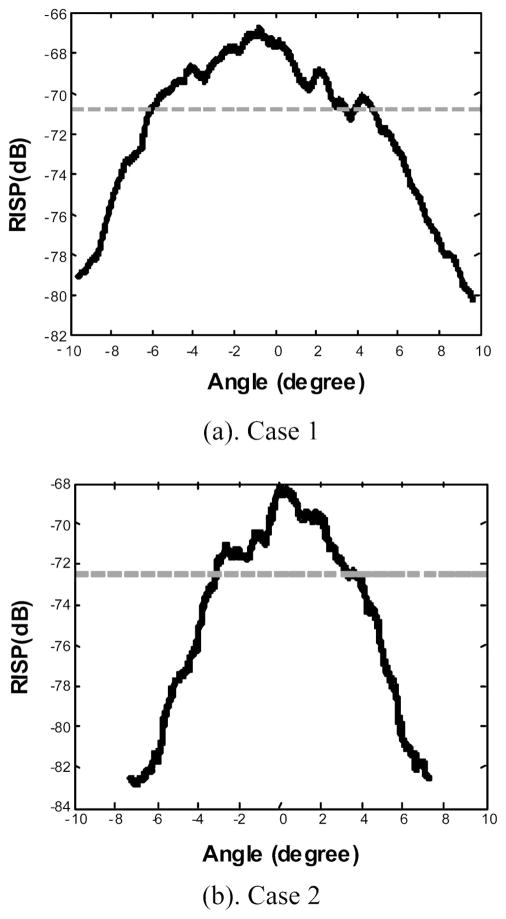
Figure 10 shows the RISP curves for cases 1 and 2, where the solid lines are the RISP curves and the dotted horizontal lines are 3 dB below the peak amplitude of the RISP. In comparison with case 1, the 2-D power spectrum of case 2 is confined to a narrower region centered along the temporal frequency axis, as indicated in the RISP curves. For cases 1 and 2, the 3-dB widths of the RISP are 10.2° and 6.5°, respectively. The peak values of RISP are −67.7 and −70.7 dB.
Fig. 10.
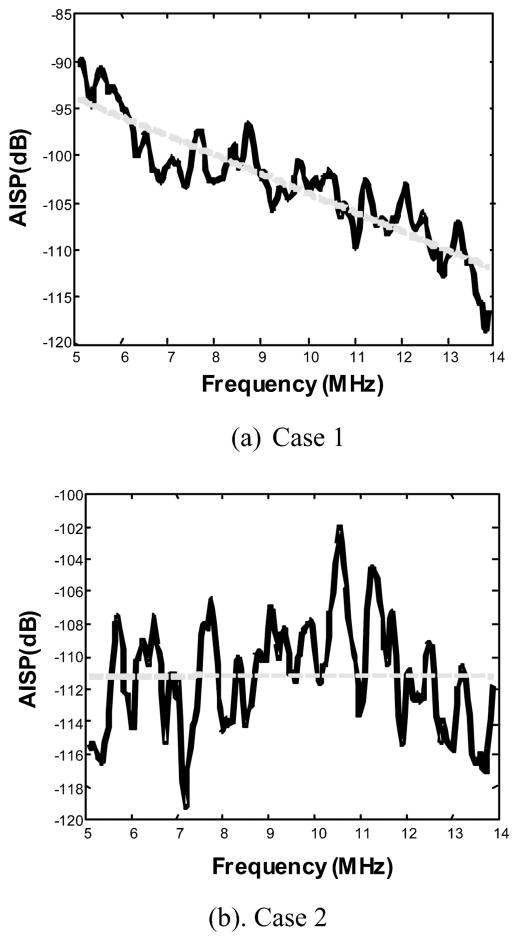
RISP curves for ocular tumor (a) case 1 and (b) case 2.
Figure 11 shows the AISP plots (solid lines) with linear regressions (dotted lines). The 2-D power spectrum of case 2 has more power in higher frequencies than that of case 1. The slopes of the linear fit of the AISPs for the two cases are −2.02 and 0.01 dB/MHz. The intercepts of the linear fit of the AISPs are −83.7 and −108.9 dB.
Fig. 11.
AISP curves with linear fits (dotted lines) for ocular tumor (a) case 1 and (b) case 2.
The 2-D spectral parameters for the two intraocular tumors are summarized in Table I. It is apparent that there are significant 2-D spectral differences between the two tumors.
Table I.
Comparison of spectral parameters for the two ocular tumors.
| Ocular tumor case 1 | Ocular tumor case 2 | |
|---|---|---|
| RISP peak value (dB) | −67.7 | −70.7 |
| RISP 3-dB width (degree) | 10.2 | 6.5 |
| AISP slope (dB/MHz) | −2.02 | 0.01 |
| AISP intercept (dB) | −83.7 | −108.9 |
E. Discussion
In this clinical study, a 2-D spectrum analysis method has been applied to ocular tumor study in vivo. Significant differences of the spectral parameters of the two cases have been observed. This study suggests that 2-D spectral parameters may be sensitive for factors that differentiate benign from malignant human ocular tumors.
The 3-dB width of RISP is determined by the transducer parameters, bandwidth, and the scatterer size along the scan direction. The derivation of this relationship is based on a stochastic tissue model with 3-D Gausian auto-correlation function for acoustic impedance fluctuation. The details of the derivation can be found in Refs. 21 and 22. Here we are primarily concerned with its implications in tissue characterization. For case 1, the −3 dB width of the RISP is 10.2°, which corresponds to a size of 200 μm along the cross-range (scan) direction. For case 2, the −3 dB width of the RISP is 6.5° and the scatterer size along the cross-range direction is about 650 μm. The scatterer sizes along the range direction for cases 1 and 2 are approximately 100 and 40 μm, which are calculated numerically using the estimated size along cross-range direction together from our theoretical model.21
For case 1, a spindle B melanoma, the scatterer sizes inside the tumor along the range and cross-range directions are estimated to be 100 and 200 μm. This suggests relatively small microstructures with a slight degree of anisotropy. This is consistent with the histological finding. For case 2, mixed (epithelioid and spindle cell B) melanoma, the scatterer sizes along range and cross-range directions are estimated to be 40 and 650 μm, indicative of the high degree of anisotropy. The elongated scatterer sizes are consistent with the extracellular matrix patterns (spaces or channels) that are associated with increased lethality potential in melanomas.18
These ocular tumor results are encouraging in that they have demonstrated that the 2-D power spectrum method could be applied to realistic clinical situations. Of course, definitive conclusions can not be based on two cases, but the results should motivate larger studies to investigate the use of 2-D spectra for differential diagnosis. It is interesting to point out that typical clinical ultrasound scanners digitize rf echo data in both the range and scan directions, hence the 2-D power spectrum method is readily applicable with minimum additional requirements.
In this paper, we treat single realization of 2-D power spectra. The precision of 2-D spectral estimates can be improved to obtain smaller variance by averaging independent power spectra from nonoverlapping regions of space. The spectral functions, RISP and AISP, are line integrations, which bring in averaging over the raw 2-D spectra in frequency domain. Through theoretical simulation and phantom study, they are found to be statistically reliable.22
The basic premise is that backscattering has spectral signatures representative of the physical properties of the soft tissues, and that disease processes alter the physical properties of the tissue. There are fundamentally two parts in ultrasonic tissue typing. First one needs to develop a procedure to quantify the physical properties of soft tissues from the acoustic scattering spectrum, which is noninvasive. The second part involves clinical studies that build a knowledge base to relate the physical (in this case, acoustic) properties to the physiology of the soft tissues. Definitive biopsy results are usually involved in this step. The goal is that with a database from limited but focused clinical examinations, tissue typing for disease screening and treatment monitoring can be done noninvasively for significant populations.
IV. CONCLUSION
We have outlined the ultrasonic tissue characterization method using 2-D spectrum analysis of the rf echo signals. It offers unique capabilities for quantitative characterization of subresolution tissue microstructures in terms of their physical properties (e.g., size, shape, concentration, and acoustic impedance), which are not available in conventional medical ultrasound imaging. Because of its sensitivity to microstructure features, the 2-D frequency domain technique holds great promise for noninvasive disease detection, functional-imaging guided radiotherapy, and treatment monitoring. Future studies in this area of research could incorporate the current results to aim at a more fundamental understanding of pulse/echo propagation in soft tissues, and developing extensive clinical databases that correlate the 2-D spectral parameters to the physiology of the tissue microstructures in various organs.
Acknowledgments
This research was supported in part by Grant Nos. EY01212 and EB00238 awarded by the National Institutes of Health.
Contributor Information
Tian Liu, Department of Radiation Oncology, Columbia University, New York, New York 10032.
Frederic L. Lizzi, Biomedical Engineering Laboratories, Riverside Research Institute, New York, New York 10038.
Ronald H. Silverman, Department of Ophthalmology, Weill Medical College of Cornell University, New York, New York 10021.
Gerald J. Kutcher, Department of Radiation Oncology, Columbia University, New York, New York 10032.
References
- 1.Namery J, Lele PP. Ultrasonic detection of myocardial infarction in dog. Proc. of the IEEE Ultrasonics Symposium, Institute of Electrical and Electronics Engineers; 1972. pp. 491–494. [Google Scholar]
- 2.Lizzi FL, St Louis L, Coleman DJ. Applications of spectral analysis in medical ultrasonography. Ultrasonics. 1976;14(2):77–80. doi: 10.1016/0041-624x(76)90103-7. [DOI] [PubMed] [Google Scholar]
- 3.Shung KK, Thieme GA, editors. Ultrasonic Scattering in Biological Tissues. CRC; Boca Raton, FL; 1993. [Google Scholar]
- 4.Insana MF, Hall TJ. Characterising the microstructure of random media using ultrasound. Phys Med Biol. 1990;35(10):1373–1386. doi: 10.1088/0031-9155/35/10/003. [DOI] [PubMed] [Google Scholar]
- 5.Zagzebski JA, Lu ZF, Yao LX. Quantitative ultrasound imaging: in vivo results in normal liver. Ultrason Imaging. 1993;15(4):335–351. doi: 10.1177/016173469301500405. [DOI] [PubMed] [Google Scholar]
- 6.Mottley JG, Miller JG. Anisotropy of the ultrasound backscatter of mayocardial tissue. I. Theory and measurement in vitro. J Acoust Soc Am. 1988;83:755–765. doi: 10.1121/1.396118. [DOI] [PubMed] [Google Scholar]
- 7.Lizzi FL, Laviola MA. Power spectra measurements of ultrasonic backscatter from ocular tissue. Proc. of the IEEE Ultrasonics Symposium 1975; Institute of Electrical and Electronics Engineers; 1975. pp. 29–32. [Google Scholar]
- 8.Lizzi FL, Greenebaum M, Feleppa EJ, Elbaum M, Coleman DJ. Theoretical framework for spectrum analysis in ultrasonic tissue characterization. J Acoust Soc Am. 1983;73:1366–1373. doi: 10.1121/1.389241. [DOI] [PubMed] [Google Scholar]
- 9.Lizzi FL, Feleppa EJ, Coleman DJ. Ultrasonic ocular tissue characterization. In: Greenleaf JF, editor. Characterization of Tissue with Ultrasound. CRC; Boca Raton, FL: 1986. pp. 41–60. [Google Scholar]
- 10.Feleppa EJ, Lizzi FL, Coleman DJ. Ultrasonic analysis for ocular tumor characterization and therapy assessment. News Physiol Sci. 1988;3:193–197. [Google Scholar]
- 11.Coleman DJ, Silverman RH, Rondeau MJ, Lizzi FL, McLean IW, Jackobiec FL. Correlation of acoustic tissue typing of malignant melanoma ad histopathlogic feature as a predictor of death. Am J Ophthalmol. 1990;110:380–388. doi: 10.1016/s0002-9394(14)77018-7. [DOI] [PubMed] [Google Scholar]
- 12.Coleman DJ, Silverman RH, Rondeau MJ, Coleman JA, Rosberger D, Ellsworth RM, Lizzi FL. Ultrasonic tissue characterization of uveal melanoma and prediction of patient survival after enucleation and brachytherapy. Am J Ophthalmol. 1991;112:682–688. doi: 10.1016/s0002-9394(14)77275-7. [DOI] [PubMed] [Google Scholar]
- 13.King DL, Lizzi FL, Feleppa EJ, Wai PM, Yaremko MM, Rorke MC, Herbst J. Focal and diffuse liver disease studied by quantitative microstructural sonography. Radiology. 1985;155:457–462. doi: 10.1148/radiology.155.2.2984720. [DOI] [PubMed] [Google Scholar]
- 14.Alam SK, Lizzi FL, Feleppa EJ, Liu T, Kalisz A. In: Insana M, Walker WF, editors. Computer-aided diagnosis of breast lesions using multifeature analysis procedure; Medical Imaging and Signal Processing 2002, Proceedings of Society of Photo-Optical Instrumentation Engineers; Bellingham. 2002. pp. 296–303. [Google Scholar]
- 15.Feleppa EJ, Fair WR, Kalisz A, Sokil-Melgar JB, Lizzi FL, Rosada A, Shao MC, Liu T, Wang Y, Cookson M, Reuter V. Typing of prostate tissue by ultrasonic spectrum analysis. IEEE Trans Ultrason Ferroelectr Freq Control. 1996;43(4):609–619. [Google Scholar]
- 16.Feleppa EJ, Liu T, Kalisz A, Shao MC, Fair WR, Fleshner N, Reuter V. Ultrasonic spectral-parameter imaging of the prostate. Int J Imaging Syst Technol. 1997;8:11–25. [Google Scholar]
- 17.Silverman RH, Folberg R, Boldt HC. Correlation of ultrasound parameter imaging with microcirculatory patterns in uveal melanomas. Ultrasound Med Biol. 1997;23:573–581. doi: 10.1016/s0301-5629(97)00037-9. [DOI] [PubMed] [Google Scholar]
- 18.Silverman RH, Folberg R, Rondeau MJ, Boldt HC, Lloyd HO, Chen X, Lizzi FL, Weingeist TA, Coleman DJ. Spectral parameter imaging for detection of prognostically significant histologic features in uveal melanoma. Ultrsound Med Biol. doi: 10.1016/s0301-5629(03)00907-4. (in press) [DOI] [PubMed] [Google Scholar]
- 19.Press WH, Teukolsky SA, Vetterling WT, Flannery BP. Numerical Recipes in C. Cambridge University Press; New York: 1992. pp. 521–525. [Google Scholar]
- 20.Hogan MJ, Zimmerman LE, editors. Ophthalmic Pathology at Atlas and Textbook. Saunders; Philadelphia, PA: 1962. [Google Scholar]
- 21.Liu T. Ph.D. thesis. Department of Applied Physics, Columbia University; 2002. Ultrasonic tissue characterization using 2-D spectrum analysis. [Google Scholar]
- 22.Liu T, Lizzi FL, Ketterling JA, Paul L, Kalisz A, Silverman RH, Kutcher GJ. In: Insana M, Walker WF, editors. Relationship of 2-D ultrasonic spectral parameters to the physical properties of soft tissue scatterers; Medical Imaging and Signal Processing 2004, Proceedings of Society of Photo-Optical Instrumentation Engineers; in press. [Google Scholar]


