

Abstract
Extracellular superoxide dismutase (EC-SOD) plays an important role in maintaining normal redox homeostasis in the lung. It is expressed at very high levels in pulmonary fibroblasts, alveolar type II epithelial cells and smooth muscle cells. The molecular mechanism(s) governing this cell-specific expression of EC-SOD are mostly unknown. In our previous studies we showed that EC-SOD cell specific expression was not attributed to differential transcriptional regulation, suggesting that other, possibly epigenetic, mechanisms are involved in regulation of its expression. In this paper, we found high levels of promoter methylation in A549 cells and correspondingly low levels of methylation in MRC5 cells. Inhibition of DNA methyltransferase activity by 5-azacytidine in A549 cells reactivated EC-SOD transcription (2.75±0.16 fold, p<0.001) demonstrating the importance of methylation in repression of EC-SOD expression. Furthermore, methylation of cytosines in the promoter markedly decreased Sp1/Sp3 driven promoter activity to 30.09±2.85% (p<0.001) compare to unmethylated promoter. This attenuation of transcription in the promoter-reporter construct was, at least in part, attributed to the binding of methyl-binding protein MeCP2 in the insect cells. However, no binding of MeCP2 or MBD2 proteins to EC-SOD promoter was detected in mammalian cells in vivo. We also found marked differences in the chromatin organization of the EC-SOD promoter between these two cell lines, further supporting the important role epigenetic modifications play in the regulation of EC-SOD expression.
Keywords: reactive oxygen species, transcription, epigenetic regulation, DNA methylation, methyl-binding proteins, lung, chromatin organization
Introduction
Superoxide dismutases (CuZn-SOD, Mn-SOD and EC-SOD) represent a major defense against oxidative stress in mammalian organisms and a deficiency in these enzymes may cause a variety of diseases [1, 2]. Extracellular superoxide dismutase (EC-SOD) is the least studied enzyme but recent data supports an important role for EC-SOD in maintaining oxidative homeostasis within extracellular matrix elements and in other extracellular spaces. The EC-SOD enzyme undergoes glycosylation in the Golgi apparatus, followed by proteolytic processing by a furin protease, and secretion into the extracellular milieu were it exists either in solution or bound to extracellular matrix components such as collagen via its C-terminal heparin binding domain [3]. It is believed that a high local concentration of EC-SOD surrounds extracellular matrix elements and cell surfaces, which in turn helps to protect against oxidative stress by lowering superoxide radical levels.
Expression of EC-SOD has been localized to specific cells and tissues with the highest expression occurring in lung, heart, kidney and vasculature. Embryonic deletion of the EC-SOD gene in mice does not produce any obvious pathologies under normal conditions but these mice are more prone to environmental stressors such as hyperoxia [4, 5], radiation [6], or pulmonary fibrogenic chemicals [7, 8]. However, the acute reduction of EC-SOD levels in adult mice by using Cre-Lox technology results in up to 85% mortality due to the development of respiratory distress syndrome [9]. Thus, EC-SOD is essential for survival in the presence of ambient oxygen and acute loss of only 50% of this enzyme can lead to severe lung damage. In this regard, it is important to determine the molecular mechanisms that govern expression of EC-SOD in pulmonary cells. Recently, we discovered that basal and inducible transcription of the murine EC-SOD gene is regulated, at least in part, by proximal and distal promoter elements where Sp1/Sp3 transcription factors interact with the former [10] and Ets, Kruppel and MZF-1 transcription factors interact with the latter [11]. The basal expression of human EC-SOD in pulmonary cells is also regulated by Sp1/Sp3 transcription factors that binds to the new identified proximal promoter [12]. Nevertheless, the mechanism of cell specific EC-SOD expression in the lung remains to be elucidated.
Methylation of cytosines within CpG sites is a major form of DNA modifications in mammals. CpG sites are distributed in mammalian genome at an average frequency of 1 CpG site per 100 bp, but in promoters and 5’-flanking regions they occur at considerably higher frequency (~1 CpG/10 bp). These high density CpG islands remain mostly unmethylated and often are associated with transcriptionally active genes. It has been shown that DNA methylation plays an important role in the regulation of gene expression, genomic imprinting, mammalian development, inactivation of the X chromosome and carcinogenesis [13]. The transcriptional activity of enhancers and promoters often inversely correlates with the methylation status of critical CpG sites. Several biologically relevant mechanisms exist that explain how methylation of CpG sites reduces transcription. Methyl groups of CpG sites can directly interfere with binding of transcription factors to their recognition cis-elements or, on the other side, can facilitate interaction with a family of methyl-binding proteins. Upon binding to methylated DNA, these proteins can mask binding sites for transcription factors or recruit chromatin modifying enzymes to silence particular DNA loci [14]. It has been suggested that the methylation status of the 5’-flanking region of the rabbit EC-SOD gene may be responsible for enhanced expression of EC-SOD enzyme in the early stages of atherogenic vascular lesions [15, 16].
In this study, we have identified that pulmonary cell-specific expression of EC-SOD can be attributed to differential methylation of its promoter. Demethylation of the promoter, by 5-azacytidine, reactivates transcription of the EC-SOD gene in non-expressing A549 cells in vivo and methylation of the promoter, in vitro, significantly reduces promoter/reporter activity. In addition, the nucleosomal organization of EC-SOD promoter in A549 and MRC5 cells showed striking differences, pointing out to the importance of epigenetic factors in regulation of cell specific EC-SOD gene expression.
Material and Methods
Reagents
Oligonucleotides were obtained from Integrated DNA Technologies. Anti- anti-Sp3 (sc-644X) IgG were purchased from Santa Cruz Biotechnology (Santa Cruz, CA). Anti-RNA Polymerase II IgG (clone CTD4H8), MeCP2 and MBD2 were purchased from Millipore (Billerica, MA). All other chemicals and enzymes were from Boehringer Mannheim (Indianapolis, IN), Sigma Chemical Co. (St. Louis, MO), or Gibco BRL (Gaithersburg, MD).
Cell Culture and Transfections
MRC-5 (human embryonic lung fibroblast), A549 (human lung epithelial), and Hep3B (human hepatocellular carcinoma) cell lines were obtained from ATCC (Manassas, VA). Hep3B cells were cultured in MEM medium supplemented with non-essential amino acids and 10% fetal bovine serum (FBS). A549 cells were cultured in Ham’s F12K Nutrient Mixture (Kaighn’s modification) with 2 mM L-glutamine and 10% FBS. MRC-5 cells were cultured in Eagle’s Minimal Essential medium with Earle’s BSS and 2 mM L-glutamine supplemented with 10% FBS. Cells were maintained at 37 °C and 5% CO2 in a humidified incubator.
Transfection assays were carried out using Lipofectamine reagent (Invitrogen, Carlsbad, CA). Briefly, A549 and MRC5 cells were seeded at 90% confluence on 24 wells plates, incubated overnight before transfection, and then treated with Lipofectamine for 5 hours according to the manufacturer’s protocol. Twenty four hours after transfection, cell extracts were assayed for luciferase activity using a Dual-Luciferase Reporter Assay System (Promega, Madison USA) according to the manufacturer’s instructions. All experiments were performed at least in triplicate, and the data was normalized to Renilla luciferase to control for differences in transfection efficiency by co-transfecting pRL-CMV plasmid (Promega, Madison USA).
Drosophila SL2 cells were maintained in Schneider’s medium supplemented with 10% heat-inactivated fetal bovine serum at 23 °C in air. One day prior to transfection, SL2 cells were seeded in 24 well plates at 7.8 × 10⁵ cells per well. Cells were transfected with indicated plasmids using Lipofectamine reagent (Invitrogen, Carlsbad, CA). Cell extracts were prepared 24 hrs after transfection and promoter activities were determined with Luciferase Assay System (Promega, Madison, USA) and normalized to protein concentration in lysates.
Reverse transcriptase (RT)-PCR
Total RNA was prepared from the cultured cells using Trizol reagent (Invitrogen, Carlsbad, CA). The synthesis of single stranded DNA from RNA was performed using SuperScript First-Strand Synthesis System for RT-PCR and random hexamers (Invitrogen, Carlsbad, CA), according to the protocol provided by manufacturer. The levels of mRNA-derived cDNA for a specific gene were quantified using the following gene specific primers: EC-SOD (forward 5’-TGC CCC GCG TCT TCA G -3’ and reverse 5’-CCA AAC ATT CCC CCA AAG G -3’); GSTP1 (forward 5’-GGG CAG TGC CTT CAC ATA GT-3’ and reverse 5’-GGA GAC CTC ACC CTG TAC CA -3’); TRAG3 (forward 5’-GCT GGC CTG CCT TCA CTG TC -3’ and reverse 5’-CAC CCT GTT GGC TAT TTA TCT GG-3’); MeCP2 (forward 5’-ACT CCC CAG AAT ACA CCT TGC TT-3’) and reverse 5’-TGA GGC CCT GGA GGT CCT-3’); CyPB (forward 5’-CCA ACG CAG GCA AAG ACA CCA A -3’) and reverse 5’-GCT CTC CAC CTT CCG CAC CA-3’); GAPDH (forward 5’-CAT GGA CTG TGG TCA TGA GT -3’ and reverse 5’-CCA TGT TCG TCA TGG GTG TGA -3’). After amplification, PCR products were separated on a 1.2% agarose gel and visualized using ethidium bromide and UV-light.
Quantitative RT-PCR
To quantitate amplified signals from EC-SOD 5’-flanking region and promoter in A549 and MRC5 cells, the quantitative PCR was undertaken using the iCycler iQ™ Real-Time PCR Detection System (Bio-Rad, Hercules, CA) and a iQ SYBR® Green Master Mix. The PCR cycles were 95 °C for 3 min, then 40 cycles of 95 °C for 15 s, 60 °C for 1 min. The primers were designed to amplify ~100 bp per primer pair. The specificity of amplification for each pair was confirmed by separation of amplified fragments by agarose electrophoresis and by performing melting curve analysis. PCR assays were run in triplicate.
Plasmids
The human EC-SOD gene’s 5’-flanking sequences were generated as described previously [12]
McrBC Digestion
The genomic DNA from various cell lines was prepared using a DNeasy Tissue kit (Qiagen, Chatsworth, CA) according to the manufacturer’s protocol. 200 ng of genomic DNA were cleaved with McrBC (New England Biolabs, Beverly, MA) in final reaction volume of 50 μl at 37 °C for 3 h. The cleaved genomic DNA was purified using QIAquick PCR Purification kit (Qiagen, Chatsworth, CA) and eluted in 50 ul of water. One microliter was used as template for PCR using corresponding primers.
Bisulfate Genomic Sequencing to analyze methylation pattern of CpG sites within EC-SOD promoter
Genomic DNA was isolated from A549, MRC5 and Hep3B cells using DNeasyTM Kit (Qiagen, Chatsworth, CA). Bisulfite modification of genomic DNA was carried by CpGenome DNA modification kit (Intergen, Purchase, NY) according to the manufacture’s protocol. An aliquot of the bisulfate treated DNA (25-50 ng) was subjected to 35 cycles of PCR amplification. PCR primers for amplification of EC-SOD promoter were designed for the sodium bisulfite modified template using MethPrimer software [17]. PCR primers were following (forward primer 5’-AAT TTA AAA ATG GGA GGG GTA GAG -3’ and reverse primer 5’-AAA AAA CTT TCT CTC CTA AAA AAA A -3’). The PCR fragments were subcloned using the TA cloning kit (Invitrogen, Carlsbad, CA) and at least 10 individual plasmid clones were sequenced.
Methylation of Promoter/Reporter Constructs
The EC-SOD promoter/reporter construct pGL3-hSOD3(-1106/+45) was in vitro methylated by methylases M. Hpa II (CmCGG) and M. SssI (mCG) according to a protocol provided by the manufacturer (NEB, Beverly, MA). The methylation status of the constructs was verified by digestion with the methylation sensitive restrictase Hpa II. Mock methylation reactions did not contain any methylases. To analyze the effect of promoter methylation on its activity without interference of reporter gene methylation, methylated or unmethylated -1106/+45 EC-SOD 5’-flanking regions were ligated into unmethylated pGL3-Basic vector at Bgl II and Kpn I restriction sites. The ligation efficiency was analyzed using agarose gel electrophoresis. Ligated plasmids were purified using QIAquick PCR Purification kit (Qiagen, Chatsworth, CA) and directly transfected into cells without further propagation in bacteria.
Treatment with 5-azacytidine and/or TSA
MRC5, Hep3B and A549 cells were treated with indicated concentrations of 5-azacytidine, 1.5 μM TSA or DMSO for 4 days. Media and 5-azacytidine were replaced every 24 hours.
Chromatin Immunoprecipitation
The chromatin immunoprecipitation was performed using EZ-Magna ChIP G Chromatin immunoprecipitation Kit (Millipore, Billerica, MA). Briefly, A549 cells were treated with DMSO or 1 μM 5-aza-dC for 4 days. The protein-DNA complexes were cross-linked using formaldehyde. The genomic DNA of lysed cells was shared using sonicator to achieve an estimated DNA size range from 150 bp to 600 bp. The final lysate was incubated with normal, RNA Polymerase II, Sp3, MeCP2 and MBD2-specific antibodies and precipitated with Protein G-magnetic beads. After extensive washing DNA-protein complexes were reverse-crosslinked and eluted in in 50 ul of TE buffer. The abundance of EC-SOD, GAPDH and C/EBP promoter regions in ChIP precipitates were quantified using PCR and specific primers: EC-SOD primers were forward (5’- GGC CTG CTT TTC CTC CCT GA -3’) and reverse (5’- CAG CCA GCC CAG GAA CGC AG -3’) and amplified region from -140 to -12 bp relative to the transcription initiation start site; GAPDH primers were forward (5’-TAC TAG CGG TTT TAC GGG CG-3’) and reverse (5’-TCG AAC AGG AGG AGC AGA GAG CGA-3’), C/EBP primers were forward (5’-TAA GGC CAC TGT CGG TGA AG-3’) and reverse (5’-GAG CCC TCA AGT GTC TCC TG-3’). Products of PCR amplification were separated on 1.2 % agarose gel and visualized using ethidium bromide and UV-light. The intensity of corresponding bands was quantified using ImageJ software.
PCR based nucleosomal mapping
A549 and MRC5 cells were grown to 90% confluency, washed with ice cold PBS, scraped and resuspended in 10x packed cell volumes of Buffer A 10 mM Tris-HCl (pH 7.5), 50 mM KCl, 3 mM MgCl2, 1 mM CaCl2) with 0.2% NP-40 and incubated on ice for 10 min for swelling. Cells were washed three times with Buffer A w/o NP-40 and resuspended. For rapid evaluation of DNA concentration, an aliquot of nuclei was lysed in 10-20 volumes of 2 M NaCl, and then DNA was shared by vigorous vortexing. The UV absorption of the solution at 230, 260 and 280 nm was read against a 2M NaCl and DNA concentration was estimated. Nuclei (200 ug of DNA) were treated with 200 units of Nuclease S7 for 8 min at 37 °C to produce mononucleosomal fragments. Nuclei were treated with proteinase K, and DNA was purified using phenol:chloroform. The digestion was analyzed on 1.2% agarose gel. In order to analyze the extent to which different parts of the EC-SOD promoter region was digested by S7 nuclease, we used quantitative PCR as described above. PCR assays were run in triplicate and the relative abundance of EC-SOD promoter regions were estimated from the threshold amplification cycle numbers Ct using software supplied with iCycler IQ™. The differences between Ct values obtained from A549 and MRC5 cells were plotted against corresponding primers pairs that amplified small, overlapping sequences within 5’-flanking region of EC-SOD gene (primer sequences used in this assay are available upon request).
Transfection of A549 cells with siRNAs
ON-TARGETplus SMARTpool siRNA specific for MeCP2 and cyclophilin B (CyPB) were purchased from Thermo Scientific Dharmacon. ON-TARGETplus Non-targeting pool siRNAs were used as negative control. A549 cells were transfected with siRNAs using DharmaFECT1 (Thermo Scientific Dharmacon) according the protocol provided by manufacturer. Total RNA was isolated 48 hours after transfection and gene-specific expression was analyzed using quantitative RT-PCR.
Data analysis
All values are mean ±SD of data from n independent experiments, as indicated in the figure legends. The statistical significance of differences was determined by one-way or two-way ANOVA as appropriate, using the Bonferroni test as a multitude comparison method. A P value of <0.05 was taken to indicate a statistically significant difference.
Results
EC-SD Promoter is Differentially Methylated in A549 and MRC5 cells
Based on previous studies, we concluded that differences in expression of EC-SOD in A549 and MRC5 cells can not be attributed entirely to transcriptional regulators alone. Thus, we decided to investigate whether epigenetic factors, such as methylation of DNA in the promoter region, could be responsible for differential expression of EC-SOD in these cell lines. For this purpose we purified genomic DNA from A549 and MRC5 cells and digested it with methylation-requiring nuclease McrBC. Subsequent PCR amplification of the EC-SOD promoter region from -729 to +51 showed that MRC5 genomic DNA is more resistant to McrBC cleavage compared to A549 implying that the 5’-flanking region of the human EC-SOD gene is methylated to a higher degree in A549 vs. MRC5 cells. (Figure 1, A-B). In order to further delineate the methylated regions in A549 cells, we amplified genomic DNA with primer pairs that span shorter DNA sequences. Only primer pairs 2 and 5 amplified less prominent bands from McrBC treated A549 genomic DNA (Figure 1B). We focused our attention on the region amplified with primer pair 5 because it spans exon 1 which contains the transcription initiation start sites and the proximal promoter.
Figure 1. Methylation status of CpG sites within 5’-flanking region of EC-SOD gene.
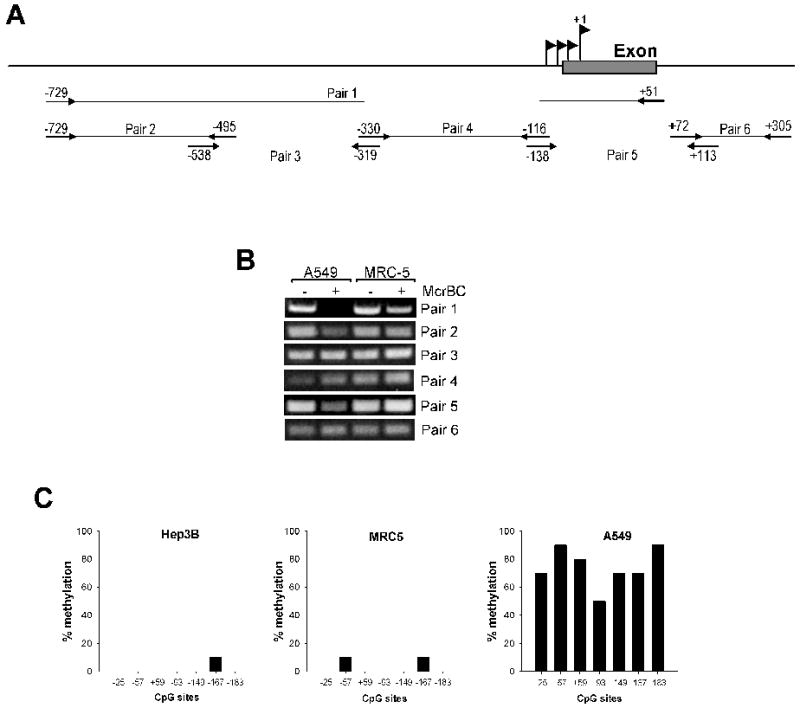
A, Schematic representation of primers used for amplification of EC-SOD 5’-flanking region in McrBC based assay. B, genomic DNA from A549 and MRC5 was purified and digested with McrBC methylation sensitive nuclease. The integrity of DNA was analyzed using primers pairs (depicted in panel A) that amplify different region of EC-SOD promoter. Amplified products were separated on 1.2% agarose gel and visualized using ethidium bromide under UV light. C, sodium bisulfite sequencing of the EC-SOD promoter. Genomic DNA from Hep3B, A549 and MRC5 cells was isolated, bisulfite-treated and amplified by PCR using primers targeting EC-SOD promoter region. The amplified sequences were subjected to DNA sequence analysis as described under “Material and Methods”. At least 10 individual clones were sequenced for each cell type.
To analyze methylation status of individual CpG sites in region from -222 to +26 we used a genomic bisulfite sequencing method. In A549 cells approximately 70% to 90% of all CpG sites within EC-SOD promoter were methylated (Figure 1C). In MRC5 and Hep3B cells that express EC-SOD at relatively high levels, a limited number of CpG sites were methylated at a very low frequency (10% of CpG sites at positions -57 and -167 were methylated in MRC5 cells and 10% of cytosines at position -167 were methylated in Hep3B cells) (Figure 1C).
Methylation of EC-SOD Promoter Attenuated Promoter/Reporter Activity in A549 cells
Since the EC-SOD promoter was highly methylated in A549 cells, we decided to check if DNA methylation affects the activity of pGL3-hSOD3(-1106/+45) promoter-reporter construct. We methylated the promoter using Sss I methylase (which methylates mCG sites) or Hpa II methylase (which methylates CmCGG sites), then ligated this construct into pGL3-Basic unmethylated vector and transfected into A549 cells without any additional propagation in bacterial cells. The extent of methylation was detected by digestion of methylated and unmethylated DNA with methylation sensitive restrictase Hpa II. Sss I and Hpa II methylated DNA showed full protection against digestion with Hpa II (data not shown). Methylation of EC-SOD 5’-flanking region decreased promoter/reporter activity by approximately 70% when transfected into A549 cells (Figure 2A). The construct which was methylated at three CCGG sites with Hpa II showed no significant reduction in activity.
Figure 2. Effect of promoter methylation/demethylation on EC-SOD gene transcription in vivo.
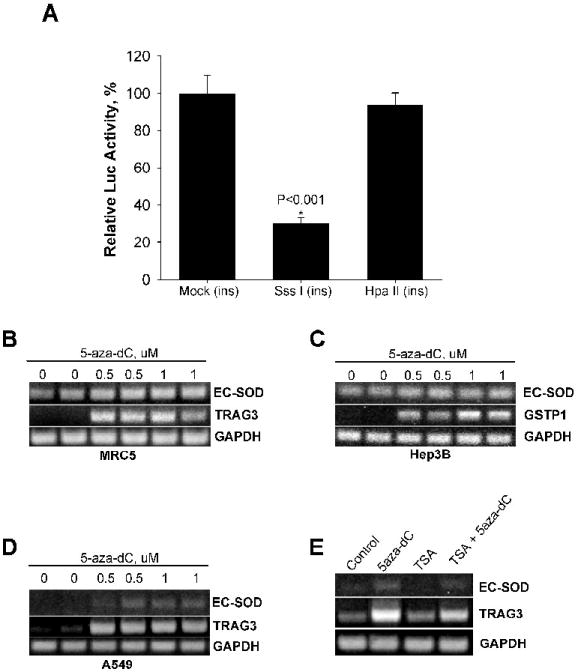
A, Methylated or mock methylated promoter region (-1106/+45) was cloned into luciferase expressing vector pGL3-Basic and transiently transfected into A549 cells. SssI[ins] indicated that insert was densely methylated with SssI methylase (methylated mCG sites), HpaII[ins] indicate that insert was methylated with HpaII methylase (methylate CmCGG sites). B-D, effect of demethylating reagent 5-aza-dC on EC-SOD gene transcription. Cells were treated with 5-aza-dC at indicated concentrations for 4 days, RNA purified, reverse transcribed and amplified using primers specific for EC-SOD, TRAG3 (positive control for A549 and MRC5 cells) or GSTP1 (positive control for Hep3B cells) genes. GAPDH was used as normalization control. E, Exposure of A549 cells to TSA alone or in combination with 5-aza-dC was unable to further increase the EC-SOD transcription. A549 cells were exposed to 1.5 μM TSA and/or 1.0 μM 5-aza-dC for 4 days.
Induction of EC-SOD gene expression by demethylation agent 5-azacytidine (5-aza-dC)
To further investigate the significance of methylation as a major regulatory mechanism, A549 cells were treated with an increasing concentration of demethylating agent 5-aza-dC for 96 hours. The expression of EC-SOD gene was induced at 0.5 uM concentration of 5-aza-dC and reached a peak at 1 uM (Figure 2D). The Taxol Resistant Associated Gene-3 (TRAG3) was used as a positive control [18]. In contrast, exposure of MRC5 and Hep3B cells to the same concentration of demethylation agent did not change EC-SOD gene expression, while parallel experiments showed significant induction of the positive controls π-class glutathione S-transferase (GSTP1) gene in Hep3B (Figure 2C) [19] and TRAG3 gene in MRC5 (Figure 2B).
The methylation of DNA usually leads to reorganization of chromatin into more compact nucleosomal structures. This repressive chromatin conformation could be reorganized by incubating cells with histone deacetylase inhibitor trichostatin A (TSA). Exposure of A549 cells to TSA alone for 48 hours did not increase EC-SOD mRNA levels (Figure 2E). Exposure to 5-aza-dC in combination with TSA did not facilitate transcription of EC-SOD gene or TRAG gene over exposure to 5-aza-dC alone (Figure 2E). These findings are consistent with a proposed model whereby methylation of CpG sites in the EC-SOD promoter region silences gene expression and further suggests that the mechanism of methylation-dependent attenuation of EC-SOD transcription in A549 cells may not require HDAC modification.
Transcription from methylated EC-SOD promoter is repressed by MeCP2 in Drosophila cells
Transcriptional repression of methylated promoters can be mediated by members of the methyl-binding family of proteins that have conservative methyl-binding domain (MBD). The methyl-CpG binding protein 2 (MeCP2) was the first member of this family shown to inhibit transcription through interaction with histone deacetylase (HDAC) proteins and assembling multiprotein complexes on methylated promoters. In order to investigate the mechanism of methylation dependent repression of EC-SOD transcription, we cotransfected a methylated promoter-reporter construct with the plasmid encoding MeCP2 into Drosophila SL2 cells which do not express endogenous MeCP2. Methylation alone with Hpa II or Sss I methylases did not affected the activation of transcription, neither by Sp1 nor Sp3 (Figure 3A). When MeCP2 was coexpressed with the methylated EC-SOD promoter construct, the reporter activity was significantly inhibited, indicating that MeCP2 strongly suppressed transcriptional activity of the methylated EC-SOD promoter. This repression was dependent on the methylation density within the promoter region. The activity of Hpa II methylated promoter was attenuated by 24.2% from 42,897 ± 8515 RLU to 32,519 ± 5919 RLU for Sp1 dependent activation, and by 42.4% from 118,719 ± 20,579 RLU to 68,336 ± 9508 RLU for Sp3 dependent activation (Fig 3B). The activity of Sss I methylated promoter was repressed by 48.8% to 21,948 ± 3260 RLU and by 72% to 33,340 ± 4530 RLU for Sp1 and Sp3 dependent activation, respectively. These data suggest that methylated CpG sites within the EC-SOD promoter does not interfere with Sp1/Sp3 binding directly. Instead, methylated cytosines facilitate the binding of MeCP2 proteins, at least in insect cells, which might hinder Sp1/Sp3 interaction with their putative binding site.
Figure 3. Effects of DNA methylation and MeCP2 coexpression on EC-SOD promoter activity in SL2 cells.
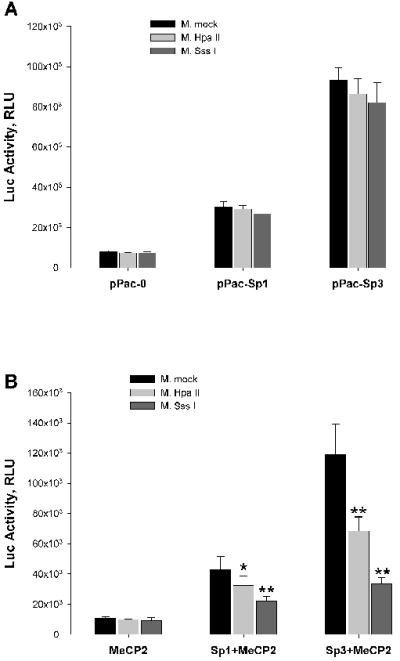
A, EC-SOD promoter region (-1106/+45) was methylated with SssI, HpaII or mock methylated, cloned in front of luciferase gene in pGL3-Basic vector and transiently cotransfected with pPac-O, pPac-Sp1 or pPac-Sp3 plasmids into SL2 cells. 24 hours later the luciferase activity was analyzed as described in “Material and Methods”. B, Plasmids described above were transiently cotransfected with plasmid expressing MeCP2 gene. Results shown are mean ± SD from at least two independent transfection experiments, each performed in quadruplicate. *p<0.05, **p<0.001; significant difference vs mock methylated.
Knockdown of MeCP2 using siRNA does not increase the expression of EC-SOD in A549 cells
To test whether MeCP2 was responsible for repression of transcription from hypermethylated EC-SOD promoter in mammalian cells, an siRNA-based strategy was employed to silence the endogenous MeCP2 expression in A549 cells. Transfection of MeCP2 siRNA resulted in 89% silencing of the MeCP2 gene at the transcription level (Fig. 4A). Transfection of non-targeting siRNAs had no effect on MeCP2, EC-SOD or CyPB expression, while transfection of CyPB specific siRNAs resulted in 98% reduction in CyPB mRNA levels (positive control). Expression of the EC-SOD gene was not affected by MeCP2 siRNA transfection at the mRNA level (Fig. 4A and B), compared to cells transfected with mock and non-targeting siRNA. The expression of GAPDH gene was not affected by the siRNA transfections. The lack of effect of MeCP2 downregulation on EC-SOD expression can be attributed to the repression by chromatin structures and histone acetylation status. To test this hypothesis we analyzed the effect of TSA on modulation of EC-SOD expression by MeCP2 specific siRNA. Treatment of A549 cells with TSA had no significant effect on EC-SOD gene expression in response to MeCP2 gene knockdown (Figure 4B). In addition we analyzed the effect of DNA demethylation on MeCP2-related response. Treatment of A549 cells with 5-aza-dC for 48 hours increased EC-SOD expression 2.75±0.16 fold, but no significant changes in EC-SOD gene expression (2.55±0.14 fold) were detected when MeCP2 gene was knocked down (Figure 4B). These data suggest that role of MeCP2 in the repression of methylation-dependent expression of EC-SOD in A549 cells is not significant or that its loss-of-function can be readily substituted by other methyl-binding proteins.
Figure 4. Effect of MeCP2 siRNA on EC-SOD expression.
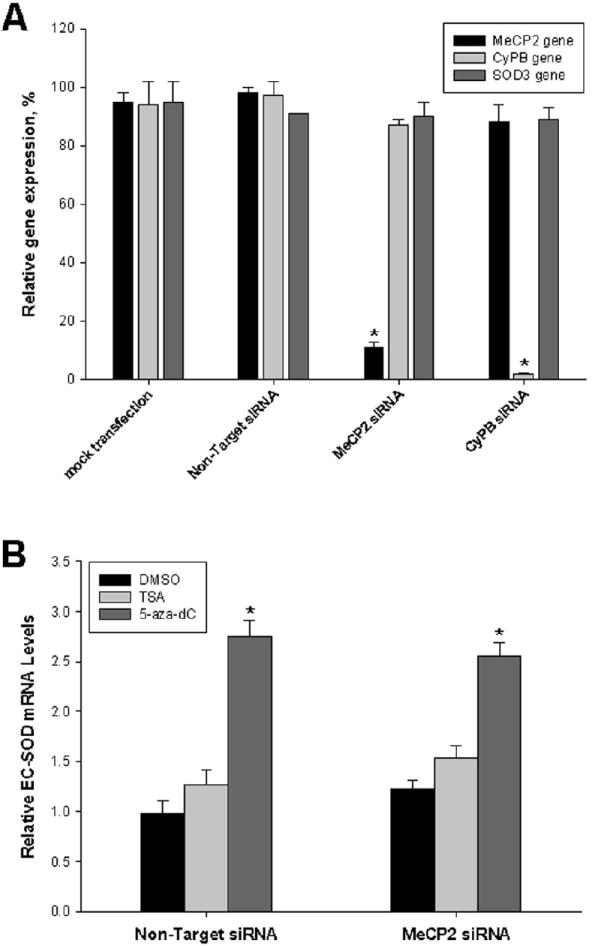
A, A549 cells were mock transfected or transfected with siRNA specific for MeCP2 and cyclophilin B (CyPB). Non-targeting siRNA were used as negative control. Total RNA was purified 48 hours after transfection and MeCP2, EC-SOD and CyPB mRNA levels were determined using quantitative RT-PCR. B, Effect of MeCP2 specific siRNA on expression of EC-SOD. A549 cells were transfected with non-targeting or MeCP2 siRNA as described above. After transfection cells were exposed to DMSO, TSA (1.5 μM) or 5-aza-dC (1 μM) for 48 hours. The EC-SOD expression levels were determined using quantitative RT-PCR. Results shown are mean ± SD from at least two independent transfection experiments, each performed in quadruplicate. *p<0.001; significant difference vs DMSO (A) and vs non-targeting siRNA (B).
Effect of 5-aza-dC on occupancy of EC-SOD promoter by RNA polymerase II, Sp3 and methyl binding proteins
To determine whether EC-SOD promoter methylation and gene expression have a direct relationship, we analyzed the binding of RNA polymerase II and Sp3 transcription factor to the proximal promoter in A549 cells untreated or treated with 5-aza-dC. The treatment of A549 cells with 5-aza-dC for 4 days activated EC-SOD gene transcription by 2.75±0.16 fold (Figure 4) and increased RNA polymerase II and Sp3 binding to it promoter by 1.82±0.15 and 2.13±0.19 fold respectively (Figure 5, B &D). As a positive control, we analyzed occupancy of GAPDH promoter by the same factors which expression is high in A549 cells and not modified by treatment with 5-aza-dC. Our ChIP assay indicated marked enrichment of RNA polymerase II and Sp3 at the GAPDH promoter in both untreated and treated cells (Figure 5, B upper panel). These data suggest that methylation of CpG sites prevents the binding of Sp3 and RNA polymerase transcription machinery to EC-SOD promoter in vivo.
Figure 5. Analysis of EC-SOD promoter occupancy by RNA polymerase II, Sp3, MeCP2 and MBD following 5-aza-dC treatment.
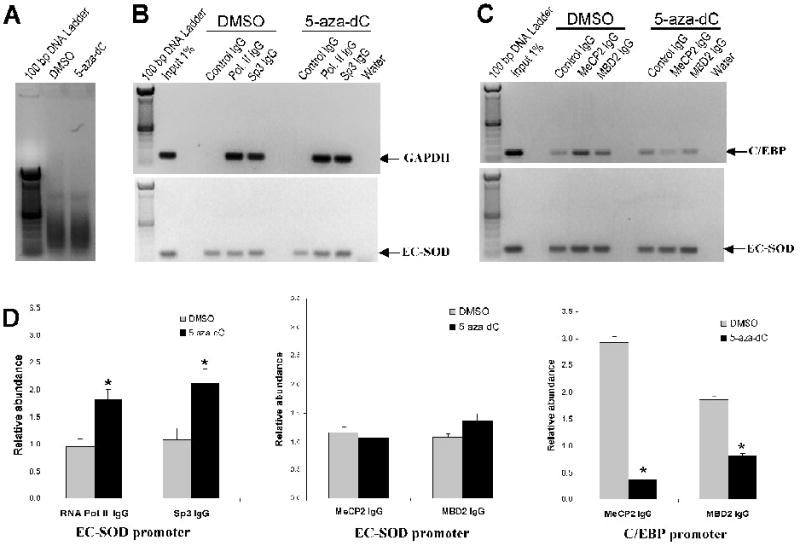
Chromatin immunoprecipitation assay was used to analyze the interaction of RNA Polymerase II (RNA Pol. II), Sp3, MeCP2 and MBD2 with the EC-SOD proximal promoter in A549 cells untreated or treated with 1 μM of 5-aza-dC for 4 days. A, The molecular size of shared genomic DNA from A549 cells treated with DMSO or 5-aza-dC. B, Occupancy of EC-SOD promoter by RNA Polymerase II and Sp3 was analyzed using ChIP assay. The binding of RNA polymerase II and Sp3 to the GAPDH promoter was used as a positive control. C, Effect of 5-aza-dC on binding of MeCP2 and MBD2 to EC-SOD promoter in vivo. Binding of these proteins to the C/EBP promoter was used as a positive control. Gel images shown here are representative of at least three independent experiments. D, Quantitative analysis of images presented in panel B & C. The intensity of fluorescence from amplified bands was compared and expressed as relative abundance of the protein at corresponding promoter. Asterisks indicate amplified bands whose intensity is significantly higher than the intensity of corresponding control IgG bands. (P < 0.05). Bars represent ±SD
Next, we decided to analyze the role of MeCP2 and MBD2 proteins in this methylation specific EC-SOD gene repression in A549 cells. We found no enrichment of MeCP2 or MBD2 at EC-SOD proximal promoter in A549 cells (Figure 5, C & D). Moreover, treatment of cells with 5-aza-dC did not change the abundance of these proteins at EC-SOD promoter. As positive control, we analyzed the occupancy of C/EBP promoter which expression in A549 cells is repressed by DNA methylation and can be reactivated by 5-aza-dC treatment [20]. We found 2.93±0.102 and 1.86±0.089 fold enrichment of C/EBP promoter fragments in fractions precipitated with anti-MeCP2 and MBD2 respectively. Moreover, the levels of C/EBP promoter occupancy by these proteins were significantly diminished after 5-aza-dC treatment (Figure 5, C & D). In conclusion, our data suggest that while in the insect cells transfected with methylated promoter-reporter construct MeCP2 inhibit promoter activity, in the human A549 cells the role of methyl binding proteins MeCP2 and MBD2 in the repression of EC-SOD gene transcription is not that obvious. However, at this time we can not rule out that other methyl-binding proteins might be involved in repression of transcription from hypermethylated EC-SOD promoter in the mammalian cells.
EC-SOD promoter is more accessible for micrococcal nuclease digestion in MRC5 cells
Binding of Sp1/Sp3 to the EC-SOD promoter in A549 cells can also be abolished because of positioning of the nucleosome over their binding site. To obtain information about the nucleosomal organization of the EC-SOD promoter, permeabilized A549 and MRC5 cells were treated with micrococcal S7 nuclease to digest internucleosomal DNA (Figure 6A). Subsequently, mononucleosomal DNA was isolated and amplified using overlapping and closely spaced (~100 bp) primer pairs (Figure 6B). Efficiency of PCR amplification for each primer pair will be equal for mononucleosomal DNA purified from either A549 or MRC5 cells. Thus, if the region to be amplified is more accessible for digestion in one cell type and less accessible for digestion in other cell types, we will detect the difference in the number of cycles required to reach the threshold level (Ct) in a quantitative PCR. Therefore, positive numbers obtained after subtraction of MRC5 Ct value from A549 Ct value will indicate that this region of DNA is more accessible for digestion in A549 cells, while negative values will indicate the opposite. Comparison of Ct values obtained from A549 and MRC5 cells revealed that the region between -300 to +1 bp that covers the Sp1/Sp3 binding site and transcription start sites is more open to nuclease digestion in MRC5 cells compared to A549 cells (Figure 6C). The maximum difference in Ct values obtained for primer pair 3 and 6 is around 3 what corresponding to approximately 8 fold differences in nuclease digestion. This delta Ct value is in good agreement with previously published data on Ct values obtained from the nucleosomal or nucleosome-free templates [21]. Our findings support a model where the Sp1/Sp3 binding site is functional in MRC5 cells and inaccessible in A549 cells due to methylation of this region and associated nucleosomal organization.
Figure 6. Nucleosomal mapping of EC-SOD promoter.
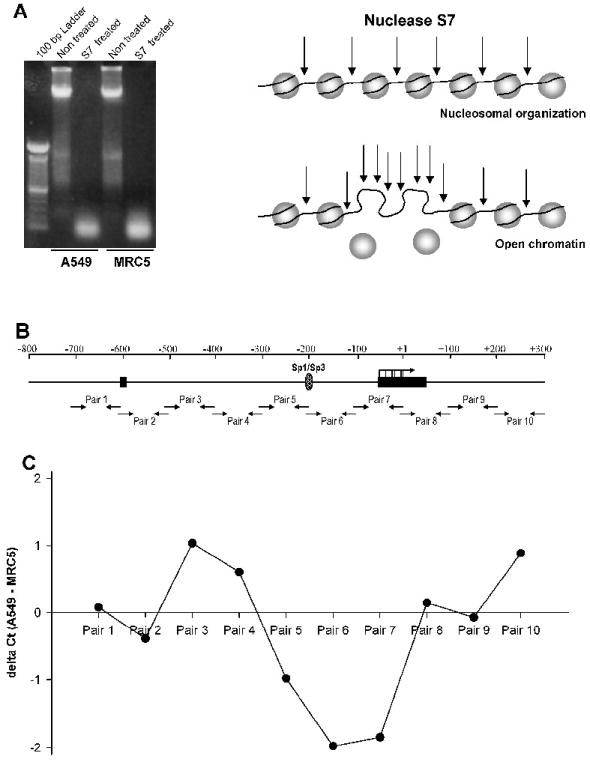
A, A549 and MRC5 cells were treated with micrococcal S7 nuclease to produce mononucleosomal genomic DNA fragments (~147 bp). B, Schematic diagram describing the principle of S7 nuclease assay. Micrococcal S7 nuclease preferentially digests DNA not organized in nucleosomes. Hence, DNA organized in nucleosomes will be less prone to the nuclease digestion and will be amplified to the qPCR threshold at a lower Ct compare to the less organized DNA. C, Purified mononucleosomal DNA was amplified using primer pairs (depicted in panel B) and resulting product was quantified using SYBR Green dye in a quantitative PCR. The difference in Ct between A549 and MRC5 cells for each primer pair was plotted. The negative numbers suggests that in MRC5 cells this part of DNA is less organized into nucleosomes and more prone for nuclease digestion compare to A549 cells.
Discussion
EC-SOD enzymatic activity is essential for maintaining a balanced and physiologic concentrations of superoxide in extracellular spaces, which in turn can indirectly contribute to the regulation of other extracellular active biomolecules like nitric oxide and/or peroxynitrate. In particular, EC-SOD is expressed at high levels in lung, vasculature and kidney. In the lung, EC-SOD is localized in close proximity to type II pneumonocytes, airway epithelial cells and around smooth muscle cells in the pulmonary vasculature and airways [22]. Pulmonary fibroblasts and alveolar macrophages are an additional source of EC-SOD production [23]. There is not much known about specific transcriptional mechanisms that regulate basal expression of EC-SOD and why this high level of expression occurs only in a limited number of specific cell types.
We have previously identified the promoter region of murine and human EC-SOD gene and have shown that EC-SOD transcription is critically dependent on a single Sp1/Sp3 binding site located within its proximal promoter [10, 24]. A distal functional promoter region binds Ets, Kruppel and MZF family of transcription factors which are responsible for, at least in part, its cell-specific expression [11]. Sp1 was the first discovered member of a growing family of transcription factors that exhibit very similar structural features and binds to the GC-rich boxes and related motifs (for review see [25]). Sp1 is expressed ubiquitously and abundantly in almost all cell types and regulates expression of a wide variety of metabolic enzymes, transcription factors, and cytoskeleton proteins, among others. Developmental expression of Sp1 is critical because disruption of its gene causes embryo growth retardation and death at the early gestational stages in mice [26]. However, a lack of Sp1 expression can be compensated for, at least in part, by Sp3 or other Sp-family proteins. Sp1 and Sp3 bind to the same consensus binding sequences but might perform quite different physiological functions. For example, studies with Sp3-null mice have shown that during early development both proteins might have similar functions but following the progression into late embryogenesis and postnatal period they become more specialized [27]. It has been reported that three isoforms of Sp3 exist and our Western blot experiment confirmed the presence of three distinct bands in A549 and MRC5 nuclear extracts [28]. These isoforms have different functions and might act as activators or as repressors. Moreover, in transient transfection experiment in Drosophila SL2 cells and certain mammalian cells, Sp3 can function as either an activator or a repressor depending on the sequence composition and the organization of binding sites [29, 30]. The dual function of Sp3 can be attributed to the presence of inhibitory domain located between the second glutamine-rich activation domain and the first zinc finger [30].
Methylation of CpG dinucleotides within the promoter region has been shown to lead to transcriptional repression of a number of genes regulated by Sp1 and Sp3 binding [31-34]. The repression by DNA methylation can be mediated by several mechanisms. Binding of Sp1/Sp3 can be inhibited by methyl groups located within consensus binding region or in close proximity to it. Methylation-dependent repression of transcription can also be attributed to the binding of methyl-binding proteins MeCP2 as well as MBD2, which is member of MeCP1 complex [35, 36]. Upon binding to the methylated DNA these proteins can either directly hinder binding of Sp1/Sp3 and/or recruit corepressors and effect histone deacetylase activity [37]. Our data indicated that the methylation of CpG dinucleotides in EC-SOD promoter is unlikely to directly interfere with Sp1/Sp3 binding. First, no CpG sites were located in Sp1 binding site within EC-SOD promoter. Second, methylation of EC-SOD regulatory sequences in the promoter/reporter constructs using low density Hpa II or high density Sss I methylase did not attenuate the reporter activity in SL2 cells which were additionally contransfected with Sp1 or Sp3. The role of methyl CpG binding proteins in the repression of transcription from methylated EC-SOD promoter is not clear. On one hand, cotransfection of MeCP2 with methylated promoter/reporter construct significantly inhibited EC-SOD promoter activity in insect SL2 cells. On the other hand, inactivation of MeCP2 using siRNA did not activate EC-SOD expression in A549 cells. This lack of effect can be explained in the light of more recent studies that provided insight into new role of MeCP2 as an activator of gene transcription [38, 39]. However, our ChIP experiments indicate that MeCP2 and MBD2 do not interact with EC-SOD proximal promoter in A549 cells in vivo. At this time we can not rule out that other members of family of methyl-CpG binding proteins interact with EC-SOD promoter and regulate its activity. The alternative explanation might be that the changes to chromatin structure including post-translational histone modification may also be important determinants of the ability of transcriptionalcomplexes to form on the native promoter. Histone deacetylation results in formation of condensed chromatin that can be organized in nucleosomes and in turn become inaccessible for the transcriptional machinery. Our nucleosomal mapping experiment indicates that indeed the methylated EC-SOD promoter region in A549 cells exists in a more organized nucleosomal form which is more resistant to endonuclease digestion. On the other hand, if histone acetylation/deacetylation plays an important role in regulation of human EC-SOD transcription, then treatment of A549 cells with deacetylase inhibitor TSA should relax demethylated chromatin and activate transcription. In contrary, we found that TSA was unable to increase EC-SOD transcription alone or after demethylation of DNA using 5-aza-dC agent. These data suggest that the switch of the EC-SOD promoter from a nucleosomal to the permissive state might involve different mechanisms for chromatin remodeling. Additional studies will be necessary to determine the exact molecular mechanism governing cell and tissue-specific chromatin organization within the EC-SOD 5’-flanking region and promoter.
Acknowledgments
This work was funded in part by National Institute of Health Grant HL64894, HL074289 and by a Intramural Research Incentive Grant from the University of Louisville School of Medicine. We thank Dr J. Noti (Guthrie Research Institute) for providing the pPacO, pPacSp1, pPacSp2, and pPacSp3 plasmids. We would also like to acknowledge Dr. P. Marsden (University of Toronto) for providing the pPac-rMeCP2 expression vector.
Footnotes
Publisher's Disclaimer: This is a PDF file of an unedited manuscript that has been accepted for publication. As a service to our customers we are providing this early version of the manuscript. The manuscript will undergo copyediting, typesetting, and review of the resulting proof before it is published in its final citable form. Please note that during the production process errors may be discovered which could affect the content, and all legal disclaimers that apply to the journal pertain.
References
- 1.Zelko IN, Mariani TJ, Folz RJ. Superoxide dismutase multigene family: a comparison of the CuZn-SOD (SOD1), Mn-SOD (SOD2), and EC-SOD (SOD3) gene structures, evolution, and expression. Free Radic Biol Med. 2002;33:337–349. doi: 10.1016/s0891-5849(02)00905-x. [DOI] [PubMed] [Google Scholar]
- 2.Noor R, Mittal S, Iqbal J. Superoxide dismutase--applications and relevance to human diseases. Med Sci Monit. 2002;8:RA210–215. [PubMed] [Google Scholar]
- 3.Fattman CL, Schaefer LM, Oury TD. Extracellular superoxide dismutase in biology and medicine. Free Radic Biol Med. 2003;35:236–256. doi: 10.1016/s0891-5849(03)00275-2. [DOI] [PubMed] [Google Scholar]
- 4.Folz RJ, Abushamaa AM, Suliman HB. Extracellular superoxide dismutase in the airways of transgenic mice reduces inflammation and attenuates lung toxicity following hyperoxia. J Clin Invest. 1999;103:1055–1066. doi: 10.1172/JCI3816. [DOI] [PMC free article] [PubMed] [Google Scholar]
- 5.Ahmed MN, Suliman HB, Folz RJ, Nozik-Grayck E, Golson ML, Mason SN, Auten RL. Extracellular superoxide dismutase protects lung development in hyperoxia-exposed newborn mice. Am J Respir Crit Care Med. 2003;167:400–405. doi: 10.1164/rccm.200202-108OC. [DOI] [PubMed] [Google Scholar]
- 6.Rabbani ZN, Anscher MS, Folz RJ, Archer E, Huang H, Chen L, Golson ML, Samulski TS, Dewhirst MW, Vujaskovic Z. Overexpression of extracellular superoxide dismutase reduces acute radiation induced lung toxicity. BMC Cancer. 2005;5:59. doi: 10.1186/1471-2407-5-59. [DOI] [PMC free article] [PubMed] [Google Scholar]
- 7.Bowler RP, Nicks M, Warnick K, Crapo JD. Role of extracellular superoxide dismutase in bleomycin-induced pulmonary fibrosis. Am J Physiol Lung Cell Mol Physiol. 2002;282:L719–726. doi: 10.1152/ajplung.00058.2001. [DOI] [PubMed] [Google Scholar]
- 8.Fattman CL, Chang LY, Termin TA, Petersen L, Enghild JJ, Oury TD. Enhanced bleomycin-induced pulmonary damage in mice lacking extracellular superoxide dismutase. Free Radic Biol Med. 2003;35:763–771. doi: 10.1016/s0891-5849(03)00402-7. [DOI] [PubMed] [Google Scholar]
- 9.Gongora MC, Lob HE, Landmesser U, Guzik TJ, Martin WD, Ozumi K, Wall SM, Wilson DS, Murthy N, Gravanis M, Fukai T, Harrison DG. Loss of extracellular superoxide dismutase leads to acute lung damage in the presence of ambient air: a potential mechanism underlying adult respiratory distress syndrome. Am J Pathol. 2008;173:915–926. doi: 10.2353/ajpath.2008.080119. [DOI] [PMC free article] [PubMed] [Google Scholar]
- 10.Zelko IN, Folz RJ. Sp1 and Sp3 transcription factors mediate trichostatin A-induced and basal expression of extracellular superoxide dismutase. Free Radic Biol Med. 2004;37:1256–1271. doi: 10.1016/j.freeradbiomed.2004.06.022. [DOI] [PubMed] [Google Scholar]
- 11.Zelko IN, Folz RJ. Myeloid zinc finger (MZF)-like, Kruppel-like and Ets families of transcription factors determine the cell-specific expression of mouse extracellular superoxide dismutase. Biochem J. 2003;369:375–386. doi: 10.1042/BJ20021431. [DOI] [PMC free article] [PubMed] [Google Scholar]
- 12.Zelko IN, Mueller MR, Folz RJ. Transcription factors sp1 and sp3 regulate expression of human extracellular superoxide dismutase in lung fibroblasts. American journal of respiratory cell and molecular biology. 2008;39:243–251. doi: 10.1165/rcmb.2007-0378OC. [DOI] [PMC free article] [PubMed] [Google Scholar]
- 13.Ordway JM, Curran T. Methylation matters: modeling a manageable genome. Cell Growth Differ. 2002;13:149–162. [PubMed] [Google Scholar]
- 14.Bird A. DNA methylation patterns and epigenetic memory. Genes & development. 2002;16:6–21. doi: 10.1101/gad.947102. [DOI] [PubMed] [Google Scholar]
- 15.Luoma JS, Stralin P, Marklund SL, Hiltunen TP, Sarkioja T, Yla-Herttuala S. Expression of extracellular SOD and iNOS in macrophages and smooth muscle cells in human and rabbit atherosclerotic lesions: colocalization with epitopes characteristic of oxidized LDL and peroxynitrite-modified proteins. Arteriosclerosis, thrombosis, and vascular biology. 1998;18:157–167. doi: 10.1161/01.atv.18.2.157. [DOI] [PubMed] [Google Scholar]
- 16.Laukkanen MO, Mannermaa S, Hiltunen MO, Aittomaki S, Airenne K, Janne J, Yla-Herttuala S. Local hypomethylation in atherosclerosis found in rabbit ec-sod gene. Arteriosclerosis, thrombosis, and vascular biology. 1999;19:2171–2178. doi: 10.1161/01.atv.19.9.2171. [DOI] [PubMed] [Google Scholar]
- 17.Li LC, Dahiya R. MethPrimer: designing primers for methylation PCRs. Bioinformatics. 2002;18:1427–1431. doi: 10.1093/bioinformatics/18.11.1427. [DOI] [PubMed] [Google Scholar]
- 18.Zhu B, Chen Z, Cheng X, Wu Y. Induction of TRAG-3 expression in A549 lung adenocarcinoma cell line by 5-aza-2’ deoxyazacytidine. Lung cancer (Amsterdam, Netherlands) 2002;38:321–322. doi: 10.1016/s0169-5002(02)00310-0. [DOI] [PubMed] [Google Scholar]
- 19.Bakker J, Lin X, Nelson WG. Methyl-CpG binding domain protein 2 represses transcription from hypermethylated pi-class glutathione S-transferase gene promoters in hepatocellular carcinoma cells. The Journal of biological chemistry. 2002;277:22573–22580. doi: 10.1074/jbc.M203009200. [DOI] [PubMed] [Google Scholar]
- 20.Tada Y, Brena RM, Hackanson B, Morrison C, Otterson GA, Plass C. Epigenetic modulation of tumor suppressor CCAAT/enhancer binding protein alpha activity in lung cancer. J Natl Cancer Inst. 2006;98:396–406. doi: 10.1093/jnci/djj093. [DOI] [PubMed] [Google Scholar]
- 21.Bouchard C, Dittrich O, Kiermaier A, Dohmann K, Menkel A, Eilers M, Luscher B. Regulation of cyclin D2 gene expression by the Myc/Max/Mad network: Myc-dependent TRRAP recruitment and histone acetylation at the cyclin D2 promoter. Genes & development. 2001;15:2042–2047. doi: 10.1101/gad.907901. [DOI] [PMC free article] [PubMed] [Google Scholar]
- 22.Oury TD, Chang LY, Marklund SL, Day BJ, Crapo JD. Immunocytochemical localization of extracellular superoxide dismutase in human lung. Laboratory investigation; a journal of technical methods and pathology. 1994;70:889–898. [PubMed] [Google Scholar]
- 23.Su WY, Folz R, Chen JS, Crapo JD, Chang LY. Extracellular superoxide dismutase mRNA expressions in the human lung by in situ hybridization. American journal of respiratory cell and molecular biology. 1997;16:162–170. doi: 10.1165/ajrcmb.16.2.9032123. [DOI] [PubMed] [Google Scholar]
- 24.Zelko IN, Mueller MR, Folz RJ. Transcription Factors Sp1 and Sp3 Regulate Expression of Human EC-SOD in Lung Fibroblasts. American journal of respiratory cell and molecular biology. 2008 doi: 10.1165/rcmb.2007-0378OC. [DOI] [PMC free article] [PubMed] [Google Scholar]
- 25.Bouwman P, Philipsen S. Regulation of the activity of Sp1-related transcription factors. Molecular and cellular endocrinology. 2002;195:27–38. doi: 10.1016/s0303-7207(02)00221-6. [DOI] [PubMed] [Google Scholar]
- 26.Marin M, Karis A, Visser P, Grosveld F, Philipsen S. Transcription factor Sp1 is essential for early embryonic development but dispensable for cell growth and differentiation. Cell. 1997;89:619–628. doi: 10.1016/s0092-8674(00)80243-3. [DOI] [PubMed] [Google Scholar]
- 27.Bouwman P, Gollner H, Elsasser HP, Eckhoff G, Karis A, Grosveld F, Philipsen S, Suske G. Transcription factor Sp3 is essential for post-natal survival and late tooth development. The EMBO journal. 2000;19:655–661. doi: 10.1093/emboj/19.4.655. [DOI] [PMC free article] [PubMed] [Google Scholar]
- 28.Kennett SB, Udvadia AJ, Horowitz JM. Sp3 encodes multiple proteins that differ in their capacity to stimulate or repress transcription. Nucleic acids research. 1997;25:3110–3117. doi: 10.1093/nar/25.15.3110. [DOI] [PMC free article] [PubMed] [Google Scholar]
- 29.Majello B, De Luca P, Lania L. Sp3 is a bifunctional transcription regulator with modular independent activation and repression domains. The Journal of biological chemistry. 1997;272:4021–4026. doi: 10.1074/jbc.272.7.4021. [DOI] [PubMed] [Google Scholar]
- 30.Dennig J, Beato M, Suske G. An inhibitor domain in Sp3 regulates its glutamine-rich activation domains. The EMBO journal. 1996;15:5659–5667. [PMC free article] [PubMed] [Google Scholar]
- 31.Chan Y, Fish JE, D’Abreo C, Lin S, Robb GB, Teichert AM, Karantzoulis-Fegaras F, Keightley A, Steer BM, Marsden PA. The cell-specific expression of endothelial nitric-oxide synthase: a role for DNA methylation. The Journal of biological chemistry. 2004;279:35087–35100. doi: 10.1074/jbc.M405063200. [DOI] [PubMed] [Google Scholar]
- 32.Lee LT, Tan-Un KC, Pang RT, Lam DT, Chow BK. Regulation of the human secretin gene is controlled by the combined effects of CpG methylation, Sp1/Sp3 ratio, and the E-box element. Molecular endocrinology (Baltimore, Md. 2004;18:1740–1755. doi: 10.1210/me.2003-0461. [DOI] [PubMed] [Google Scholar]
- 33.Pang RT, Lee LT, Ng SS, Yung WH, Chow BK. CpG methylation and transcription factors Sp1 and Sp3 regulate the expression of the human secretin receptor gene. Molecular endocrinology (Baltimore, Md. 2004;18:471–483. doi: 10.1210/me.2003-0245. [DOI] [PubMed] [Google Scholar]
- 34.Zhu WG, Srinivasan K, Dai Z, Duan W, Druhan LJ, Ding H, Yee L, Villalona-Calero MA, Plass C, Otterson GA. Methylation of adjacent CpG sites affects Sp1/Sp3 binding and activity in the p21(Cip1) promoter. Molecular and cellular biology. 2003;23:4056–4065. doi: 10.1128/MCB.23.12.4056-4065.2003. [DOI] [PMC free article] [PubMed] [Google Scholar]
- 35.Jones PL, Veenstra GJ, Wade PA, Vermaak D, Kass SU, Landsberger N, Strouboulis J, Wolffe AP. Methylated DNA and MeCP2 recruit histone deacetylase to repress transcription. Nature genetics. 1998;19:187–191. doi: 10.1038/561. [DOI] [PubMed] [Google Scholar]
- 36.Ng HH, Zhang Y, Hendrich B, Johnson CA, Turner BM, Erdjument-Bromage H, Tempst P, Reinberg D, Bird A. MBD2 is a transcriptional repressor belonging to the MeCP1 histone deacetylase complex. Nature genetics. 1999;23:58–61. doi: 10.1038/12659. [DOI] [PubMed] [Google Scholar]
- 37.Nan X, Ng HH, Johnson CA, Laherty CD, Turner BM, Eisenman RN, Bird A. Transcriptional repression by the methyl-CpG-binding protein MeCP2 involves a histone deacetylase complex. Nature. 1998;393:386–389. doi: 10.1038/30764. [DOI] [PubMed] [Google Scholar]
- 38.Chahrour M, Jung SY, Shaw C, Zhou X, Wong ST, Qin J, Zoghbi HY. MeCP2, a key contributor to neurological disease, activates and represses transcription. Science. 2008;320:1224–1229. doi: 10.1126/science.1153252. [DOI] [PMC free article] [PubMed] [Google Scholar]
- 39.Yasui DH, Peddada S, Bieda MC, Vallero RO, Hogart A, Nagarajan RP, Thatcher KN, Farnham PJ, Lasalle JM. Integrated epigenomic analyses of neuronal MeCP2 reveal a role for long-range interaction with active genes. Proc Natl Acad Sci U S A. 2007;104:19416–19421. doi: 10.1073/pnas.0707442104. [DOI] [PMC free article] [PubMed] [Google Scholar]