Abstract
The effects of decylubiquinone, a ubiquinone analogue, on mitochondrial function and inhibition thresholds of the electron transport chain enzyme complexes in synaptosomes were investigated. Decylubiquinone increased complex I/III and complex II/III activities by 64 and 80%, respectively, and attenuated reductions in oxygen consumption at high concentrations of the complex III inhibitor myxothiazol. During inhibition of complex I, decylubiquinone attenuated reductions in synaptosomal oxygen respiration rates, as seen in the complex I inhibition threshold. Decylubiquinone increased the inhibition thresholds of complex I/III, complex II/III, and complex III over oxygen consumption in the nerve terminal by 25–50%, when myxothiazol was used to inhibit complex III. These results imply that decylubiquinone increases mitochondrial function in the nerve terminal during complex I or III inhibition. The potential benefits of decylubiquinone in diseases where complex I, I/III, II/III, or III activities are deficient are discussed.
Keywords: Bioenergetics, Mitochondria, Neurodegeneration, Neurological Diseases, Neuron, Electron Transport Chain Complexes, Metabolic Control Analysis, Synaptosomes
Introduction
Numerous reports have suggested that ubiquinone (coenzyme Q10) may have beneficial effects in neurodegenerative disorders (1–6). However, it is difficult to utilize ubiquinone in in vitro experiments because of its high level of hydrophobicity. Therefore, the beneficial effects of synthesized ubiquinone analogues, such as decylubiquinone (2,3-dimethoxy-5-methyl-6-decyl-1,4-benzoquinone), are under investigation. Decylubiquinone is an exogenous, hydrophobic quinone that has a 10-carbon side chain with a methyl group at the end and can travel into mitochondrial membranes unaided (7). Decylubiquinone accepts electrons from complex I and is reduced to decylubiquinol, which subsequently transfers electrons to complex III. Studies on the effect of decylubiquinone on the steady-state kinetics of complex I in bovine heart mitochondria showed that the binding of decylubiquinone induced a conformational change in the shape of the binding site, which allows the binding of a quinone with a long isoprenoid side chain (8). Decylubiquinone may be used favorably as an alternative to coenzyme Q1 because the interaction of decylubiquinone with complex I is more similar to that between endogenous ubiquinone and complex I than between coenzyme Q1 and complex I and because coenzyme Q1 is not as efficient at activating complex I activity as decylubiquinone (9).
In this study, the effects of decylubiquinone on the activities of a number of electron transport chain (ETC)2 components, complexes I (EC 1.6.5.3), I/III (EC 1.6.99.3), II/III (EC 1.3.5.1 + 1.10.2.2), and III (EC 1.10.2.2), in rat brain synaptosomes were examined. In addition, the effect of decylubiquinone on synaptosomal oxygen consumption, during titration with mitochondrial inhibitors, was investigated. Metabolic control analysis may be used to examine the spread of control among components in a system (10, 11), and the inhibition threshold is a useful parameter that describes mitochondrial function. The inhibition threshold is the level by which each component can be inhibited before an effect is observed on the entire flux. In this study, inhibition thresholds were obtained for ETC complexes I, I/III, II/III, and III in the presence and absence of decylubiquinone in rat brain synaptosomes.
EXPERIMENTAL PROCEDURES
Materials
Female Wistar rats (approximately 250 g) were obtained from the Bioresources Unit, Biochemistry Department, Trinity College, Dublin. Chemicals were provided by Sigma or by BDH, Dagenham, Essex, UK. Decylubiquinone was prepared in ethanol.
Preparation of Synaptosomes
The method of Lai and Clark (12) was used to isolate synaptosomes. The preparation of synaptosomes involved the chopping and homogenization of brain samples from two female Wistar rats, followed by centrifugation at 823 × g for 3 min at 4 °C. The subsequent supernatants were centrifuged at 9,148 × g for 10 min at 4 °C. The pellets were resuspended and ultracentrifuged on a discontinuous Ficoll gradient at 104,200 × g for 45 min at 4 °C. During the isolation, the samples were maintained in STE buffer (320 mm sucrose, 10 mm Tris, 1 mm EDTA, pH 7.4) and stored on ice. Following extraction of the synaptosomes from the Ficoll gradient, the protein concentration was determined using the method of Bradford (13), with the reference standard of bovine serum albumin.
Oxygen Consumption Experiments
Synaptosomal oxygen consumption rates were investigated with the use of a Clark-type oxygen electrode. Krebs buffer (3 mm KCl, 140 mm NaCl, 25 mm Tris-HCl, 10 mm glucose, 2 mm MgCl2, 2 mm CaCl2, pH 7.4) was used as the reaction buffer for the experiments. Synaptosomes (1 mg/ml) were incubated in Krebs buffer at 37 °C in the oxygen electrode. Decylubiquinone or ethanol and the appropriate ETC inhibitor were added. The oxygen consumption rates were examined for 5 min, and the reaction was stopped. The samples were extracted from the electrode and were stored at −80 °C for determination of ETC complex activities. The oxygen consumption rates were determined on at least four separate preparations of synaptosomes.
ETC Assays
The stored synaptosomal samples were freeze-fractured three times by rapid freezing in liquid nitrogen followed by thawing at 37 °C in a water bath. The complex activities of the samples were determined on a Cary UV spectrophotometer at 37 °C.
A modification of the method of Ragan et al. (14) was used to determine the complex I activity. This process involved following the conversion of NADH to NAD+ at 340 nm. Reaction buffer (10 mm MgCl2 and 25 mm potassium phosphate, pH 7.2), 0.2 mm NADH, 2.5 mg of bovine serum albumin, 1 mm KCN, and 100 μg of synaptosomes were added to plastic cuvettes with a final volume of 1 ml. Decylubiquinone (50 μm) was used to initiate the reaction, and the rates were recorded for 7–8 min. To determine the rotenone-insensitive rates, rotenone (10 μm) was added to the cuvettes, and the rates were monitored for a further 5–6 min.
Complex I/III activity was examined with the technique used by Powers et al. (15), which followed the reduction of oxidized cytochrome c at 550 nm and 37 °C in a Cary UV spectrophotometer. The assay mixture contained 50 mm potassium phosphate buffer, pH 7.4, 1 mm KCN, 100 μm oxidized cytochrome c, and 25 μg of synaptosomes in plastic cuvettes with a final volume of 1 ml. The addition of NADH (100 μm) initiated the reaction, which was followed for 7–8 min, after which time, rotenone (10 μm) was added to obtain the rotenone-insensitive rate for a further 5–6 min. The rotenone-insensitive rate was subtracted from the initial rates to obtain the complex I/III activity of the samples.
An assay based on the method of King (16) was used to examine complex II/III activity. This assay monitored the reduction of oxidized cytochrome c at 550 nm on a Cary UV spectrophotometer. Synaptosomes (50 μg) were added to reaction buffer (100 mm potassium phosphate, 0.3 mm potassium-EDTA, pH 7.4), 1 mm KCN and 100 μm cytochrome c in plastic cuvettes, giving a final volume of 1 ml. Succinate (20 mm) was added to start the reaction, and the rates were observed for 7–8 min. Subsequently, myxothiazol (1 μm) was added to obtain the myxothiazol-insensitive rate for a further 5–6 min.
A modification of the method of Ragan et al. (14) was used to determine complex III activity. Oxidation of decylubiquinol was monitored at 550 nm in a Cary UV spectrophotometer at 37 °C, with cytochrome c as the electron acceptor. The assay cuvettes contained reaction buffer (25 mm potassium phosphate, 5 mm MgCl2, 2.5 mg/ml bovine serum albumin, pH 7.2), 1 mm KCN, 100 μm oxidized cytochrome c, 600 μm n-dodecyl-β-maltoside, 35 μm decylubiquinol, and 10 μm rotenone. The addition of 50-μg synaptosomal samples started the reaction, and the rates were monitored for 7–8 min. The rates were expressed as apparent first-order rate constants (k).
Complex IV activity was examined using an assay based on the method of Wharton and Tzagoloff (17), which followed the oxidation of reduced cytochrome c at 550 nm. The assay cuvettes contained 50 μm reduced cytochrome c and 100 μl of potassium phosphate buffer (100 mm, pH 7.0) with a final volume of 1 ml, following the addition of water. The addition of synaptosomal samples (50 μg) initated the reaction and the rates were followed for 5–6 min. The results were expressed as first-order decay rate constants (k).
RESULTS
Effects of Decylubiquinone on ETC Complex Activities in Synaptosomes
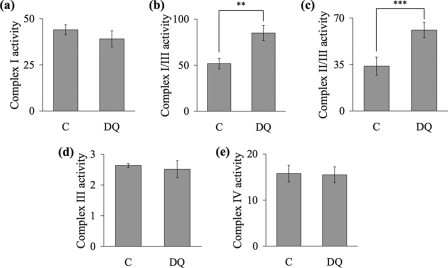
Decylubiquinone (50 μm) significantly increased complex I/III activity by 64%, from 51.7 ± 5.7 nmol/min/mg in the control to 85 ± 8.3 nmol/min/mg (Fig. 1). Complex II/III activity was increased by the addition of 50 μm decylubiquinone from 33.8 ± 6.8 nmol/min/mg in the control to 61 ± 5.7 nmol/min/mg in the decylubiquinone-treated sample, an increase of 80% (Fig. 1).
FIGURE 1.
Decylubiquinone increases the activities of complexes I/III and II/III in synaptosomes. Rat brain synaptosomes were incubated with ethanol (C) or 50 μm decylubiquinone (DQ) in Krebs buffer at 37 °C for 5 min. The activities of complex I (nmol/min/mg) (a), complex I/III (nmol/min/mg) (b), complex II/III (nmol/min/mg) (c), complex III (k/min/mg) (d), and complex IV (k/min/mg) (e) in the samples were determined by spectrophotometry. Experiments were performed on at least three individual preparations and results are expressed as mean ± S.E. (error bars). Significant differences between the decylubiquinone-treated sample and the corresponding control are shown by ** for p < 0.01 and *** for p < 0.001.
Effect of Decylubiquinone on Synaptosomal Oxygen Consumption during Titrations with Mitochondrial Inhibitors
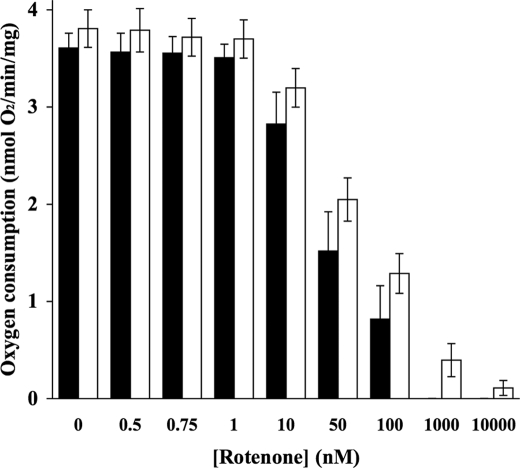
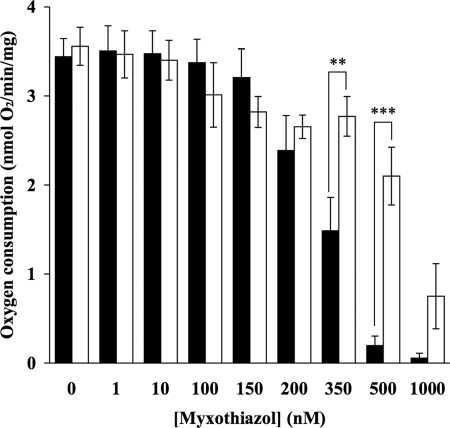
No significant difference was observed between the rate of synaptosomal oxygen consumption in the control in the absence of 50 μm decylubiquinone compared with that in the presence of 50 μm decylubiquinone (Figs. 2–4). Decylubiquinone did not alter oxygen consumption in synaptosomes during inhibition with the complex I inhibitor, rotenone (Fig. 2). However, decylubiquinone significantly attenuated reductions in oxygen consumption at higher concentrations of myxothiazol (350 nm and 500 nm; Fig. 3) and at higher concentrations of antimycin A (50 nm, 100 nm, and 500 nm; Fig. 4) compared with samples that had not been treated with decylubiquinone.
FIGURE 2.
Decylubiquinone does not alter oxygen consumption rates in synaptosomes during rotenone titration. Rat brain synaptosomes were incubated with a series of concentrations of rotenone (0–10 μm) in the absence (■) and presence (□) of 50 μm decylubiquinone in Krebs buffer at 37 °C, and rates of oxygen consumption were recorded and plotted against rotenone concentrations. Experiments were performed on at least three individual preparations, and results are expressed as mean ± S.E. (error bars).
FIGURE 3.
Decylubiquinone attenuates myxothiazol-induced reduction in oxygen consumption rates in synaptosomes. Rat brain synaptosomes were incubated with a series of concentrations of myxothiazol (0–1 μm) in the absence (■) and presence (□) of 50 μm decylubiquinone in Krebs buffer at 37 °C, and rates of oxygen consumption were recorded and plotted against myxothiazol concentrations. Experiments were performed on at least three individual preparations, and results are expressed as mean ± S.E. (error bars). Significant differences between the decylubiquinone-treated and untreated samples are shown by ** for p < 0.01 and *** for p < 0.001.
FIGURE 4.
Decylubiquinone attenuates antimycin A-induced reduction in oxygen consumption rates in synaptosomes. Rat brain synaptosomes were incubated with a series of concentrations of antimycin A (0–500 nm) in the absence (■) and presence (□) of 50 μm decylubiquinone in Krebs buffer at 37 °C and rates of oxygen consumption were recorded and plotted against antimycin A concentrations. Experiments were performed on at least three individual preparations, and results are expressed as mean ± S.E. (error bars). Significant differences between the decylubiquinone-treated and untreated samples are shown by *** for p < 0.001.
Effect of Decylubiquinone on Inhibition Thresholds for Complex I
Rotenone titrations of oxygen consumption rates and complex I activity were used to determine the inhibition thresholds. Fig. 5 shows the inhibition thresholds for complex I in the absence and presence of 50 μm decylubiquinone. The approximate inhibition threshold in the absence of decylubiquinone was found to be 10% compared with that of 15% after treatment with decylubiquinone. The decylubiquinone inhibition threshold curve decreased more slowly than the control threshold curve. At 51% complex I inhibition, oxygen consumption rates were 57% of the control rate in the presence of decylubiquinone, in contrast to 21% in the absence of decylubiquinone.
FIGURE 5.
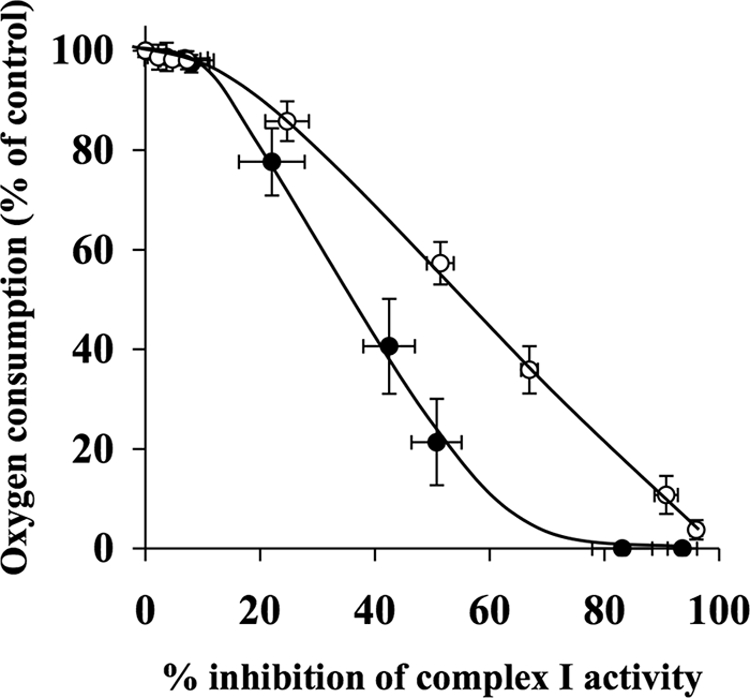
Decylubiquinone partially attenuates rotenone-induced reduction in oxygen consumption in synaptosomes. Rat brain synaptosomes were incubated with a series of concentrations of rotenone (0–10 μm) in the absence and presence of 50 μm decylubiquinone in Krebs buffer in an oxygen electrode at 37 °C. Rates of oxygen consumption and corresponding complex I activity were determined and expressed as percentages of their controls and used to generate the complex I inhibition threshold curves in the absence (●) and presence (○) of decylubiquinone. The control rates of complex I activity in the absence and presence of decylubiquinone were 40.6 ± 5.6 nmol/min/mg and 38.4 ± 4.3 nmol/min/mg, respectively. Experiments were performed on five individual preparations, and results are expressed as mean ± S.E. (error bars).
Effect of Decylubiquinone on Inhibition Thresholds for Complex I/III
Both rotenone and myxothiazol titrations of oxygen consumption rates and complex I/III activity were used to determine the inhibition thresholds. The complex I/III inhibition threshold, found by titrating with rotenone, showed a similar pattern in the absence and presence of 50 μm decylubiquinone (Fig. 6). However, the curve for decylubiquinone shifted to the right compared with the control curve. The complex I/III inhibition threshold curve in the absence of decylubiquinone was 10%, and that for the decylubiquinone-treated samples was 15% (Table 1). At 42% inhibition of complex I/III, synaptosomal oxygen consumption rates were 57% of the control rate in the presence of decylubiquinone, in contrast to 41% in the absence of decylubiquinone. In addition, myxothiazol titrations of oxygen consumption and complex I/III activity were used to generate the complex I/III inhibition thresholds in the absence and presence of 50 μm decylubiquinone (Fig. 7). The inhibition threshold for complex I/III in the absence of decylubiquinone was 35%, in contrast to 85% in the presence of decylubiquinone (Table 1).
FIGURE 6.
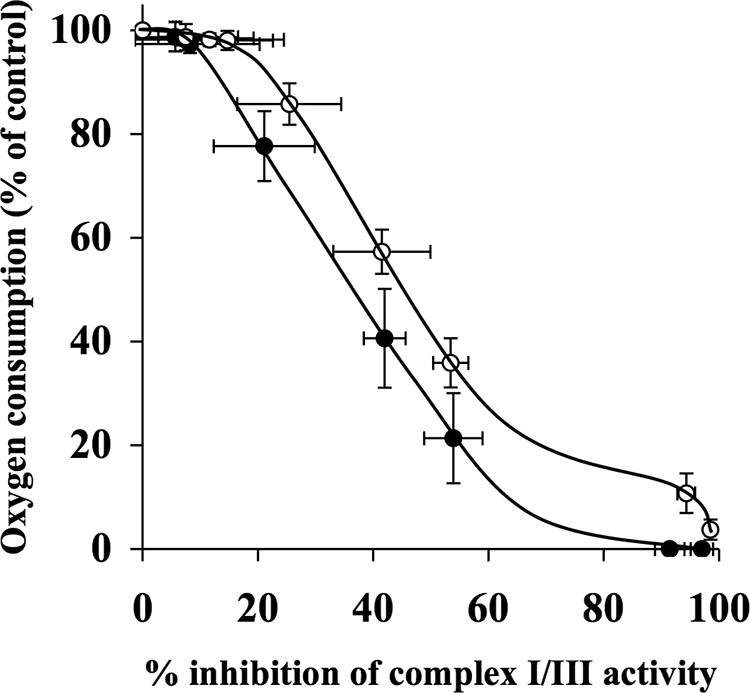
Decylubiquinone does not alter complex I/III inhibition threshold in synaptosomes when titrated with rotenone. Rat brain synaptosomes were incubated with a series of concentrations of rotenone (0–10 μm) in the absence and presence of 50 μm decylubiquinone in Krebs buffer in an oxygen electrode at 37 °C. Rates of oxygen consumption and corresponding complex I/III activity were determined and expressed as percentages of their controls and used to generate the complex I/III inhibition threshold curves in the absence (●) and presence (○) of decylubiquinone. The control rates of complex I/III activity in the absence and presence of decylubiquinone were 53 ± 6.6 nmol/min/mg and 79.5 ± 9.2 nmol/min/mg, respectively. Experiments were performed on five individual preparations, and results are expressed as mean ± S.E. (error bars).
TABLE 1.
Inhibition thresholds for complexes I, I/III, II/III, and III in the absence and presence of decylubiquinone
The inhibition thresholds were determined from rotenone and myxothiazol titrations of oxygen consumption and ETC complex activities as described under “Experimental Procedures.”
| −Decylubiquinone | +Decylubiquinone | |
|---|---|---|
| % | % | |
| Complex I (rotenone) | 10 | 15 |
| Complex I/III (rotenone) | 10 | 15 |
| Complex I/III (myxothiazol) | 35 | 85 |
| Complex II/III (myxothiazol) | 40 | 90 |
| Complex III (myxothiazol) | 35 | 60 |
FIGURE 7.
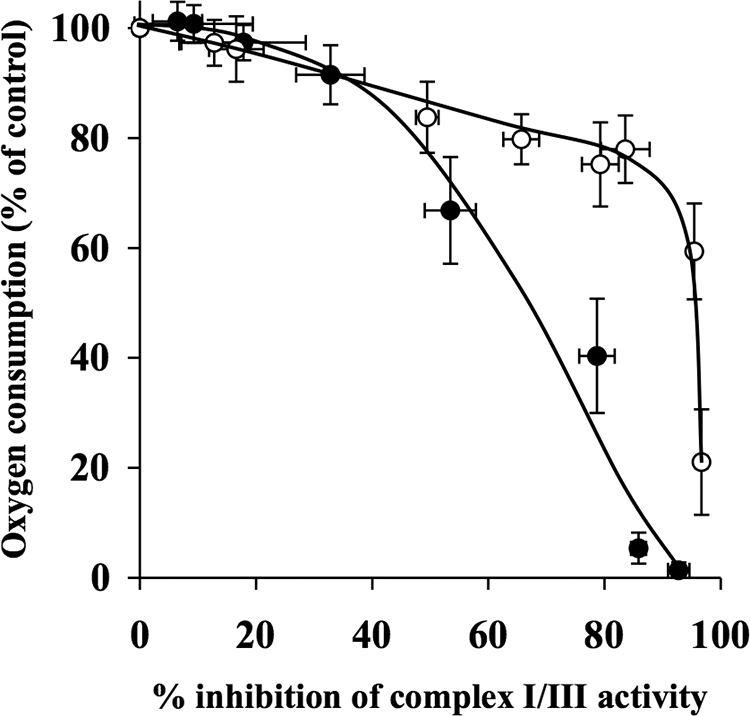
Decylubiquinone increases complex I/III inhibition threshold in synaptosomes, when titrated with myxothiazol. Rat brain synaptosomes were incubated with a series of concentrations of myxothiazol (0–1 μm) in the absence and presence of 50 μm decylubiquinone in Krebs buffer in an oxygen electrode at 37 °C. Rates of oxygen consumption and corresponding complex I/III activity were determined and expressed as percentages of their controls and used to generate the complex I/III inhibition threshold curves in the absence (●) and presence (○) of decylubiquinone. The control rates of complex I/III activity in the absence and presence of decylubiquinone were 44.2 ± 4.8 nmol/min/mg and 73.8 ± 8.25 nmol/min/mg, respectively. Experiments were performed on five individual preparations, and results are expressed as mean ± S.E. (error bars).
Effect of Decylubiquinone on Inhibition Thresholds for Complex II/III
Fig. 8 shows that the inhibition threshold for complex II/III in the absence of decylubiquinone was 40%. However, the presence of decylubiquinone appeared to increase the threshold to 90% (Table 1).
FIGURE 8.
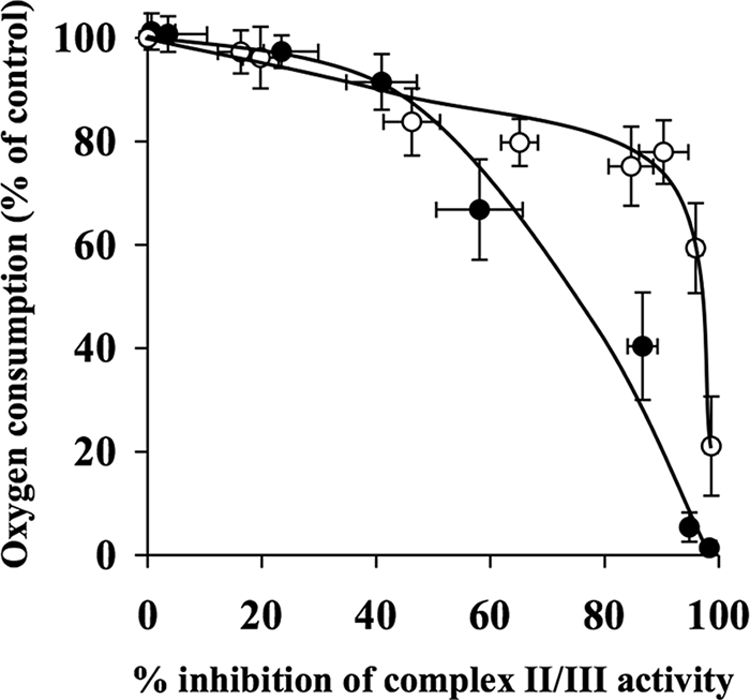
Decylubiquinone increases complex II/III inhibition threshold in synaptosomes. Rat brain synaptosomes were incubated with a series of concentrations of myxothiazol (0–1 μm) in the absence and presence of 50 μm decylubiquinone in Krebs buffer in an oxygen electrode at 37 °C. Rates of oxygen consumption and corresponding complex II/III activity were determined and expressed as percentages of their controls and used to generate the complex II/III inhibition threshold curves in the absence (●) and presence (○) of decylubiquinone. The control rates of complex II/III activity in the absence and presence of decylubiquinone were 33.9 ± 2.5 nmol/min/mg and 64.4 ± 5.8 nmol/min/mg, respectively. Experiments were performed on five individual preparations, and results are expressed as mean ± S.E. (error bars).
Effect of Decylubiquinone on Inhibition Thresholds for Complex III
The complex III inhibition thresholds in the absence and presence of 50 μm decylubiquinone were 35 and 60%, respectively (Fig. 9 and Table 1).
FIGURE 9.
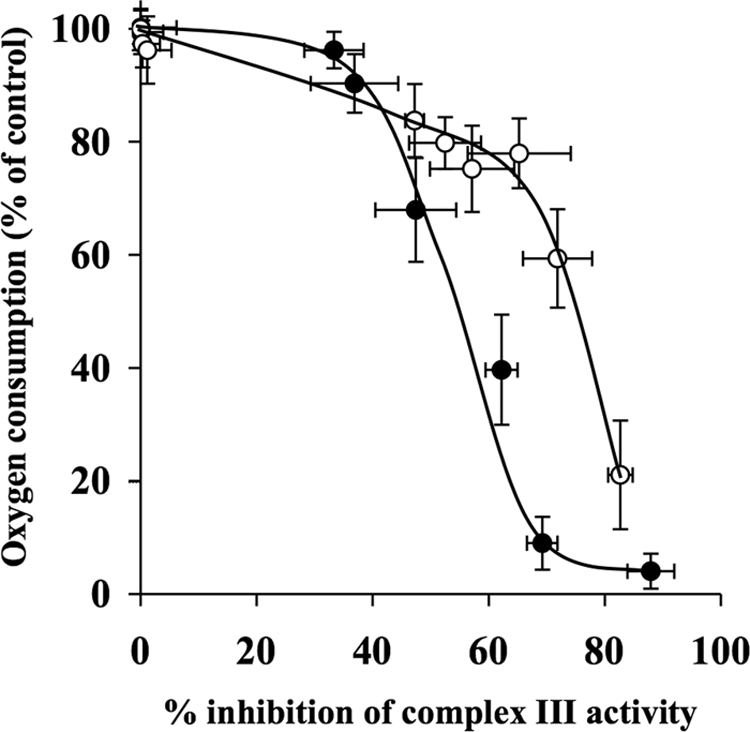
Decylubiquinone increases complex III inhibition threshold in synaptosomes. Rat brain synaptosomes were incubated with a series of concentrations of myxothiazol (0–1 μm) in the absence and presence of 50 μm decylubiquinone in Krebs buffer in an oxygen electrode at 37 °C. Rates of oxygen consumption and corresponding complex III activity were determined and expressed as percentages of their controls and used to generate the complex III inhibition threshold curves in the absence (●) and presence (○) of decylubiquinone. The control rates of complex I activity in the absence and presence of decylubiquinone were 2.72 ± 0.34 k/min/mg and 2.72 ± 0.39 k/min/mg, respectively. Experiments were performed on five individual preparations, and results are expressed as mean ± S.E. (error bars).
DISCUSSION
Decylubiquinone is an analogue of endogenously occurring ubiquinone and has been proposed as a possible neurotherapeutic agent. However, the information on its possible effects in nerve terminal mitochondria and its mechanisms of action is limited. Decylubiquinone naturally accumulates in mitochondria, and this study investigated the effects of decylubiquinone on synaptosomal oxygen consumption, complex activities, and inhibition thresholds associated with the respiratory chain complexes.
The results in this study suggest that decylubiquinone can influence the activities of complex I/III and complex II/III but is not a controlling factor in the activities of the individual complexes, I, III, and IV, or in the rate of oxygen consumption, which were unaffected by decylubiquinone. Ogasahara et al. (18) analyzed complex activities from two patients who had ubiquinone deficiencies (ubiquinone content was ∼4% of the control levels). They found that the activities of complexes I, II, III, and IV in mitochondria from the patients were the same as in the control samples. However, complex I/III and complex II/III activities were significantly lower in the ubiquinone-deficient patients than in the controls.
The mechanism by which decylubiquinone increases the activities of complexes I/III and II/III remains unknown; however, it may involve supercomplexes that are known to exist in mitochondria (19, 20). A complex III dimer can associate directly with a complex I monomer. Therefore, the addition of decylubiquinone may increase the rate of electron transfer from complex I to complex III, resulting in increased complex I/III-specific activities. Although there is less information in the literature about the involvement of complex II in supercomplexes than the other ETC complexes, a recent report has suggested that complex II can associate with complexes III and IV or with complexes I, III, and IV to form supercomplexes (21). Therefore, as with complex I/III, the addition of decylubiquinone may increase the rate at which electrons are transferred between complex II and complex III in supercomplexes, increasing the rate of complex II/III activity.
The inhibition thresholds provide information on the level by which the activity of a complex can be inhibited before detrimental effects are seen on synaptosomal oxygen consumption. We showed previously that complex I can be inhibited up to 10% before major effects on synaptosomal oxygen consumption are observed (22). This is a low threshold showing that the activity of complex I is very important in maintaining adequate synaptosomal oxygen consumption. In the current study, a low complex I threshold of 15% was reported in the presence of decylubiquinone. The complex I inhibition threshold appears to decrease more slowly in the presence of decylubiquinone than in its absence, which suggests that decylubiquinone may have the ability to attenuate reduction in oxygen consumption rates associated with reduced complex I activity. Complex I activity is reduced by 30–40% in the substantia nigra and frontal cortex in Parkinson's disease (23, 24). In the present study, at 40% inhibition of complex I activity, ∼40% synaptosomal oxygen consumption remained in the absence of decylubiquinone, in contrast to ∼70% in the presence of decylubiquinone, suggesting that decylubiquinone may have a protective effect in this situation.
When myxothiazol was used to inhibit complex III, the inhibition thresholds for complexes I/III, II/III, and III in the presence of decylubiquinone were all higher than those without decylubiquinone, which may be of interest when considering treatments for disorders involving complex III deficiencies. This observation may be explained by the apparent protective effect of decylubiquinone on synaptosomal oxygen consumption at high concentrations of myxothiazol. Therefore, higher levels of complex III inhibition were required to bring about deleterious effects on synaptosomal oxygen consumption. Investigation of this effect with an alternative complex III inhibitor, antimycin A, reported results similar to those with myxothiazol. Decylubiquinone maintained synaptosomal oxygen consumption rates in the presence of high concentrations of antimycin A. Considering the observation that myxothiazol and antimycin A inhibit at alternative sites in the Q cycle in complex III (25), the site of inhibition at complex III was irrelevant with regard to the effects of decylubiquinone on oxygen consumption rates.
Decylubiquinone remains largely in its reduced form, decylubiquinol, in rat liver mitochondria that are respiring on succinate (26). It may be the case that decylubiquinol can interfere with myxothiazol partitioning into complex III, thereby affecting the inhibition of complex III. This would attenuate the inhibition of oxygen consumption at higher concentrations of myxothiazol. In this case, decylubiquinol would also lessen the reduction of complex III activity by myxothiazol; however, decylubiquinone did not affect complex I/III, complex II/III, or complex III activities at higher concentrations of myxothiazol. This implies that myxothiazol is gaining access to complex III to the same extent in the absence and in the presence of decylubiquinone. If decylubiquinone is not protecting oxygen consumption through decylubiquinol competition with myxothiazol, it may be the case that decylubiquinone enhances oxygen consumption by increasing electron flow through the ETC, which brings about elevated rates of oxygen reduction at complex IV. Decylubiquinone may maintain the flux of electrons from complex III to cytochrome c, which could increase the rate of oxygen consumption, even in the presence of myxothiazol, because myxothiazol has its actions before the transfer of electrons from complex III to cytochrome c.
Complex I/III (titrated with myxothiazol) and complex II/III inhibition thresholds appear to switch from type II threshold curves, in the absence of decylubiquinone, to type I threshold curves in the presence of decylubiquinone. A type I curve is characterized by a plateau phase which, at a point, decreases sharply and rapidly allowing the threshold to be precisely calculated (27). A type II threshold is defined as a curve that does not fall as steeply or quickly as a type I curve, making the determination of the threshold less straightforward (27). Switching between type II and type I curves was observed previously when the substrate available to rat liver mitochondria was changed from succinate to pyruvate (27). Alteration between type II and type I curves can occur as a result of changes in the activity of the enzyme so that it becomes available in excess or so that its activity is up-regulated, accounting for the plateau phase. In this study, it could be the case that decylubiquinone increases the substrate available to complex III, thereby sustaining complex III activity for longer than in the absence of decylubiquinone.
Inhibition thresholds can be used to postulate the effects of a drug on mitochondrial function. From the results in this study, it appears that decylubiquinone may have advantageous effects in diseases in which deficiencies in complexes I, I/III, II/III, and III have been reported. Decylubiquinone altered the appearance of the complex I threshold so that synaptosomal oxygen consumption did not fall as rapidly as in the absence of decylubiquinone. Therefore, decylubiquinone may have beneficial effects on oxygen consumption in the nerve terminal at certain levels of complex I inhibition as seen in Parkinson disease. The pathogenesis of certain mitochondrial diseases, such as Leber hereditary optic neuropathy (LHON), mitochondrial encephalomyopathy, lactic acidosis, and stroke-like syndrome (MELAS), and myoclonic epilepsy associated with ragged-red fibers (MERRF) has been shown to involve mutations in genes that encode for certain ETC complex subunits, in particular the subunits of complex I (28–30). A number of mutations have been shown to occur in LHON, with one mutation in particular, G3460A, associated with reduced complex I activity of 60–80% (31, 32). Complex I activity was reduced in fibroblasts from MERRF and MELAS patients by 24 and 78%, respectively (33). The results in the present study suggest that decylubiquinone may have beneficial effects in these diseases by attenuating oxygen consumption rates during complex I inhibition. We have shown previously that low concentrations of the complex I inhibitor, rotenone, brought about depolarization of mitochondrial membrane potential, reduced ATP levels and increased glutamate release from depolarized rat brain synaptosomes (34), which may be ameliorated by the addition of decylubiquinone.
There are numerous reports of alterations in respiratory chain complex activities with aging. The activity of complex I has been reported as being lower in aged rat brain mitochondria (35), complex I/III activity was reduced by 48% in brain mitochondria of aged mice (36), and the activities of complexes II and III were significantly lower in aged mouse brain mitochondria than in young samples (37). Previously, we have demonstrated the occurrence of an age-related decrease in complex II/III activity in in situ rat brain nerve terminal mitochondria (38). In the present study, decylubiquinone increased the inhibition thresholds for complexes I/III, II/III, and III, suggesting that decylubiquinone may induce advantageous effects in age-related diseases and in disorders involving deficiencies of these ETC enzymes, by maintaining sufficient oxygen consumption at higher levels of complex III inhibition than in the absence of decylubiquinone treatment.
Acknowledgment
We thank Martha Motherway Gildea for technical assistance.
This work was supported by the Programme for Research in Third-level Institutions, Science Foundation Ireland, and Marie Curie Transfer of Knowledge Grant MTKD-CT-2005-030005.
- ETC
- electron transport chain
- LHON
- Leber hereditary optic neuropathy
- MELAS
- mitochondrial encephalomyopathy lactic acidosis and stroke-like syndrome
- MERRF
- myoclonic epilepsy associated with ragged-red fibers.
REFERENCES
- 1.Cleren C., Yang L., Lorenzo B., Calingasan N. Y., Schomer A., Sireci A., Wille E. J., Beal M. F. (2008) J. Neurochem. 104, 1613–1621 [DOI] [PubMed] [Google Scholar]
- 2.Beal M. F., Matthews R. T., Tieleman A., Shults C. W. (1998) Brain Res. 783, 109–114 [DOI] [PubMed] [Google Scholar]
- 3.Moon Y., Lee K. H., Park J. H., Geum D., Kim K. (2005) J. Neurochem. 93, 1199–1208 [DOI] [PubMed] [Google Scholar]
- 4.Smith K. M., Matson S., Matson W. R., Cormier K., Del Signore S. J., Hagerty S. W., Stack E. C., Ryu H., Ferrante R. J. (2006) Biochim. Biophys. Acta 1762, 616–626 [DOI] [PubMed] [Google Scholar]
- 5.Shults C. W. (2005) Pharmacol. Ther. 107, 120–130 [DOI] [PubMed] [Google Scholar]
- 6.Galpern W. R., Cudkowicz M. E. (2007) Mitochondrion 7, (suppl.) S146–S153 [DOI] [PubMed] [Google Scholar]
- 7.Lenaz G., Parenti Castelli G., Fato D'Aurelio M., Bovina C., Formiggini G., Marchetti M., Estornell E., Rauchova H. (1997) Mol. Aspects Med. 18, (suppl.) S25–S31 [DOI] [PubMed] [Google Scholar]
- 8.Hano N., Nakashima Y., Shinzawa-Itoh K., Yoshikawa S. (2003) J. Bioenerg. Biomembr. 35, 257–265 [DOI] [PubMed] [Google Scholar]
- 9.Degli Esposti M., Ngo A., McMullen G. L., Ghelli A., Sparla F., Benelli B., Ratta M., Linnane A. W. (1996) Biochem. J. 313, 327–334 [DOI] [PMC free article] [PubMed] [Google Scholar]
- 10.Kacser H., Burns J. A. (1973) Symp. Soc. Exp. Biol. 27, 65–104 [PubMed] [Google Scholar]
- 11.Heinrich R., Rapoport T. A. (1974) Eur. J. Biochem. 42, 89–95 [DOI] [PubMed] [Google Scholar]
- 12.Lai J. C., Clark J. B. (1976) Biochem. J. 154, 423–432 [DOI] [PMC free article] [PubMed] [Google Scholar]
- 13.Bradford M. M. (1976) Anal. Biochem. 72, 248–254 [DOI] [PubMed] [Google Scholar]
- 14.Ragan C. I., Wilson M. T., Darley-Usmar V. M., Lowe P. N. (1987) Mitochondria, A Practical Approach (Darley-Usmar V. M., Rickwood D., Wilson M. T. eds) pp. 79–112, IRL Press at Oxford University Press, Oxford, UK [Google Scholar]
- 15.Powers W. J., Haas R. H., Le T., Videen T. O., Hershey T., McGee-Minnich L., Perlmutter J. S. (2007) Neurobiol. Dis. 27, 99–101 [DOI] [PMC free article] [PubMed] [Google Scholar]
- 16.King T. S. (1967) Methods Enzymol. 10, 217–235 [Google Scholar]
- 17.Wharton D. C., Tzagoloff A. (1967) Methods Enzymol. 10, 245–250 [Google Scholar]
- 18.Ogasahara S., Engel A. G., Frens D., Mack D. (1989) Proc. Natl. Acad. Sci. U.S.A. 86, 2379–2382 [DOI] [PMC free article] [PubMed] [Google Scholar]
- 19.Schägger H., Pfeiffer K. (2001) J. Biol. Chem. 276, 37861–37867 [DOI] [PubMed] [Google Scholar]
- 20.Schägger H., Pfeiffer K. (2000) EMBO J. 19, 1777–1783 [DOI] [PMC free article] [PubMed] [Google Scholar]
- 21.Acín-Pérez R., Fernández-Silva P., Peleato M. L., Pérez-Martos A., Enriquez J. A. (2008) Mol. Cell 32, 529–539 [DOI] [PubMed] [Google Scholar]
- 22.Telford J. E., Kilbride S. M., Davey G. P. (2009) J. Biol. Chem. 284, 9109–9114 [DOI] [PMC free article] [PubMed] [Google Scholar]
- 23.Schapira A. H., Cooper J. M., Dexter D., Clark J. B., Jenner P., Marsden C. D. (1990) J. Neurochem. 54, 823–827 [DOI] [PubMed] [Google Scholar]
- 24.Parker W. D., Jr., Parks J. K., Swerdlow R. H. (2008) Brain Res. 1189, 215–218 [DOI] [PMC free article] [PubMed] [Google Scholar]
- 25.von Jagow G., Ljungdahl P. O., Graf P., Ohnishi T., Trumpower B. L. (1984) J. Biol. Chem. 259, 6318–6326 [PubMed] [Google Scholar]
- 26.James A. M., Cochemé H. M., Smith R. A., Murphy M. P. (2005) J. Biol. Chem. 280, 21295–21312 [DOI] [PubMed] [Google Scholar]
- 27.Rossignol R., Malgat M., Mazat J. P., Letellier T. (1999) J. Biol. Chem. 274, 33426–33432 [DOI] [PubMed] [Google Scholar]
- 28.Mackey D. A., Oostra R. J., Rosenberg T., Nikoskelainen E., Bronte-Stewart J., Poulton J., Harding A. E., Govan G., Bolhuis P. A., Norby S. (1996) Am. J. Hum. Genet. 59, 481–485 [PMC free article] [PubMed] [Google Scholar]
- 29.Shoffner J. M., Lott M. T., Lezza A. M., Seibel P., Ballinger S. W., Wallace D. C. (1990) Cell 61, 931–937 [DOI] [PubMed] [Google Scholar]
- 30.Wong L. J. (2007) Muscle Nerve 36, 279–293 [DOI] [PubMed] [Google Scholar]
- 31.Brown M. D., Trounce I. A., Jun A. S., Allen J. C., Wallace D. C. (2000) J. Biol. Chem. 275, 39831–39836 [DOI] [PubMed] [Google Scholar]
- 32.Lenaz G., Baracca A., Carelli V., D'Aurelio M., Sgarbi G., Solaini G. (2004) Biochim. Biophys. Acta 1658, 89–94 [DOI] [PubMed] [Google Scholar]
- 33.James A. M., Wei Y. H., Pang C. Y., Murphy M. P. (1996) Biochem. J. 318, 401–407 [DOI] [PMC free article] [PubMed] [Google Scholar]
- 34.Kilbride S. M., Telford J. E., Tipton K. F., Davey G. P. (2008) J. Neurochem. 106, 826–834 [DOI] [PubMed] [Google Scholar]
- 35.Navarro A., Boveris A. (2004) Am. J. Physiol. Regul. Integr. Comp. Physiol. 287, R1244–R1249 [DOI] [PubMed] [Google Scholar]
- 36.Navarro A., Sánchez Del Pino M. J., Gómez C., Peralta J. L., Boveris A. (2002) Am. J. Physiol. Regul. Integr. Comp. Physiol. 282, R985–R992 [DOI] [PubMed] [Google Scholar]
- 37.Kwong L. K., Sohal R. S. (2000) Arch. Biochem. Biophys 373, 16–22 [DOI] [PubMed] [Google Scholar]
- 38.Kilbride S. M., Telford J. E., Davey G. P. (2008) Biochim. Biophys. Acta 1777, 783–788 [DOI] [PubMed] [Google Scholar]


