Abstract
We consider natural and artificial hygromorphs, objects that respond to environmental humidity by changing their shape. Using the pine cone as an example that opens when dried and closes when wet, we quantify the geometry, mechanics and dynamics of closure and opening at the cell, tissue and organ levels, building on our prior structural knowledge. A simple scaling theory allows us to quantify the hysteretic dynamics of opening and closing. We also show how simple bilayer hygromorphs of paper and polymer show similar behaviour that can be quantified via a theory which couples fluid transport in a porous medium and evaporative flux to mechanics and geometry. Our work unifies varied observations of natural hygromorphs and suggests interesting biomimetic analogues, which we illustrate using an artificial flower with a controllable blooming and closing response.
Keywords: pine cone, swelling, wicking, biomimetics
1. Introduction
Many natural and artificial materials respond to changes in environmental humidity by shrinking or swelling. The implications of this mundane observation can be seen in situations as varied as the formation of cracks in drying mud (Shorlin et al. 2000), the shrinking and swelling of wood in a variety of situations from its role in sealing boat hulls to the warping of wooden floors, the rippling of moistened paper, the curling of fallen drying leaves, the wrinkling of wet skin, the wilting of flowers, the movement of wheat awns (Elbaum et al. 2007), the self-burial of certain seeds (Erodium cicutarium; Stamp 1984) and the shrinkage of certain mosses (Funaria hygrometrica; Arnold 1899).
A common example of a robust natural hygromorph is the pine cone, famous for the static phyllotactic patterns of its scales. While tree-bound cones are closed, fallen cones are invariably open. But when dead fallen dry cones are moved into a humid environment, they close and open again when dried, an experiment that may be repeated many times. Here, we use this example to first explore the dynamics of shape change at the organ, tissue and cellular levels and use a simple model inspired by the thermomechanics of the bimetallic strip to quantify our observations and compare the behaviour of cones that range in size from a few millimetres to 30 cm. Inspired by pine cones, we also build bilayer hygromorphs of a thin layer of plastic attached to paper which curl upon drying and straighten on wetting. We quantify the dynamics of these biomimetic hygromorphs by considering the mechanics of flow through a porous medium with an evaporative flux and compare the theory with experimental observations. We conclude with a discussion of the large geometrical amplification provided by slender bodies in hygromorphs.
2. Pine cones
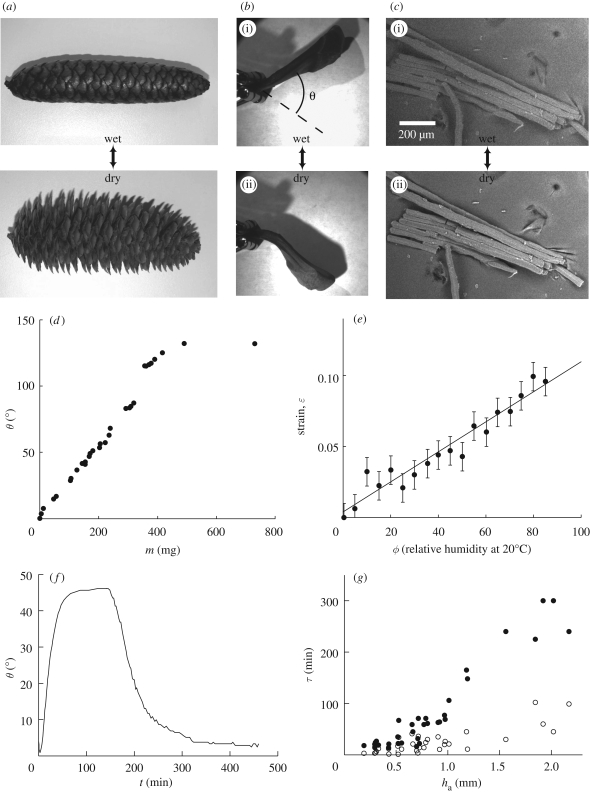
Pine cones offer a common example of how a structured tissue responds to an environmental stimulus. A change in the relative humidity causes a closed, tightly packed cone to open gradually (electronic supplementary material, movies S1 and S2), as shown in figure 1a. The mechanism leading to cone opening when dried (and closing when wetted) relies on the bilayered structure of the individual scales that change conformation when the environmental humidity is changed (electronic supplementary material, movie S3). In figure 1b, we show that the deformation is localized to a small region close to where the scale is attached to the midrib of the cone while the rest of the scale simply amplifies this motion geometrically. In this active outer layer of tissue, closely packed long parallel thick-walled cells respond by expanding longitudinally when exposed to humidity (Harlow et al. 1964; Dawson et al. 1997), and shrinking when dried, while the inner passive layer does not respond as strongly. Consequently, the tissue behaves like a thermally actuated bimetallic strip that curves in response to temperature changes because of the differential expansion of the constituent strips that are glued together.
Figure 1.
(a) Cone from Picea abies in its wet (closed) and dry (open) states. (b) Cone scale in its wet (i) and dry (ii) states. We call θ the angular position of the scale, the dry state being chosen as a reference (θ = 0°). (c) Environmental scanning electron microscopy (ESEM) images of a few cells from the responsive tissue of a scale of Pinus coulteri. The cells are about 20 per cent longer in the wet state (i) than in a dry environment (ii). (d) Opening angle of a scale of P. coulteri as a function of its water content. The reference of angle is chosen for a dry sample. (e) Single-cell ESEM measurements of strain–humidity relationship in the active tissue of a scale of P. coulteri. Strains are measured along the axis of the cells, the radial expansion being negligible. The line is a linear fit to the data with equation ε = 0.0011ϕ + 0.0033. (f) Plot of the opening angle θ of a scale versus time, when immersed in water and then drying in ambient air. The opened (dry) position was chosen to be the zero angle reference. (g) Opening and closing times of scales of different sizes as a function of the thickness ha of external (i.e. responsive) layer of cells. Filled circles are for opening times (in a 20°C and 40% humidity environment) and open circles for closing times.
In figure 1d, we show that a scale from a cone of Pinus coulteri can rotate by angles as large as 100° when the relative humidity of the active tissue (measured by weighing the scale with an Ohaus Adventurer AR1530 balance) drops from saturation to almost zero. This macroscopic change is related to the microscopic humidity-induced strain in the tissue cells; our measurements at the individual cell level in an environmental scanning electron microscope (figure 1c) show that the hygrometric expansion coefficient of the cells that characterizes the strain per relative humidity α = 0.001 ± 0.0001 (figure 1e), in agreement with measurements at the macroscopic scale (Harlow et al. 1964). We note that α measures the expansion of the cells along their axis; no significant strain was measured in the radial direction. This is consistent with the observation of stiffening fibres wound helically around the cell wall that prevent the cell from increasing its girth. Furthermore, over this humidity range, the expansion of the passive layer in the tissue was also found to be negligible. To understand the equilibrium bending of the tissue bilayer, we adapt the theory of bimetallic thermostats to hygrometry sensors (Timoshenko 1925), as the actuation mechanism of pine cone scales relies on the same principle, with humidity replacing temperature. We assume that the thicknesses of the constituent passive and active layers are hp and ha (with a total thickness h = hp + ha), their Young's moduli are Ep and Ea and the linear hygrometric expansion coefficients are αp and αa, assumed to be independent of the humidity ϕ. Under a change Δϕ of the relative humidity ϕ, the strain of an unconstrained layer of material i is then given by αiΔϕ. If α = αa − αp ≠ 0, the differential expansion of both layers results in bending of the strip.
In the absence of external forces, all forces acting on any cross section of the bilayer must be in equilibrium
| 2.1 |
 |
2.2 |
where Fp and Fa are the axial forces. If Mp and Ma are the bending moments in each of the layers, and the bending rigidity (per unit width) of both layers is Ephp3/12 and Eaha3/12, torque balance requires that
 |
2.3 |
where Δκ is the curvature change of the bilayer. Finally, the displacement of both layers must be equal at the contact surface of both layers so that
 |
2.4 |
Combining equations (2.2)–(2.4) yields the change in curvature due to a change Δϕ in relative humidity
 |
2.5 |
where
 |
2.6 |
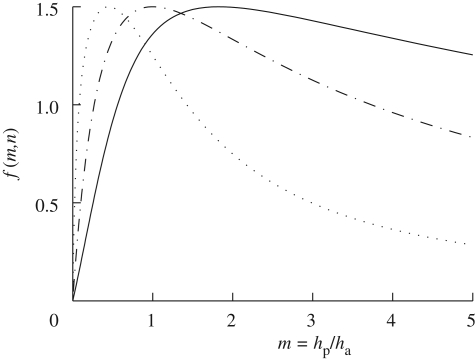
and m = hp/ha, n = Ep/Ea. In figure 2, we plot f(m,n) as a function of the thickness ratio m for different values of the moduli ratio n. We note that for strips of comparable thicknesses (m = 1), f(m,n) changes by less than 10 per cent when n varies from 0.3 to 3.5. In the limit where n is 0 or +∞, one of the layers is infinitely more rigid than the other, and f(m,n) = 0: no bending occurs.
Figure 2.
The dimensionless factor f(m,n) characterizing the curvature change (see equations (2.5) and (2.6)) as a function of the ratio of thickness of the passive layer to the active layer m = hp/ha and the ratio of the Young's moduli n = Ep/Ea = 0.3 (solid line), 1 (dashed-dotted line) and 5 (dotted line). For strips of comparable thickness (m = 1), the prefactor is not very sensitive to changes in n: f(m,n) changes by less than 20 per cent when n varies from 0.3 to 5.
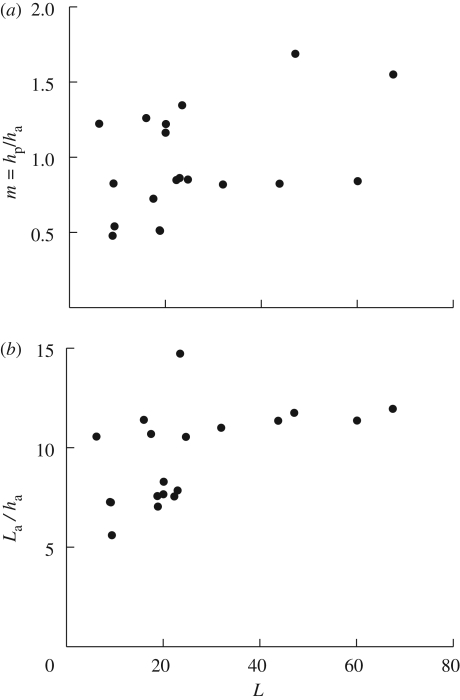
To compare this analytical result with our observations of pine cones, we measured the thicknesses of the layers of pine cone tissues and the length of the active zone for a range of cones. In figure 3, we show the results of these measurements and note that the thickness ratio m = hp/ha ≃ 1, while the length of the active zone La ≃ 10ha. Prior experimental measurements of the moduli of the bilayer tissues (Dawson et al. 1997) suggest that n ≃ 5, so that from equation (2.6) it follows that f(m,n) ≃ 1.3. Then the expected curvature change of the scale is Δκ ∼ 1.3 cm−1 (for h ∼ 1 mm and Δϕ = 100, i.e. relative humidity changing from zero to saturation), and the angular amplitude Δθ is ΔκLa, where La is the length of the deforming region of the scales. As f(m,n) ∼ 1.3 and La/h ∼ 10 is roughly invariant across samples and species as shown in figure 3, Δθ ∼ 75° under similar conditions for scales from different pine cones. The observed invariance of these geometrical parameters implies that the amplitude of the movements of the scales of the cone is invariant. This in turn implies that the release mechanism of the seeds is equally efficient for different cone species and sizes and suggests a simple design principle based on isometry.
Figure 3.
(a) Ratio m of thicknesses and (b) aspect ratio La/ha as a function of the length L of scales from different pine cones. Although the data are strongly scattered, both m and La/ha are found to be weakly dependent on the scale's size L.
We now move from the constant-humidity equilibrium response of the material at the cellular and tissue levels to the kinetics of swelling and shrinking. In a typical experiment, the pine scale is fully saturated with water and then allowed to dry in ambient air at 22°C and 40 per cent relative humidity, and figure 1f shows the evolution of the opening angle of a scale versus time. Repeating the experiment with cone scales from the different species (see electronic supplementary material) yields swelling and drying times ranging from a few minutes to a few hours as shown in figure 1g, increasing monotonically with the thickness ha of the active hygroscopic tissue of the scale. This is consistent with simple dimensional considerations that dictate that the time required for water to penetrate tissues increases with their thickness, in qualitative agreement with a capillary imbibition mechanism for water transport in porous media. Gravitational effects are negligible at the small scales we are dealing with here, so that wicking arises from a balance between surface tension forces that drive the process and viscous processes that resist it (Washburn 1921): the imbibition time scale τ ∼ h2/D, where h is the size of the porous sample and D ∼ γℓp/η is the diffusion constant constructed from the interfacial tension of the liquid in the pores γ, the pore size ℓp and the viscosity of the pore fluid η. For molecular pores, D ∼ 10−9 m2 s−1, the thickness of the active layer ha ∼ 1 mm and τ = ha2/D ∼ 1000 s, in the range of experimental results shown by the open symbols in figure 1g. However, when the data are fitted by a power law, the shrinking (drying) time varies as τd = 96ha1.5 min and the swelling (wetting) time varies as τd = 29ha1.3 min (where ha is in mm), quite different from the Washburn law. This large difference between drying and wetting is to be expected due to the different mechanisms responsible for these processes; liquid water is driven by capillary forces while wetting, while drying is dominated by the slow diffusion of vapour through pores at late stages, which leads to large variations in the effective diffusion coefficient in drying porous media (Pel et al. 1996; Lockington et al. 2003). The coupling of large strains (up to 20%) to water transport and localization of viscous dissipation at a bottleneck in the material may account for this discrepancy in the wetting stage; indeed, when a bottleneck of size lb dominates water transport, we expect τ ∼ halb/D. As drying and wetting in heterogeneous structures are crucially dependent on the distribution of pore structure and connectivity at long times (Delker et al. 1996), the large heterogeneity in the drying response seen in our experiments is probably due in part to the heterogeneities in tissue structure from one species to another, combined with the multiplicity of water transport mechanisms, and currently does not allow us to go easily much beyond a scaling approach.
3. Biomimetic bilayers
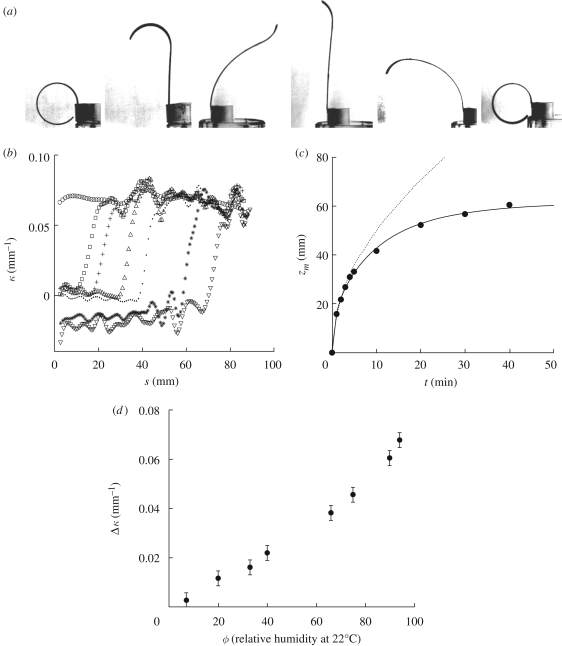
Inspired by these natural hygromorphs, to study the dynamics of wetting and drying quantitatively, we built active biomimetic bilayer structures with controllable characteristics. A simple model consists of a naturally flat piece of paper about 5 cm long, 5 mm wide and 0.3 mm thick glued with epoxy onto a flat strip of polymer. Here the active material is cellulosic paper that swells while softening in a moist environment and shrinks while stiffening in a dry atmosphere. In contrast, the passive polymer layer is insensitive to humidity changes. In a dry atmosphere, the bilayer bends with the papered side inwards (figure 4a), while in humid environments, its curvature is reversed, albeit very slightly, as wet paper is relatively soft compared with the naturally flat plastic layer. The first wetting and drying cycle ‘wears-in’ the system and leaves the dried bilayer in a curved state. Subsequent cycles lead to repeatable and reproducible behaviour (electronic supplementary material, movies S4 and S5); when one end of the bilayer is dipped in a water reservoir, the curved bilayer straightens when it absorbs water and swells, but dries and closes when removed from the reservoir. Though the planar bilayer exhibits relatively simple morphologies during wetting and drying, the transient paths from one stationary state (when wet, say) to the other (when dry, say) can be complex. For example, during wetting, the end of the strip in the water reservoir is almost straight, while the free dry end remains curved. In contrast, during drying, homogeneous evaporation over the entire paper surface leads to a uniform water content everywhere, so that the time-dependent curvature is constant along the strip. The temporal complexity of the shapes thus arises from the inhomogeneous distribution of water either along the strip or across its thickness.
Figure 4.
(a) Paper–plastic bilayers are sensitive to humidity. When one extremity is put in contact with a water bath, water invades the texture by capillarity, inducing a change in the curvature (first three pictures in (a)). The drying process is homogeneous, making the curvature of the structure to be the same along the strip (last three pictures in (a)). The first three pictures were taken 0, 9 and 100 min after contact with the water bath. The last ones were taken 8, 12 and 50 min after the beginning of the drying process. (b) Curvature measured along the bilayer, as a function of the distance s to the water bath. s = 0 is the position of the bath. Circle, 0 min; square, 1 min; plus, 2 min; triangle, 5 min; dot, 10 min; star, 40 min; inverted triangle, 119 min. (c) Impregnated length zm of a strip as a function of the time after contact with a water bath. The wicking process saturates due to evaporation. The full line is a fit of the experimental data (filled circles) with equation (3.2). The dotted line corresponds to the Washburn law in the absence of evaporation. (d) Curvature variation of a bilayer as a function of the relative humidity of the atmosphere.
To quantify the water movements during wetting and drying, we place one end of the bilayer in contact with a water reservoir, so that a wet front progresses along the paper driven by capillary imbibition through the porous structure. The driving force is of order γℓp per pore in the strip, ℓp being the typical pore size of the absorbing medium, while the viscous resistance to flow through the narrow pores at height z from the reservoir on a segment dz of the strip is of order ηv(z)dz, where v(z) is the mean velocity at location z. Then force balance yields
 |
3.1 |
where zm is the position of the wetting front. However, evaporation from the exposed, wet paper surface implies that the dynamics of wicking is altered. Assuming a constant areal flux of water at a rate J from the wetted paper surface implies that the velocity of liquid is an affine function of the distance to the wetting front: v(z) = v(zm) + J(zm − z)/hp = żm + J(zm − z)/hp, where hp is the thickness of the paper layer. Then equation (3.1) reads D = żmzm + (δ/2)zm2, with D = γℓp/η and δ = J/hp. Integrating this last equation yields1
 |
3.2 |
in good agreement with our experiments on the progression of the wetting front shown in figure 4c. At short times, i.e. t ≪ δ, zm =  , which is the so-called Washburn law (Bell & Cameron 1906; Lucas 1918; Washburn 1921), while at longer times, evaporation limits the impregnated length to
 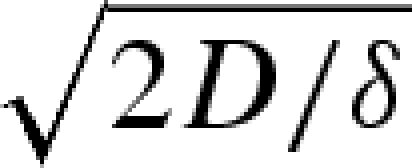 . The observed shapes of these artificial hygromorphs then result from the local strain in the bilayer, which is simply slaved to the water content in the structure; solving for the shape of the hygromorph simply requires determining the local curvature in terms of the theory of bimetallic strips (Timoshenko 1925), which we will not pursue here in detail. Qualitatively, the hygrometric expansion coefficient α ≃ 4 × 10⁻⁴, while the thickness of the polymeric part of the bilayer hp = 200 µm and the thickness of the hygroscopically active paper is ha = 100 µm so that m = 2 and h = 300 µm. The experimentally measured stiffness of the materials of both layers yields n ≃ 0.4. Knowing α, m and n for these devices yields an expected curvature change of about 0.19 mm−1 comparable to the experimental observations in figure 4d. The slender geometry of the biomimetic hygromorph (hpaper ∼ 0.1hcone) compensates for the weak hygroscopic response of paper (αpaper ∼ 0.1αcone), so that comparable curvatures are seen in both the natural and artificial hygromorphs. While drying, the papered region loses water uniformly and thus shrinks uniformly, so that the entire strip now curls with a constant curvature that varies in time, as here again the shape of the hygromorph is slaved to the water content in the structure.
4. Discussion
The pine cone with a hygromorphic hinge and the continuously deformable slender bilayer are examples of how geometric amplification of motion is achieved in a long, thin sheet or filament by coupling deformation to swelling or shrinkage in the transverse direction. This is a design that is repeatedly used in nature in seed dispersal and burial strategies, and elsewhere, and our results suggest a simple design principle that nature has converged on in the context of pine cones—isometric scaling implies an efficient mechanism for opening and thus seed dispersal. Our experiments on pine cones also suggest designs for bioinspired sensors or actuators that respond to environmental variations in humidity using responsive materials. Here, we limit ourselves to an amusing toy by creating an artificial flower with a dynamically controllable blooming and closing response. In figure 5, we show our system of a few paper–plastic bilayer petals, with the paper on the inside. When the flower is dipped in water it blooms, while when left to dry it closes (electronic supplementary material, movies S6 and S7).
Figure 5.
A floral mimic made of paper–plastic bilayer petals shows a controllable blooming and wilting response. When dipped in water, the petals open and the flower blooms, while when the water supply is exhausted, the bilayer dries out and the flower closes (see electronic supplementary material, movies S6 and S7). The length of the petals is about 4 cm, and the typical time scale of a cycle is an hour.
Natural pine cones and their biomimetic counterparts including the simple floral mimic are driven passively by environmental humidity variations; the rate of change of shape in these systems is controlled by a combination of system geometry and the mechanical and hydraulic properties of the material. Although the rate of evaporative or capillary-driven water movement in tissues is a relatively slow process with a strong asymmetry between drying and wetting, it is possible to achieve a switch-like response rather than the gradual transition that we have explored: this simply requires bilayers that are naturally doubly curved, i.e. they are shell-like. Nature has already evolved many examples of such systems such as the Venus flytrap (Forterre et al. 2005) and related examples that use actively controlled water movements within the tissue coupled to a primitive calcium-based nervous system to generate fast snapping movements. Indeed, these active hygromorphs and their passive counterparts may simply be stages in a convergent evolutionary process that uses water movements to control the geometry and dynamics of plant organs, a topic worthy of further exploration.
Acknowledgements
We thank J. Dumais and I. Kulić for fruitful discussions and D. Goldman for providing pine cone specimens and for help in identifying most samples. We acknowledge support from the French Ministry of Defense, the DARPA Programmable Matter project and the NSF-Harvard MRSEC.
Footnotes
After this work was done, J. Bico (2008, personal communication) informed us of his independent derivation of this result.
References
- Arnold W. 1899. The cord moss and its allies. Bryologist 2, 52–55. [Google Scholar]
- Bell J. M., Cameron F. K. 1906. The flow of liquids through capillary spaces. J. Phys. Chem. 10, 658–674. ( 10.1021/j150080a005) [DOI] [Google Scholar]
- Dawson C., Vincent J. F. V., Rocca A.-M. 1997. How pine cones open. Nature 390, 668 ( 10.1038/37745) [DOI] [Google Scholar]
- Delker T., Pengra D. B., Wong P.-Z. 1996. Interface pinning and the dynamics of capillary rise in porous media. Phys. Rev. Lett. 76, 2902–2905. ( 10.1103/PhysRevLett.76.2902) [DOI] [PubMed] [Google Scholar]
- Elbaum R., Zaltzman L., Burgert I., Fratzl P. 2007. The role of wheat awns in the seed dispersal unit. Science 316, 884–886. ( 10.1126/science.1140097) [DOI] [PubMed] [Google Scholar]
- Forterre Y., Skotheim J., Dumais J., Mahadevan L. 2005. How the Venus flytrap snaps. Nature 433, 421–425. ( 10.1038/nature03185) [DOI] [PubMed] [Google Scholar]
- Harlow W. M., Cote W. A., Day A. C. 1964. The opening mechanism of pine cone scales. J. Forestry 62, 538–540. [Google Scholar]
- Lockington D. A., Parlange J.-Y., Barry D. A., Leech C. A. 2003. Drying of porous building materials: hydraulic diffusivity and front propagation. Mater. Struct. 36, 448–452. ( 10.1007/BF02481524) [DOI] [Google Scholar]
- Lucas V. R. 1918. Ueber das Zeitgesetz des kapillaren Aufstiegs von Flüssigkeiten Kolloid. Zeitschrift 23, 15–22. [Google Scholar]
- Pel L., Brocken H., Kopinga K. 1996. Determination of moisture diffusivity in porous media using moisture concentration profiles. Int. J. Heat Mass Transf. 39, 1273–1280. ( 10.1016/0017-9310(95)00201-4) [DOI] [Google Scholar]
- Shorlin K. A., de Bruyn J. R., Graham M., Morris S. W. 2000. Development and geometry of isotropic and directional shrinkage-crack patterns. Phys. Rev. E 61, 6950–6957. ( 10.1103/PhysRevE.61.6950) [DOI] [PubMed] [Google Scholar]
- Stamp N. E. 1984. Self burial behavior of Erodium cicutarium seeds. J. Ecol. 72, 611–620. ( 10.2307/2260070) [DOI] [Google Scholar]
- Timoshenko S. 1925. Analysis of bi-metal thermostats. J. Opt. Soc. Am. 11, 233–255. ( 10.1364/JOSA.11.000233) [DOI] [Google Scholar]
- Washburn E. W. 1921. The dynamics of capillary flow. Phys. Rev. 17, 273–283. ( 10.1103/PhysRev.17.273) [DOI] [Google Scholar]


