

Abstract
Ruthenium nitrosyls derived from ligands containing carboxamido-N and phenolato-O donors release NO upon exposure to low power UV light. Results of theoretical calculations on a set of such nitrosyls indicate strong interactions between the ligand MOs and MOs encompassing the Ru-NO moiety that dictate the parameters of NO photolability.
Introduction
In recent years, the unique chemistry of nitric oxide (NO) has drawn much attention due to its regulatory role in several biological processes.1-6 Endogenous NO produced by nitric oxide synthase (NOS) has been shown to participate as a signaling molecule in vasodilation and neurotransmission (both in low nM concentrations)7,8 and in cell apoptosis (in high μM concentrations)9,10. These findings have spurred the development of several synthetic exogenous NO donors that mimic and even enhance the utility of endogenous NO production. For example, organic nitrites (trinitroglycerol) and S-nitrosothiols (SNAP) have been used clinically as vasodilators.11,12 These compounds are systemic donors that release NO in response to stimuli such as heat, pH change, or enzymatic activity. As a consequence, they cannot be used in site-specific controlled delivery of NO and there is a clear need for compounds that can provide high doses of NO at selected targets under controlled conditions.
The photolability of NO-containing transition metal complexes (metal nitrosyls)13 has recently been exploited in controlled delivery of NO. Among metal nitrosyls, ruthenium nitrosyls are a promising class of NO donor due to their increased thermal stability in biological media compared to other metal (Mn and Fe) nitrsoyls.14,15 Complexes such as [Ru(salen)(Cl)] (salen = N,N′-ethylenebis(salicylideneiminato) dianion), [(bpb)Ru(NO)(Cl)] (bpb = 1,2-bis(pyridine-2-carboxamido)benzene dianion), K2[Ru(NO)(Cl)5] all release NO when exposed to UV light.16,17 However, there is still a need to increase the efficiency (quantum yield) of NO release from ruthenium nitrosyls when exposed to lower energy light for delivery of NO to biological targets. Progress in this area requires understanding of the structural and electronic parameters that lead to the absorption of lower energy light in ruthenium nitrosyls.
Theoretical studies by Franco and co-works on simple {RuNO}6 nitrosyls,18 such as [Ru(NH3)5NO]2+ and [Ru(NH3)4(Cl)NO]2+, suggest that the photolability of these complexes are likely initiated by a high energy (330 nm) dπ(Ru) → π*(NO) transitions (vide infra).19,20 However, over the years, our group and others have identified several ligand characteristics that increase the efficiency of NO release from the resulting ruthenium nitrosyls.16,17 For example, the use of charged ligands like Cl− compared to neutral ligands like H2O or pyridine accelerates the release of NO in [(salen)Ru(NO) (Cl)]21 and [(Me2bpb)Ru(NO)(Cl)].22 The use of strong σ–donating anionic donors such as carboxamido-N or phenolato-O has been shown to enhance the photolability in these ruthenium nitrosyls.16 Indeed, results of theoretical studies indicate that the metal-to-ligand charge transfer (MLCT) transitions observed in the electronic absorption spectra of [(salen)Ru(NO)(Cl)] and [((OMe)2bQb)Ru(NO)(Cl)] are not purely dπ(Ru) → π*(NO) in character but mixed transitions which include some (phenoxo) → π*(NO) and (carboxamide) → π*(NO) character, respectively.23,24 It is therefore evident that the photolability of designed {RuNO}6 nitrosyls can be modulated by careful choice of ligand(s).
Scrutiny of the known photosensitive {RuNO}6 nitrosyls reveals that apart from NH3,25 most of the nitrosyls contain pyridine-N,26 phenolato-O,21,27 and carboxamido-N22,28 donors around the metal center. However, there are a limited number of theoretical studies on closely related ruthenium nitrosyls containing systematically modified multidentate ligands that examine the effects these donors. Thus, in the present study, we were interested in examining the effects of tetradentate ligands combining anionic carboxamido-N, phenolato-O donors and neutral pyridine-N donors using density functional theory (DFT) and time dependent DFT to gain insight into the roles of specific donor atoms involved in the absorption of lower energy light leading to the photorelease of NO. We have therefore synthesized three nitrosyls derived from a set of tetradentate dicarboxamide-N ligands containing zero, one, or two phenolato-O donors, namely 1,2-bis(pyridine-2-carboxamido)benzene (H2bpb),29 1-(2-hydroxybenzamido)-2-(2-pyridinecarboxamido)benzene (H3hypyb),30,31 and 1,2-bis(2-hydroxybenzamido)-benzene (H4hybeb)31 respectively (Figure 1). Herein we report the syntheses, structures, spectroscopic properties, and NO photolability of (NEt4)2[(hybeb)Ru(NO)(OEt)] (1), (PPh4)[(hypyb)Ru(NO)(OEt)] (2), and [(bpb)Ru(NO)(OEt)] (3). In addition, we report the results of Density Functional Theory (DFT) and Time Dependant DFT (TDDFT) calculations which provide insights into the electronic transition(s) associated with NO photolability in these ruthenium nitrosyls.
Figure 1.

Tetradentate dicarboxamide ligands containing zero, one, or two phenolato-O donors
Experimental Section
Materials
All chemicals were purchased from Aldrich Chemical Co. and used without further purification except for the acetylsalicyloyl chloride and quinaldic acid which were purchased from Acros Organics. The solvents were dried by standard techniques and distilled prior to use.
Syntheses of Ligands
The ligand 1,2-bis(pyridine-2-carboxamido)benzene (H2bpb) was synthesized by following literature procedure.27 Both 1,2-bis(2-hydroxybenzamido)benzene (H4hybeb) and 1-(2-hydroxybenzamido)-2-(2-pyridinecarboxamido)benzene (H3hypyb) were synthesized by methods that were modified compared to their original procedures.28,29
1,2-bis(2-hydroxybenzamido)benzene (H4hybeb)
To a solution containing 500 mg (4.6 mmol) phenylenediamine in 5 mL of dioxane was slowly added 1.83 g (9.3 mmol) of neat acetylsalicyloyl chloride. The mixture was allowed to stir for 20 h at room temperature at which point, 1 mL of conc HCl was slowly added to the solution. The pink solution was stirred for an additional 20 h, followed by addition of 40 mL of water resulting in a white precipitate. The product was filtered, washed several times with water and MeCN to remove impurities, and dried in vacuo. Yield: 1.29 g (80%). Selected IR frequencies (KBr disk, cm-1): 3281 (νNH, w), 3049 (w), 1640 (νC=O, m), 1591 (m), 1533 (vs), 1496 (s), 1313 (m), 1223 (m), 751 (s). 1H NMR (500 MHz, (CD3)2SO, δ from TMS): 11.74 (s, 2H), 10.42 (s, 2H), 8.01 (d, 2H), 8.81 (t, 2H), 7.42 (t, 2H), 7.28 (dd, 2H), 6.96 (t, 4H).
N-(2-Nitrophenyl)pyridine-2carboxamide) (Hpycan)
A batch of 1.00 g (8 mmol) of picolinic acid was weighed out into a 50 mL round bottom flask and 10 mL of thionyl chloride was added. The resulting solution changed from white to green in color. It was then heated to reflux for 3 h when the color of the solution changed to a burgundy red. Next, the excess solvent was removed and the resulting red solid was triturated 3 times with dichloromethane. The solid was then dissolved in 100 mL of THF and added dropwise to a solution containing 1.76 g (16 mmol) of triethylamine and 1.21 g (8 mmol) of 2-nitroaniline also in 100 mL of THF. The solution was stirred for 20 h and the resulting NEt3•HCl was filtered off using a Celite pad. The filtrate was condensed to half the original volume and cooled to -20° C causing the product to precipitate. The filtered product was washed 3 times each with cold ethanol and diethyl ether and dried in vacuo. Yield: 1.7 g (80%). Selected IR Frequencies (KBr disk, cm-1): 3276 (νNH, m), 1690 (νC=O, s), 1606 (s), 1580 (s), 1497 (vs), 1446 (s), 1423 (s), 1341 (s), 1271 (s), 1148 (m), 787 (m), 743 (s), 686 (m). 1H NMR (500 MHz, CDCl3, δ from TMS): 12.78 (s, 1 H), 9.06 (d, 1H), 8,76 (d, 1H), 8.30 (t, 2H), 7.95 (t, 1H), 7.74 (t, 1H), 7.54 (dd, 1H), 7.24 (t, 1H).
N-(2-Aminophenyl)pyridine-2-carboxamide (Hpyca)
A solution of 5.00 g (20.6 mmol) of Hpycan and 30 wt% of hydrogenation catalyst (10% Pd on activated carbon) was prepared in 150 mL of acetone. Dihydrogen was admitted to the reaction vessel and the mixture was stirred for 16 h under 45 atmos pressure of dihydrogen. The reaction product was then separated from the catalyst by filtration using a Celite pad and the filtrate was evaporated to dryness to yield an yellow-brown oil. The oil was dissolved in dichloromethane and hexane was slowly added under vigorous magnetic stirring until a slight precipitate formed. This solution was refrigerated overnight to allow more yellow product to precipitate. The precipitate was filtered, washed with hexane, and dried in vacuo. Yield: 3.95 g (90%). Selected IR Frequencies (KBr disk, cm-1): 3387 (νNH, m), 3314 (νNH, m), 1667 (νC=O, s), 1629 (νC=O, m), 1588 (m), 1527 (vs), 1453 (m), 1431 (m), 1315 (m), 761 (s), 696 (m), 970 (m). 1H NMR (500 MHz, CDCl3, δ from TMS): 10.89 (s, 1 H), 8.64 (d, 1H), 8.31 (d, 1H), 7.92 (t, 1H), 7.50 (d, 2H), 7.10 (t, 1H), 6.87 (t, 2H), 3.89 (s, 2 H).
1-(2-hydroxybenzamido)-2-(2-pyridinecarboxamido)benzene (H3hypyb)
A batch of 460 mg (2.4 mmol) of neat acetylsalicyloyl chloride was slowly added to a solution containing 500 mg (2.4 mmol) of Hpyca dissolved in 5 mL of dioxane. After the mixture was stirred for 20 h at room temperature, 1 mL of conc HCl was slowly added to the solution. The orange solution was stirred for 20 h followed by addition of 40 mL of water added dropwise to the stirred solution. The resulting white precipitate was filtered, washed several times with water, and dried in vacuo. Yield: 800 mg (75%). Selected IR frequencies (KBr disk, cm-1): 3252 (νNH, m), 3058 (w), 1665 (νC=O, s), 1641 (νC=O, s), 1593 (s), 1544 (vs), 1518 (vs), 1491 (s), 1339 (m), 1227 (m), 751 (vs), 692 (m). 1H NMR (500 MHz, (CD3)2SO, δ from TMS): 11.58 (s, 1H), 10.55 (s, 1H), 10.46 (s, 1H), 8.59 (d, 1H), 8.14 (d, 1H), 8.04 (t, 1H), 7.99 (d, 1H), 7.86 (d, 1H), 7.69 (d, 1H), 7.64 (t, 1H), 7.42 (t, 1H), 7.29 (dt, 2H), 6.96 (t, 2H).
Syntheses of Complexes. (NEt4)2[(hybeb)Ru(NO)(OEt)] (1)
A slurry containing 100 mg (0.3 mmol) of H4hybeb and 200 mg (1.2 mmol) NEt4Cl in 15 mL of ethanol was treated with 35 mg (1.4 mmol) of NaH under dinitrogen. The solution was then filtered to remove NaCl, producing a clear tan solution of the deprotonated ligand. Subsequently, 68 mg (0.3 mmol) of RuNOCl3 dissolved in 10 mL of degassed ethanol was added to the reaction flask under dinitrogen via cannula generating an orange brown solution. The solution was heated under refluxing condition for 24 h and then cooled to room temperature. The solution was concentrated and cooled to -20° C. Upon addition of 5 mL of diethyl ether to the cold solution, an orange solid precipitated. The solid was filtered and washed several times with diethyl ether and dried in vacuo. Yield: 52 mg (25%). Anal. Calcd. for C38H57N5O6Ru: C 58.44; H 7.36; N 8.97; found: C 58.29; H 7.15; N 8.60. Selected IR frequencies (KBr disk, cm-1): 2982 (w), 1783 (νNO, s), 1594 (νC=O, s), 1558 (s), 1526 (m), 1465 (vs), 1438 (vs), 1347 (vs), 1259 (m), 1034 (νCO, w), 761 (m). 1H NMR (500 MHz, (CD3)2SO, δ from TMS): 9.08 (dd, 2H, J = 6 & 4 Hz), 8.12 (d, 2H, J = 8 Hz), 7.01 (t, 2H, J = 8 Hz), 6.77 (d, 2H, J = 8 Hz), 6.69 (dd, 2H, J = 6 & 4 Hz), 6.44 (t, 2H, J = 8 Hz), 3.37 (q, 2H, J = 7 Hz), 3.17 (q, 12H, J = 7 Hz), 1.13 (t, 18H, J = 7 Hz), 0.48 (t, 3H, J = 7 Hz). Electronic absorption spectrum, λmax, nm (ε, M-1 cm-1) in EtOH: 320 (23 270) and in MeCN: 325 (25 000).
(PPh4)[(hypyb)Ru(NO)(OEt)] (2)
A batch of 100 mg (0.3 mmol) of H3hypyb was dissolved in 5 mL of ethanol and mixed with a solution containing 29 mg (1.2 mmol) of NaH in 5 mL ethanol to generate a light yellow solution. To this solution, 71 mg (0.3 mmol) of RuNOCl3 dissolved in 5 mL of ethanol was added dropwise and the mixture was heated to reflux for 5 h. The resulting dark red brown solution was then treated with 135 mg (0.4 mmol) of PPh4Cl. Subsequently, the solvent was removed and replaced with MeCN to filter off solid NaCl. About 5 mL of diethyl ether was added and the solution was cooled to -20° C. The mixture was filtered after 24 h to remove small quantity of an impurity. The filtrate, upon further cooling, afforded the desired product as an orange powder. The product was filtered and washed several times with diethyl ether and dried in vacuo. Yield: 120 mg (45%). Anal. Calcd. for C45H37N4O5PRu: C 63.90; H 4.41; N 6.62; found: C 63.85; H 4.31; N 6.55. Selected IR Frequencies (KBr disk, cm-1): 3052(w), 1793 (νNO, vs), 1625 (νC=O, vs), 1593 (νC=O, vs), 1557 (vs), 1534 (s), 1462 (vs), 1436 (vs), 1342 (vs), 1108 (vs), 1042 (νCO, m), 756 (vs), 723 (vs), 688 (s), 526 (vs). 1H NMR (500 MHz, CDCl3, δ from TMS): 9.06 (d, 1H, J = 8 Hz), 8.77 (d, 1H, J = 8 Hz), 8.60 (d, 1H, J = 8 Hz), 8.28 (t, 1H, J = 8 Hz), 8.15 (d, 1H, J = 8 Hz), 8.11 (d, 1H, J = 8 Hz), 7.96 (t, 4H, J = 8 Hz), 7.82 (m, 9H), 7.73 (dd, 8H, J = 1 & 8 Hz), 7.05 (t, 1H, J = 8 Hz), 6.86 (d, 1H, J = 8 Hz), 6.81 (t, 2H, J = 8 Hz), 6.46 (t, 1H, J = 8 Hz), 3.42 (q, 2H, J = 7 Hz), 0.38 (t, 3H, J = 7 Hz). Electronic absorption spectrum, λmax, nm (ε, M-1 cm-1) in EtOH: 315 (10 700) and in MeCN: 315 (9 250).
[Ru(bpb)(NO)(OEt)] (3)
A slurry of 100 mg (0.3 mmol) of H2bpb in 10 mL of ethanol was deprotonated via addition of 23 mg (0.9 mmol) of NaH dissolved in 5 mL of ethanol. A solution containing 74 mg (0.31 mmol) of RuNOCl3 in 10 mL of ethanol was added to the flask containing the deprotonated ligand. The resulting dark orange solution was heated at reflux temp for 10 h. The solution was then cooled to -20° C to precipitate impurities and filtration. The filtrate was then concentrated and 5 mL of diethyl ether was added. Upon cooling, the target complex precipitated out as an orange solid which was filtered, washed several times with diethyl ether, and dried in vacuo. Yield: 62 mg (40%). Anal. Calcd. for C20H17N5O4Ru: C 48.78; H 3.48; N 14.22; found: C 48.75; H 3.41; N 14.18. Selected IR Frequencies (KBr disk, cm-1): 2923(w), 1838 (νNO, s), 1632 (νC=O, vs), 1595 (s), 1472 (s), 1356 (s), 1286 (m), 1047 (νCO, m), 782 (w), 752 (m), 683 (w) 502 (w). 1H NMR (500 MHz, (CD3)2SO, δ from TMS): 9.34 (d, 2H, J = 6 Hz), 8.54 (dd, 2H, J = 6 & 4 Hz), 8.38 (t, 2H, J = 8 Hz), 8.19 (d, 2H, J = 8 Hz), 7.93 (t, 2H, J = 6 Hz), 7.08 (dd, 2H, J = 6 & 4 Hz), 3.34 (q, 2H, J = 7 Hz), 0.30 (t, 3H, J = 7 Hz). Electronic absorption spectrum, λmax, nm (ε, M-1 cm-1) in EtOH: 380 (7 680) and in MeCN: 380 (9 800).
Physical Measurements
The 1H NMR spectra were recorded at 298 K on a Varian Inova 500 MHz instrument. A Perkin-Elmer Spectrum-One FT-IR spectrometer was used to monitor the IR spectra of the complexes. The electronic absorption spectra were obtained with a scanning Cary 50 spectrophotometer (Varian Associates). Release of NO in aqueous solution upon illumination was monitored by using the inNO Nitric Oxide Monitoring System (Innovative Instruments, Inc.) fitted with the ami-NO 2008 electrode. The NO amperograms were recorded using stirred solutions contained in open vials. X-band electron paramagnetic resonance (EPR) spectra were obtained with a Bruker ELEXSYS 500 spectrometer at 125 K.
X-ray Crystallography
Vapor diffusion of diethyl ether into a solution of 1 in acetone afforded orange crystalline needles suitable for X-ray studies. The structure revealed that the crystal included one Na+ ion per two anions leading to a composition (NEt4)1.5Na0.5[(hybeb)Ru(NO)(OEt)]. Red orange crystals of 2, suitable for diffraction study, were obtained via vapor diffusion of diethyl ether into a solution of 2 in MeCN while vapor diffusion of pentane into a solution of 3 in THF afforded orange crystals used for the structural studies. Diffraction data for 1•EtOH, 2•MeCN, and 3 were collected at 150 K on a Bruker APEX-II instrument using monochromated Mo-Kα radiation (λ = 0.71073 Å). All diffraction data were corrected for absorption and calculations were performed using the SHELXTL (1995-99) software package (Bruker Analytical X-ray Systems Inc.) for structure solution and refinement. Additional refinement details are contained in the CIF files (Supporting Information). Instrument parameters, crystal data, and data collection parameters for all the complexes are summarized in Table 1. Selected bond distances and bond angles for 1•EtOH, 2•MeCN, and 3 are listed in Table 2.
Table 1.
Summary of Crystal Data, Intensity Collection and Refinement Parameters for (NEt4)1.5(Na)0.5[(hybeb)Ru(NO)(OEt)]•EtOH (1•EtOH), (PPh4)[(hypyb)Ru(OEt)]•MeCN (2•MeCN), and [(bpb)Ru(OEt)](3)
| 1 | 2 | 3 | |
|---|---|---|---|
| Empirical formula | C72H105N9NaO14Ru2 | C47H40N5O5PRu | C20H17N5O4Ru |
| Formula weight | 1545.78 | 886.89 | 492.46 |
| Crystal color | dark orange needles | red blocks | red-orange blocks |
| Crystal size (mm3) | 0.81×0.76 ×0.34 | 0.40×0.16×0.10 | 0.07×0.05×0.03 |
| Temperature (K) | 150(2) | 150(2) | 150(2) |
| Wavelength (Å) | 0.71073 | 0.71073 | 0.71073 |
| Crystal system | monoclinic | triclinic | orthorhombic |
| Space group | P21/n | Pī | Pnma |
| a (Å) | 11.827(2) | 9.9537(14) | 15.6611(17) |
| b (Å) | 18.817(4) | 12.5967(17) | 13.0504(14) |
| c (Å) | 33.222(7) | 17.043(2) | 9.1589(10) |
| α (deg) | 90 | 86.677(2) | 90 |
| β (deg) | 96.74(3) | 73.852(2) | 90 |
| γ (deg) | 90 | 86.616(2) | 90 |
| V (Å3) | 7342(3) | 2047.1(5) | 1871.9(4) |
| Z | 4 | 2 | 4 |
| dcal (g/cm3) | 1.398 | 1.439 | 1.747 |
| μ (mm-1) | 0.486 | 0.476 | 0.878 |
| GOFa on F2 | 1.028 | 1.043 | 1.050 |
| Final R indices | R1 = 0.0434 | R1 = 0.0400 | R1 = 0.0213 |
| [I>2σ(I)] | wR2 = 0.1183 | wR2 = 0.1018 | wR2 = 0.0513 |
| R indicesb | R1 = 0.0628 | R1 = 0.0483 | R2 = 0.0261 |
| All datac | wR2 = 0.1077 | wR2 = 0.1073 | wR2 = 0.0536 |
GOF = [Σw(|Fo|2 -|Fc|2)2/(No-Nv)]1/2 (No = number of observations, Nv = number of variables).
R1 = Σ‖Fo| - |Fc‖ / Σ|Fo|;
wR2 = [(Σw (|Fo|2- |Fc|2)2 / Σw |Fo| 2)] ½.
Table 2.
Selected bond distances (Å) and angles (deg) of 1, 2 and 3 along with the optimized DFT bond distances and bond angles for comparison
| Complex 1 | Complex 2 | Complex 3 | ||||||
|---|---|---|---|---|---|---|---|---|
| Bond Distances | ||||||||
| X-ray | DFT | X-ray | DFT | X-ray | DFT | |||
| Ru-N3 | 1.735(4) | 1.726 | Ru-N4 | 1.738(2) | 1.732 | Ru-N5 | 1.742(2) | 1.742 |
| N3-O5 | 1.168(4) | 1.173 | N4-O4 | 1.161(3) | 1.166 | N5-O3 | 1.153(2) | 1.159 |
| Ru-N1 | 2.020(3) | 2.043 | Ru-N1 | 2.019(2) | 2.008 | Ru-N1 | 1.986(1) | 1.988 |
| Ru-N2 | 2.022(3) | 2.029 | Ru-N2 | 1.985(2) | 2.002 | Ru-N2 | 1.986(1) | 1.985 |
| Ru-O1 | 2.026(3) | 2.034 | Ru-O1 | 2.024(2) | 2.029 | Ru-N3 | 2.130(1) | 2.166 |
| Ru-O4 | 2.030(3) | 2.058 | Ru-N3 | 2.107(2) | 2.127 | Ru-N4 | 2.130(1) | 2.144 |
| Ru-O6 | 1.975(3) | 1.978 | Ru-O5 | 1.973(2) | 1.975 | Ru-O4 | 1.967(2) | 1.956 |
| Bond Angles | ||||||||
| Ru-N3-O5 | 170.5(3) | 170.2 | Ru-N4-O4 | 177.6(2) | 176.6 | Ru-N5-O3 | 176.1(2) | 177.0 |
| N3-Ru-O6 | 177.1(1) | 177.0 | N4-Ru-O5 | 177.8(1) | 177.5 | N5-Ru-O4 | 175.9(1) | 175.1 |
| N1-Ru-N2 | 83.09(1) | 83.2 | N1-Ru-N2 | 83.4(1) | 83.3 | N1-Ru-N2 | 83.8(1) | 84.1 |
| O1-Ru-O4 | 82.8(1) | 84.8 | O1-Ru-N3 | 97.4(1) | 97.0 | N3-Ru-N4 | 114.9(1) | 114.3 |
| N1-Ru-O1 | 96.3(1) | 95.3 | N1-Ru-O1 | 96.8(1) | 97.6 | N1-Ru-N3 | 80.3(1) | 80.0 |
| N2-Ru-O4 | 97.0(1) | 96.2 | N2-Ru-N3 | 81.3(1) | 80.7 | N2-Ru-N4 | 80.3(1) | 80.6 |
Photolysis Experiments
The quantum yield (φ) values were obtained using a UV-transilluminator (UVP-TM-36, λmax = 302 nm; intensity, 7 mW/cm2) and IL 410 Illuminator (175 W/cm2) equipped with a high energy light filter (380 nm cutoff). Standard ferrioxalate actinometry was used to determine the quantum yield values at 300 nm (φ300) and 400 nm (φ400). Samples of 1, 2, and 3 were prepared in MeCN and placed in 4 × 10 mm quartz cuvettes, 1 cm away from the light source. All solutions were prepared to ensure sufficient absorbance (>90%) at the irradiation wavelength, and changes in electronic spectrum at 600, 700, and 800 nm for 1-3 respectively (<10% photolysis) were used to determine the extent of NO photorelease.
DFT and TDDFT Calculations
DFT calculations were carried out using the double-ζ basis set 6-311G* for all atoms except Ru, for which the quasi-relativistic Stuttgart-Dresden effective core potential (ECP) was implemented. Calculations were carried out with the aid of the program PC-GAMESS32 using the hybrid functional PBE0. For TDDFT calculations, solvent (EtOH) effects were added using the Polarized Continuum Model (PCM).33 The X-ray coordinates of 1, 2, and 3 were used as a starting point for each geometry optimization and molecular orbital (MO) energy level analysis. MOs were visualized in MacMolPlt for analysis.34 Graphical representations of TDDFT data were created by ChemCraft Software.35
Results and Discussion
Synthesis
During the past few years, we have synthesized a series of {RuNO}6 nitrosyls derived from anionic tetradentate ligands that include carboxamido-N donors along with pyridine- or quinoline-N donors such as [Me2bpb]2-, [Me2bQb]2-, or [(OMe)2bQb]2- (Figure 2).14, 22 These nitrosyls were uniformly synthesized by the reaction of RuCl3 with the deprotonated (with NaH) ligands in DMF followed by the addition of NO(g). However, as we included both carboxamido-N and phenolato-O donors in the ligand frame (as in [hybeb]4- and [hypyb]3-), surprisingly, this method did not afford the desired nitrosyls. After several attempts, it became evident to us that both the choice of solvent and the starting metal source required change. We soon discovered that the desired products could be obtained with RuNOCl3 as the starting metal salt and EtOH as solvent (use of RuNOCl3 in DMF also did not afford any product with these two ligands). One interesting outcome of using EtOH (instead of DMF) as the solvent was the isolation of the final products as the ethanolate (-OEt) bound species, namely [(hybeb)Ru(NO)(OEt)]2− (1) and [(hypyb)Ru(NO)(OEt)]− (2). In both cases, no chloride-bound nitrosyl was obtained. It is important to note that the reaction of [bpb]2- with RuNOCl3 in EtOH also afforded [(bpb)Ru(NO)(OEt)] (3) in good yield while the reaction of RuCl3 with [bpb]2- in DMF followed by addition of NO(g) afforded [(bpb)Ru(NO)(Cl)] in our previous work.20 It is thus evident that in ethanol, the ethanolate-bound nitrosyls are the predominant products particularly under the basic conditions of the synthetic procedures. This is not surprising since we have synthesized [(Me2bpb)Ru(NO)(OH)] and [(Me2bQb)Ru(NO)(OH)] in moist MeCN in presence of a base like aniline.14 Clearly, presence of a protic solvent and a base give rise to the HO- or EtO-bound nitrosyls in this type of reaction. Search of the literature also reveals that ruthenium nitrosyls such as trans-[Ru(OEt)(2mqn)2NO] (H2mqn = 2-methyl-8-quinolinol)36 and trans-(NO, OC2H5), cis-(Cl, OC2H5)-[RuCl-(OC2H5)(NO)(terpy)]PF6 (terpy = 2,2′:6′,2″-terpyridine)37 have also been synthesized in EtOH under basic conditions. It is apparent that in such reactions, Cl− ions are better leaving groups and the Ru-NO moiety prefers O-donors (trans to NO). For example, when [(bpb)Ru(NO)(Cl)] is heated to reflux in EtOH in the presence of triethylamine (as base), one obtains the EtO− bound product and NEt4Cl.
Figure 2.

Anionic tetradentate dicarboxamido-N ligands with either pyridine- or quinoline-N donors
Structures. (NEt4)1.5(Na)0.5[(hybeb)Ru(NO)(OEt)]•EtOH
The structure of the anion of 1 is shown in Figure 3 and selected structural parameters are listed in Table 2. The ruthenium center of 1 resides in a slightly distorted octahedral geometry with one of the phenolato moieties slightly raised above the rest of the [hybeb]4- ligand frame in the equatorial plane. A similar distortion is seen in ruthenium nitrosyls containing [salophen]2- type ligands.16 The average Ru-Namide bond distance (2.020 Å) of 1 is longer than that found for [(bpb)Ru(NO)(Cl)] (1.983 Å),22 presumably due to increase in charge in the equatorial plane of the ligand frame. Similarly, the average Ru-Ophenoxo bond distance (2.028 Å) is slightly longer than that noted for [(tBu2salophen)Ru(NO)(Cl)] (2.022 Å, tBu2salophen = N,N′-1,2-phenylenediaminebis(3-tert-butylsalicylideneiminato) dianion)21 which contains neutral imine-N donors in place of the charged carboxamido-N donors. In 1, the bound NO molecule is trans to the EtO− ligand and the Ru-NO distance (1.735 Å) as well as the Ru-NO bond angle (170.5°) are as expected for this type of {Ru-NO}6 nitrosyls. Finally, the Ru-OEt bond distance (1.975 Å) of 1 is longer than that observed for other ruthenium nitrosyls containing an EtO− ligand trans to NO, such as trans-[Ru(OEt)(2mqn)2NO] (1.928 Å)36 and trans-(NO, OC2H5), cis-(Cl, OC2H5)-[RuCl-(OC2H5)(NO)(terpy)]PF6 (1.943 Å).37
Figure 3.

Thermal ellipsoid (probability level 50%) plot of [(hybeb)Ru(OEt)]2- (anion of 1) with select atom-labeling. H atoms are omitted for the sake of clarity.
(PPh4)[(hypyb)Ru(NO)(OEt)] (2)
The structure of the anion of 2 is shown in Figure 4 and selected structural parameters are listed in Table 2. The deprotonated [hypyb]3- ligand is bound to the ruthenium center in the equatorial plane and the phenolato moiety is slightly out of the plane compared to the rest of ligand resulting in a slightly distorted octahedral geometry. The Ru-Ophenoxo and Ru-Namide bond distances (2.024 and 2.019 Å respectively) on the right side of the ligand frame (as shown in Figure 4) are similar to those noted in complex 1. Similarly, the Ru-Namide bond distance (1.985 Å) next to the pyridine moiety (on the left side of the ligand in Figure 4) is comparable to that noted for complex 3 (1.986 Å). However, the Ru-Npy distance of 2 (2.107 Å) is shorter than the same bond distance in complex 3 (avg value 2.130 Å). This difference could arise from distortions caused by the asymmetry of the ligand frame in 2. The EtO− ligand is bound trans to NO in the axial positions. The Ru-OEt and Ru-NO bond distances (1.973 and 1.738 Å respectively) of 2 are similar to those of 1 and the Ru-NO bond angle (177.6°) is almost linear, as expected for a {Ru-NO}6 nitrosyl.
Figure 4.

Thermal ellipsoid (probability level 50%) plot of [(hypyb)Ru(OEt)]− (anion of 2) with select atom-labeling. H atoms are omitted for the sake of clarity.
[(bpb)Ru(NO)(OEt)](3)
The structure of 3 contains a 2-fold symmetry (Figure 5) as reflected in the bond distances and angles related to the bpb2- ligand in the equatorial plane (Table 2). The Ru-Namide (1.986Å) and Ru-Npy (2.130 Å) bond distances of 3 are very similar to those of [(bpb)Ru(NO)(Cl)] (1.990 and 2.131 Å respectively).22 The presence of pyridine-N donors vs. phenolato-O donors does not appear to have any significant affect on the Ru-NO (1.742 Å) and Ru-OEt (1.967 Å) bond distances of 3 compared to those observed in 1 and 2.
Figure 5.

Thermal ellipsoid (probability level 50%) plot of [(bpb)Ru(NO)(OEt] (3) with select atom-labeling. H atoms are omitted for the sake of clarity.
Spectroscopic Properties
The carbonyl stretching frequency (νC=O) of the free ligands H4hybeb (1640 cm-1), H3hypyb (1641 and 1665 cm-1), H2bpb (1676 cm-1) all shift to lower energy upon formation of complexes 1 (1594 cm-1), 2 (1625 and 1593 cm-1), and 3 (1632 cm-1) respectively (Figure S1-S3, Supporting Information). As the charge on the deprotonated ligand decreases from [hybeb]4-to [hypyb]3- to [bpb]2-, the corresponding ruthenium nitrosyls display NO stretching frequencies (νNO) of increasing energy (1, νNO = 1783; 2 νNO = 1793; 3, νNO = 1838). This trend suggests an increase in metal to (NO)π* pi-backbonding as the overall charge of the complex increases.
All three complexes are diamagnetic (as expected for {Ru-NO}6 nitrosyls) and display narrow-width peaks in their 1H-NMR spectra in (CD3)2SO (Figure S4, Supporting Information). The symmetry of 1 and 3 is confirmed by the overlap of 1H-NMR peaks of equivalent aryl protons. Conversely, the spectrum of complex 2, which contains the asymmetric ligand [hypyb]3-, displays individual aryl protons peaks corresponding to the phenolate and pyridine moieties.
The electronic absorption spectra of 1, 2, and 3 in EtOH are shown in Figure 6. Complex 1 exhibits an absorption band at 320 nm with the highest extinction coefficient value of the three complexes. Two smaller absorption bands at 315 and 420 nm are observed in the spectrum of 2 while 3 displays an absorption band at 380 nm, similar to the spectrum of [(bpb)Ru(NO)(Cl)].22 A more in depth discussion of the electronic transitions responsible for the absorption bands observed in these spectra is included in the DFT and TDDFT section below.
Figure 6.

Electronic absorption spectra of 1 (dashed line), 2 (solid line), 3 (dotted line) in EtOH
Photochemistry
Exposure of solutions of 1-3 to low power UV light causes rapid release of NO (as evidenced by the responses of an NO-sensitive electrode). Such NO photorelease (eq. 1) also brings about notable changes in the electronic spectra of these nitrosyls. For example, photolysis of 2 in MeCN under UV light (λmax = 302 nm; intensity, 7 mW/cm2) produces prominent changes in its absorption spectrum (Figure 7). New absorption peaks at 700 and 490 nm are generated along with a clean isosbestic point at 355 nm. As discussed before, the low energy transition at 700 nm arises from a
Figure 7.

Changes in the electronic absorption spectrum upon photolysis of 2 in MeCN following illumination with intervals of UV light. Inset: NO amperogram of 2 in H2O upon illumination with UV light for time periods as indicated.
| (1) |
ligand to metal charge transfer (LMCT) band arising from the negatively charged ligand to the Ru(III) metal center of the photoproduct [(hypyb)Ru(MeCN)(OEt)]−.38 In case of 1, the generation of a new absorption band at 540 nm and shoulder at 400 nm with an isosbestic point at 375 nm (Figure S5, Supporting Information) indicates clean release of NO upon illumination. Complex 3 also behaves similarly upon exposure to UV light. The color of the orange solution of 3 changes to blue-green and new bands at 790 and 590 nm appear in addition to an isosbestic point at 320 nm (Figure S6, Supporting Information). The photoproducts of 1, 2, and 3 all display strong EPR signals characteristic of low-spin, d5 Ru(III) metal centers. For example, the photoproduct of 3 exhibits its EPR signals with g = 2.30, 2.18, and 1.91 in MeCN glass (Figure S7, Supporting Information).
In order to study the effects of combining carboxamido-N and phenolato-O donors on the efficiency of NO photolability in this type of {Ru-NO}6 nitrosyl, we have measured the quantum yield values of 1, 2, and 3 under similar conditions at both 300 and 400 nm. In MeCN, the quantum yield values at 300 nm (φ300) for 1, 2, and 3 are 2.5%, 6.7%, and 5.1% respectively. The addition of one phenolato-O donor in 2 slightly increases its quantum yield above that of 3 which contains no phenolato-O donors. Interestingly, the addition of a second phenolato-O donor, in complex 1, lowers the quantum yield value below that of 3. When exposed to lower energy light (400 nm), only nitrosyls 2 and 3 (which contain lower energy absorption bands at 420 and 380 nm, respectively) are photoactive. The quantum yield values measured at 400 nm (φ400) for 2 (0.8%) and 3 (1.4%) reveal that both are less efficient NO donors when they are exposed to low energy light.
DFT and TDDFT Calculations
In order to elucidate how changes in the ligand frame affect the absorption of lower energy light leading to the photorelease of NO, we have performed DFT and TDDFT calculations on 1, 2, and 3. The lowest 20 calculated energy transitions are shown as a bar graph in Figure 8a. The height of each bar corresponds to the calculated oscillator strength of each transition. Descriptions of all calculated transitions can be found in the Supporting Information (Table S4). The experimental electronic absorption spectrum of each complex (solid lines) and the spectra derived from the calculated data using Lorentzian broadening (dashed lines) are also shown for comparison in Figure 8a.39 The relative intensities and wavelengths of the calculated data match very well with the corresponding experimental data and thus support the theoretical treatment.
Figure 8.
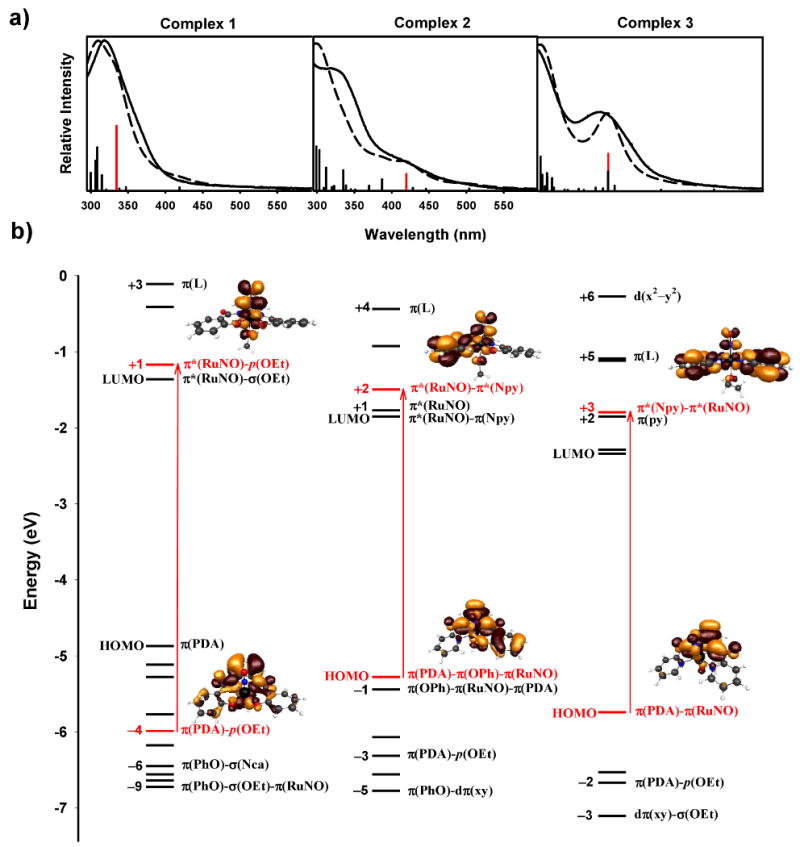
a) TDDFT calculated energy transitions and oscillator strengths (shown as vertical lines, red = major low energy transition), experimental (solid lines) and calculated (dashed lines) electronic absorption spectra. b) Calculated HOMO/LUMO energy diagram of complexes 1 (left), 2 (middle), and 3 (right). The most prominent MOs involved in the lowest energy transitions (labeled in red) and their diagrams are shown. Other orbitals involved in TDDFT calculated transitions are labeled in black.
The molecular orbital (MO) energy diagrams shown in Figure 8b summarize the electronic configuration of complexes 1, 2, and 3. The highest occupied molecular orbitals (HOMO) of all three nitrosyls are predominately derived from orbitals on the negatively charged dicarboxamido-Ns delocalized across the phenylenediamine portion of each ligand (π(PDA)). There is significant overlap of dπ(Ru)-π(NO) bonding orbitals (π(RuNO)) with the π(PDA) in the HOMO of 3 while the HOMO of 2 has only slight overlap and 1 has none. The replacement of neutral pyridine with charged phenolato donors raises the energy of the HOMO of 2 (-5.28 eV) and further in 1 (-4.87 eV) compared to that of 3 (-5.74 eV). However, only the HOMO of 2 contains phenolato π-orbital (π(PhO)) character whereas the HOMO of 1 is purely π(PDA). The corresponding π(PhO)/π(RuNO) MOs of 1 are the HOMO-1 and HOMO-2.
The lowest unoccupied molecular orbitals (LUMO) of all three nitrosyls contain dπ(Ru)-π*(NO) antibonding character (π*(RuNO)). Franco and coworkers have suggested that in ruthenium nitrosyls, MLCT transitions into π*(NO) orbitals would lead to the formation of a formal Ru(III)-NO0 moiety. From this singlet excited state, relatively efficient interconversion and intersystem crossing to lower energy triplet excited states can occur. Rapid solvation of such triplet species could be competitive with other deactivation pathways and account for NO photolability.20,40 Optimization of the lowest energy triplet excited states of 1, 2 and 3 reveal elongated Ru-NO bond lengths (1.936, 1.937, and 1.926 Å respectively) compared to those observed in the calculated singlet states (1.726, 1.732, and 1.742 Å respectively). In addition, the Ru-N-O bond angles (170°, 177°, and 177° in the singlet state for 1, 2, and 3 respectively) decrease to 139°, 140°, and 138° in the triplet state. These changes in geometry agree with a Ru(II)-NO+ to Ru(III)-NO0 transformation which would decrease the amount of π-back bonding and cause bending of the Ru-N-O bond which is characteristic of an Ru(III)-NO0 moiety.41
Diagrams of the orbitals involved the lowest energy transitions of appreciable oscillator strength for each complex are shown in Figure 8b at their corresponding energy levels (in red). All three transitions start from orbitals with some π(PDA) character and end in orbitals with π*(RuNO) antibonding character. However, considerable mixing of the π*(RuNO) with pyridine based orbitals (π(py)) is seen for 2 (-1.50 eV, LUMO+2) and 3 (-1.80 eV, LUMO+3). Interestingly, this mixing has lowered the energy of these π*(RuNO) orbitals compared to that of complex 1 (-1.17 eV, LUMO+1), which contains no pyridine donors. The most prominent low energy transition of 2 (420 nm) and 3 (380 nm) both start in their respective HOMOs. However, the higher energy π(RuNO)/π(OPh) orbitals of 1 (HOMO−1 and −2) are not involved in any of the predicted transitions. Instead, the lowest energy transition of complex 1 (334 nm) starts in the HOMO-4 which contains ethanolate oxygen non-bonding p-orbital character (p(OEt)) in addition to π(PDA).
Overall the addition of phenolato-O donors raises the energy of the highest occupied MOs while addition of pyridine donors lowers the energy of the lowest unoccupied MOs. Thus complex 2 which contains both phenolato and pyridine donors has the lowest energy transition from an occupied orbital with phenolato character into an orbital with pyridine character. In addition, complex 1 which has all charged (electron-donating) donors and no electron-accepting groups exhibits only high energy transitions. Thus it becomes apparent that the correct mix of electron-accepting and electron-donating groups in the ligand frame promotes the absorption of lower energy light in this type of ruthenium nitrosyls derived from designed ligands.
Summary and Conclusions
The following are the summary and conclusions of the present work.
Three ruthenium nitrosyls namely, (NEt4)2[(hybeb)Ru(NO)(OEt)] (1), (PPh4)[(hypyb)Ru(NO)(OEt)] (2), and [(bpb)Ru(NO)(OEt)] (3) have been synthesized and structurally characterized by X-ray crystallography. 1 and 2 are the first examples of {RuNO}6 nitrosyls containing both phenolato-O and carboxamido-N atom donors.
All three nirosyls are diamagnetic and exhibit νNO in the range 1780-1840 cm-1. They release NO upon exposure to UV light of low power (7 mW) with concomitant production of EPR active low-spin Ru(III) photoproducts of the type [(L)Ru(solv)(OEt)]n−.
The quantum yield values at 300 nm of the three nitrosyls follow the trend 2 > 3 > 1 and 3 > 2 at 400 nm.
Results of DFT and TDDFT calculations indicate that the ligand orbitals are critically involved in the transitions observed in the electronic absorption spectra of 1-3. The lowest energy transitions are from MOs with (electron-donating) phenolato and carboxamido character into orbitals with (electron-accepting) pyridine mixed with π*(RuNO) antibonding character.
Supplementary Material
Acknowledgments
Financial support from the NSF grant CHE-0553405 is gratefully acknowledged. MK and CN were supported by REU-NSF (SURF, CHE-0552641) and NIH MARC (GM 007910-29) grant, respectively. We thank Dr. Allen Oliver for help in crystallographic work. The diffraction facility at UCSC is supported by the NSF Major Research Instrumentation (MRI) program under Grant No. CHE-0521569.
Footnotes
Supporting Information Available. FTIR spectra (Figure S1, S2, and S3), 1H-NMR spectra (Figure S4), changes in the electronic absorption spectrum upon photolysis of 1 and 3 (Figure S5 and S6), EPR spectrum of the photoproduct of 3 in MeCN (Figure S7), tables of DFT parameters for 1-3 (Table S1-S7), and X-ray crystallographic data (in CIF format) for complexes 1, 2, and 3. This material is available free of charge via the Internet at http://pubs.acs.org.
References
- 1.Ignarro LJ. Nitric Oxide: Biology and Pathobiology. Academic Press; San Diego: 2000. [Google Scholar]
- 2.Kalsner S, editor. Nitric Oxide Free Radicals in Peripheral Neurotransmission. Birkhauser; Boston: 2000. [Google Scholar]
- 3.Fukuto JM, Wink DA. Met Ions Biol Syst. 1999;36:547–595. [PubMed] [Google Scholar]
- 4.Ko GY, Fang FC. Nitric Oxide and Infection. Kluwer Academic/ Plenum Publishers; New York: 1999. [Google Scholar]
- 5.Lincoln J, Burnstock G. Nitric Oxide in Health and Disease. Cambridge University Press; New York: 1997. [Google Scholar]
- 6.Feelisch M, Stamler JS, editors. Nitric Oxide Research. John Wiley and Sons; Chichester, UK: 1996. [Google Scholar]
- 7.Rosen GM, Tsai P, Pou S. Chem Rev. 2002;102:1191–1199. doi: 10.1021/cr010187s. [DOI] [PubMed] [Google Scholar]
- 8.Mocellin S, Bronte V, Nitti D. Med Res Rev. 2007;27:317–352. doi: 10.1002/med.20092. [DOI] [PubMed] [Google Scholar]
- 9.(a) Whitmore MM, DeVeer MJ, Edling A, Oates RK, Simons B, Lindner D, Williams BR. Cancer Res. 2004;64:5850–5860. doi: 10.1158/0008-5472.CAN-04-0063. [DOI] [PubMed] [Google Scholar]; (b) Shi Q, Xiong Q, Wang B, Le X, Khan NA, Xie K. Cancer Res. 2000;60:2579–2583. [PubMed] [Google Scholar]
- 10.Du C, Guan Q, Diao H, Yin Z, Jevnikar AM. Am J Physiol. 2006;290:F1044–F1054. doi: 10.1152/ajprenal.00341.2005. [DOI] [PubMed] [Google Scholar]
- 11.Wang PG, Cai TB, Taniguchi N. Nitric Oxide Donors for Pharmaceutical and Biological Applications. Wiley-VCH; Weinheim: 2005. [Google Scholar]
- 12.(a) Keefer LK. Curr Top Med Chem. 2005;5:625–636. doi: 10.2174/1568026054679380. [DOI] [PubMed] [Google Scholar]; (b) Hrabie JA, Keefer LK. Chem Rev. 2002;102:1135–1154. doi: 10.1021/cr000028t. [DOI] [PubMed] [Google Scholar]; (c) Wang K, Zhang W, Xian M, Hou YC, Chen XC, Cheng JP, Wang PG. Curr Med Chem. 2000;7:821–834. doi: 10.2174/0929867003374633. [DOI] [PubMed] [Google Scholar]
- 13.Richter-Addo GB, Legzdins P. Metal Nitrosyls. Oxford University Press; Oxford, U.K.: 1992. [Google Scholar]
- 14.Rose MJ, Fry NL, Marlow R, Hink L, Mascharak PK. J Am Chem Soc. 2008;130:8834–8846. doi: 10.1021/ja801823f. [DOI] [PubMed] [Google Scholar]
- 15.Szundi I, Rose MJ, Sen I, Eroy-Reveles AA, Mascharak PK, Einarsdóttir Ó. Photochem Photobiol. 2006;82:1377–1384. doi: 10.1562/2006-07-25-rc-984. [DOI] [PubMed] [Google Scholar]
- 16.(a) Rose MJ, Mascharak PK. Coord Chem Rev. 2008;252:2093–2114. doi: 10.1016/j.ccr.2007.11.011. [DOI] [PMC free article] [PubMed] [Google Scholar]; (b) Rose MJ, Mascharak PK. Curr Opin Chem Biol. 2008;12:238–244. doi: 10.1016/j.cbpa.2008.02.009. [DOI] [PubMed] [Google Scholar]
- 17.(a) Ford PC, Lorkovic IM. Chem Rev. 2002;102:993–1017. doi: 10.1021/cr0000271. [DOI] [PubMed] [Google Scholar]; (b) Ford PC, Bourassa J, Miranda K, Lee B, Lorkovic I, Boggs S, Kudo S, Laverman L. Coord Chem Rev. 1998;171:185–202. [Google Scholar]
- 18.The {M-NO}n notation used in this paper is that of Feltham and Enemark. See Enemark JH, Feltham RD. Coord Chem Rev. 1974;13:339–406.
- 19.Groelsky SI, da Silva SC, Lever ABP, Franco DW. Inorg Chim Acta. 2000;30:689–708. [Google Scholar]
- 20.Tfouni E, Krieger M, McGarvey BR, Franco DW. Coord Chem Rev. 2003;236:57–69. [Google Scholar]
- 21.Works CF, Jocher CJ, Bart GD, Bu X, Ford PC. Inorg Chem. 2002;41:3728–3739. doi: 10.1021/ic020248k. [DOI] [PubMed] [Google Scholar]
- 22.Patra AK, Rose MJ, Murphy KM, Olmstead MM, Mascharak PK. Inorg Chem. 2004;43:4487–4495. doi: 10.1021/ic040030t. [DOI] [PubMed] [Google Scholar]
- 23.Sizova OV, Ivanova NV, Sizov VV, Nikol'skii AB. Russ J Gen Chem. 2004;74:481–485. [Google Scholar]
- 24.Rose MJ, Mascharak PK. Inorg Chem. 2009;48:6904–6917. doi: 10.1021/ic900899j. [DOI] [PubMed] [Google Scholar]
- 25.(a) Carlos RM, Cardoso DR, Castellano EE, Osti RZ, Camargo AJ, Macedo LG, Franco DW. J Am Chem Soc. 2004;126:2546–2555. doi: 10.1021/ja0373263. [DOI] [PubMed] [Google Scholar]; (b) Lang DR, Davis JA, Lopes LGF, Ferro AA, Vasconcellos LCG, Franco DW, Tfouni E, Wieraszko A, Clarke MJ. Inorg Chem. 2000;39:2294–3000. doi: 10.1021/ic9912979. [DOI] [PubMed] [Google Scholar]; (c) Borges S da SS, Davanzo CU, Castellano EE, Z-Schpector J, Silva SC, Franco DW. Inorg Chem. 1998;37:2670–2677. doi: 10.1021/ic951563s. [DOI] [PubMed] [Google Scholar]; (d) Allen AD, Bottomley F, Harris RD, Reinslau VP, Senoff CV. Inorg Synth. 1970;12:2–11. [Google Scholar]
- 26.(a) Patra AK, Olmstead MM, Mascharak PK. Inorg Chem. 2003;42:7363–7365. doi: 10.1021/ic030110h. [DOI] [PubMed] [Google Scholar]; (b) Ko P, Chen T, Zhu J, Cheng K, Peng S, Che C. J Chem Soc Dalton Trans. 1995;1:215–2219. [Google Scholar]; (c) Pipes DW, Meyer TJ. Inorg Chem. 1984;23:2466–2472. [Google Scholar]
- 27.(a) Leung W, Chan EYY, Chow EKF, Williams ID, Peng S. J Chem Soc Dalton Trans. 1996;15:1229–1236. [Google Scholar]; (b) Odenkirk W, Rheingold AL, Bosnich B. J Am Chem Soc. 1992;114:6392–6398. [Google Scholar]
- 28.(a) Rose MJ, Patra AK, Alcid EA, Olmstead MM, Mascharak PK. Inorg Chem. 2007;46:2328–2338. doi: 10.1021/ic0620945. [DOI] [PubMed] [Google Scholar]; (b) Rose MJ, Olmstead MM, Mascharak PK. Polyhedron. 2007;26:4713–4718. [Google Scholar]
- 29.Barnes DJ, Chapman RL, Vagg RS, Watton EC. J Chem Eng Data. 1978;23:349–350. [Google Scholar]
- 30.Keramidas AD, Papaioannou AB, Vlahos A, Kabanos TA, Bonas G, Makriyannis A, Rapropoulou Terzis A. Inorg Chem. 1996;35:357–367. doi: 10.1021/ic9503803. [DOI] [PubMed] [Google Scholar]
- 31.Hanson GR, Kabanos TA, Keramidas AD, Mentzafos D, Terzis A. Inorg Chem. 1992;31:2587–2594. [Google Scholar]
- 32.Nemukhin AV, Grigorenko BL, Granovsky AA. Moscow Univ Chem Bull. 2004;45:75. [Google Scholar]
- 33.Miertus S, Scrocco E, Tomasi J. Chem Phys. 1981;55:117–120. [Google Scholar]
- 34.Waller MP, Braun H, Hojdis N, Bühl M. J Chem Theory Comput. 2007;3:2234–2242. doi: 10.1021/ct700178y. [DOI] [PubMed] [Google Scholar]
- 35.Zhurko GA. ChemCraft Software Version 1.6. http://www.chemcraftprog.com.
- 36.Wang H, Hagihara T, Ikezawa H, Tomizawa H, Miki E. Inorg Chim Acta. 2000;299:80–90. [Google Scholar]
- 37.Nagao H, Enomoto K, Wakabayashi Y, Komiya G, Hirano T, Oi T. Inorg Chem. 2007;46:1431–1439. doi: 10.1021/ic061644w. [DOI] [PubMed] [Google Scholar]
- 38.(a) Bordini J, Hughes DL, Da Motta Neto JD, da Cunha JC. Inorg Chem. 2002;41:5410–5416. doi: 10.1021/ic011273d. [DOI] [PubMed] [Google Scholar]; (b) Sellmann D, Häuβinger D, Gottschalk-Gaudig T, Heinemann FW. Z Naturforsch. 2000;55b:723–729. [Google Scholar]
- 39.Nazeeruddin MK, De Angelis F, Fantacci S, Selloni A, Viscardi G, Liska P, Ito S, Takeru B, Grätzel M. J Am Chem Soc. 2005;127:16835–16847. doi: 10.1021/ja052467l. [DOI] [PubMed] [Google Scholar]
- 40.Greene SN, Richards GJ. Inorg Chem. 2004;43:7030–7041. doi: 10.1021/ic0499695. [DOI] [PubMed] [Google Scholar]
- 41.Karidi K, Garoufis A, Tsipis A, Hadjiliadis N, den Dulk H, Reedijk J. Dalton Trans. 2005:1176–1187. doi: 10.1039/b418838a. [DOI] [PubMed] [Google Scholar]
Associated Data
This section collects any data citations, data availability statements, or supplementary materials included in this article.