

Abstract
Context:
In hot environments, the American football uniform predisposes athletes to exertional heat exhaustion or exercise-induced hyperthermia at the threshold for heat stroke (rectal temperature [Tre] > 39°C).
Objective:
To evaluate the differential effects of 2 American football uniform configurations on exercise, thermal, cardiovascular, hematologic, and perceptual responses in a hot, humid environment.
Design:
Randomized controlled trial.
Setting:
Human Performance Laboratory.
Patients or Other Participants:
Ten men with more than 3 years of competitive experience as football linemen (age = 23.8 ± 4.3 years, height = 183.9 ± 6.3 cm, mass = 117.41 ± 12.59 kg, body fat = 30.1% ± 5.5%).
Intervention(s):
Participants completed 3 controlled exercise protocols consisting of repetitive box lifting (lifting, carrying, and depositing a 20.4-kg box at a rate of 10 lifts per minute for 10 minutes), seated recovery (10 minutes), and up to 60 minutes of treadmill walking. They wore one of the following: a partial uniform (PART) that included the National Football League (NFL) uniform without a helmet and shoulder pads; a full uniform (FULL) that included the full NFL uniform; or control clothing (CON) that included socks, sneakers, and shorts. Exercise, meals, and hydration status were controlled.
Main Outcome Measure(s):
We assessed sweat rate, Tre, heart rate, blood pressure, treadmill exercise time, perceptual measurements, plasma volume, plasma lactate, plasma glucose, plasma osmolality, body mass, and fat mass.
Results:
During 19 of 30 experiments, participants halted exercise as a result of volitional exhaustion. Mean sweat rate, Tre, heart rate, and treadmill exercise time during the CON condition were different from those measures during the PART (P range, .04–.001; d range, 0.42–0.92) and FULL (P range, .04–.003; d range, 1.04–1.17) conditions; no differences were detected for perceptual measurements, plasma volume, plasma lactate, plasma glucose, or plasma osmolality. Exhaustion occurred during the FULL and PART conditions at the same Tre (39.2°C). Systolic and diastolic blood pressures (n = 9) indicated that hypotension developed throughout exercise (all treatments). Compared with the PART condition, the FULL condition resulted in a faster rate of Tre increase (P < .001, d = 0.79), decreased treadmill exercise time (P = .005, d = 0.48), and fewer completed exercise bouts. Interestingly, Tre increase was correlated with lean body mass during the FULL condition (R2 = 0.71, P = .005), and treadmill exercise time was correlated with total fat mass during the CON (R2 = 0.90, P < .001) and PART (R2 = 0.69, P = .005) conditions.
Conclusions:
The FULL and PART conditions resulted in greater physiologic strain than the CON condition. These findings indicated that critical internal temperature and hypotension were concurrent with exhaustion during uncompensable (FULL) or nearly uncompensable (PART) heat stress and that anthropomorphic characteristics influenced heat storage and exercise time to exhaustion.
Keywords: heat tolerance, rectal temperature, heart rate, sweat rate, blood pressure
Key Points.
Physical characteristics, such as body fat percentage, influenced exercise time to exhaustion.
Lean body mass influenced the increase in rectal temperature.
Exercise in a full or partial uniform created greater physiologic strain than did exercise with no gear.
The protective equipment and clothing worn during an American football contest establish a microclimate above the skin surface that reduces heat dissipation to the environment via radiation, convection, and evaporation.1 From a thermoregulatory perspective, this microclimate may predispose an athlete to exertional heat exhaustion or exercise-induced hyperthermia. For example, the helmet and pads cover approximately 50% of the skin surface area, and other clothing covers an additional 20%. If a contest is played in a hot environment (>33°C), dry heat loss via radiation and convection is reduced because the thermal gradient from skin to air is small or negative; in addition, high humidity decreases evaporative skin cooling, because the air has a great water vapor content.1 Studies have shown that military2 and occupational3 uniforms are risk factors for the development of exertional heat exhaustion and exertional heat stroke (EHS)4; however, the athletic uniform is not commonly studied as a risk factor,5 although it was first acknowledged as such 40 years ago.6,7 Fox et al6 and Mathews et al7 observed that the football uniform acts as a barrier to heat loss and increased metabolic heat production by virtue of its weight, but they could not evaluate uncompensable heat stress (ie, heat stress in which internal body temperature rises without a plateau) because their experiments involved only 20 or 30 minutes of exercise, dry bulb air temperatures between 23°C and 26°C, and no control experiments (eg, wearing shorts to simulate no clothing).
Although 20 deaths due to EHS occurred during high school and collegiate practices between 2000 and 2007,8 few investigators have evaluated the human responses to wearing a football uniform while exercising. Because of this lack of research and because of the evolution of synthetic materials in uniforms, we know little about the physiologic and performance effects of wearing the modern uniform.9,10 Indeed, only 2 laboratory studies have provided information about this matter. In one study,11 the investigators sought to identify the environmental conditions at which uncompensable heat stress occurred; in the other study,9 the investigators evaluated the energy cost of a simulated football practice. We believe that because exercise intensity was not controlled in these studies the comparison of the different uniforms is difficult. The American College of Sports Medicine1 used these data to develop guidelines for wearing uniforms in hot environments but acknowledged that additional research was needed.
Because few investigators have focused on the football uniform,9 the purpose of our investigation was to evaluate the differential effects of 2 uniform configurations and control clothing on exercise, thermal, cardiovascular, hematologic, and perceptual responses in an environment with a temperature of 33.0°C and a relative humidity of 48% to 49%. We designed our study to include protective equipment that seals approximately 50% of the skin surface area; a hot, humid environment that reduces heat dissipation; and strenuous and prolonged exercise based on field research by Yeargin et al5 involving football uniforms. We hypothesized that physiologic strain would increase as the amount of clothing and equipment worn increased. Further, because test participants exercised to the point of exhaustion, this experimental design allowed assessment of the critical internal temperature hypothesis.12,13 This hypothesis states that humans exercising in the heat reach the point of fatigue at similar and consistent internal body temperatures when engaged in a variety of experimental protocols that involve uncompensable heat stress.14
METHODS
Participants
We chose 10 healthy men (age = 23.8 ± 4.3 years, height = 183.9 ± 6.3 cm, mass = 117.41 ± 12.59 kg, body fat = 30.1% ± 5.5%, skin surface area = 2.4 ± 0.10 m2, mass to surface area ratio = 48.4 ± 2.3 kg/m2) from a pool of potential participants if they had more than 3 years of high school or college football experience as linemen and were not highly trained or heat acclimatized. The participants were not playing football competitively at the time of this investigation. However, they were selected because their anthropomorphic characteristics were similar to those of offensive linemen, who usually are the players at greatest risk of hyperthermia as a result of their large subcutaneous adipose tissue mass and large heat-producing muscle mass. Participants were excluded from the study if they reported a history of EHS, recurring exercise-associated muscle cramps, exercise-heat intolerance, lower back or other current musculoskeletal injury, body mass less than 104.7 kg, age outside the range of 19 to 34 years, or syncope in the presence of needles or blood. They revealed all use of nutritional supplements, alcohol, drugs, medications, and stimulants during the 30 days before testing and during testing; these compounds were evaluated on the basis of their effects on exercise performance, thermoregulation, and fluid balance.
Participants could withdraw from testing at any time without repercussion or bias. They were paid for the preliminary laboratory visit and for each experiment, and they received a monetary bonus if they complied with all instructions and completed all testing. All participants gave written informed consent. This study was approved by the University of Connecticut's Institutional Review Board. Portions of the following methods and data are also presented in a companion paper.15
Familiarization Sessions
Participants reported to the Human Performance Laboratory at least 3 days before their first experimental test day. During this 1-hour preliminary visit, age, height, and mass were recorded. Investigators also determined the uniform size for each participant. The clothing and equipment items (partial uniform [PART] that included the National Football League [NFL] uniform without a helmet and shoulder pads; a full uniform [FULL] that included the full NFL uniform; or control clothing [CON]) that participants wore during each of the 3 experimental conditions are described in Table 1.
Table 1.
Clothing and Equipment Items Worn During Exercise in a 33°C Environment

Participants were instructed in safe box-lifting techniques and practiced these movements. While dressed in the FULL condition, all participants completed a truncated version (20 minutes) of the exercise protocol in an environmental chamber (model 2000; Minus-Eleven Inc, Malden, MA) maintained at 23°C. This version included 5 minutes of repetitive box lifting (RBL) at the experimental pace, 5 minutes of seated recovery, and 10 minutes of treadmill (Precor, Woodinville, VA) walking while wearing all measurement instruments that would be worn during experiments. No blood was collected. Participants also practiced the 4 subjective rating scales of perception before and during exercise.
We gave the participants several instructions for preparing for the test sessions: (1) perform only light exercise during the 24 hours before each experiment; (2) consume a normal diet during the 24 hours before each experiment to reduce the effects of different nutrient intake on exercise performance; (3) keep a 24-hour food and fluid diary before the first experimental test session and replicate this diet (including fluids) before the subsequent 2 experiments; and (4) consume 592 mL (20 oz) of water before going to bed the night before testing, as well as 592 mL of water on the morning of testing, to aid in achieving euhydration.
Experimental Protocol
Three experiments were completed in a controlled, randomized, counterbalanced order and differed only in the uniform worn (CON, PART, FULL). Each participant performed 3 laboratory trials of approximately 80 minutes, with a minimum of 3 days and a maximum of 7 days between experiments. The exercise protocol consisted of 10 minutes of RBL, 10 minutes of seated recovery, and up to 60 minutes of treadmill walking. The RBL task consisted of lifting a 20.4-kg (45-lb) metal box with handles, walking 2.4 m, and placing the box on a platform elevated 1.32 m above the floor. An investigator (E.C.J.) slid a second, identical box down a ramp from the platform to the starting position as the participant carried the first box to the platform. Each participant received a minute-by-minute countdown and feedback regarding pace (M.S.G.); the rate of box lifting was 10 lifts per minute for all trials. At the end of the RBL task, the 10-minute seated recovery began. Finally, participants walked briskly on a treadmill (5.6 km/h, 5% grade) until they reached either 60 minutes or one of the following termination criteria: signs and symptoms of heat illness (nausea, mental disorientation, lack of coordination, dizziness), election to stop volitionally when exhausted, or a rectal temperature (Tre) equal to or greater than 40°C.
Participants also completed 4 subjective rating scales of perception before exercise, during exercise, and postexercise. Thirst was rated on a 9-point scale ranging from 1 (not thirsty at all) to 9 (very, very thirsty).16 Thermal sensations were rated using a 17-point scale ranging from 0 (unbearably cold) to 8 (unbearably hot) in 0.5-point intervals.17 Ratings of perceived exertion were obtained using the 15-point scale developed by Borg.18 Pain was rated using a 12-point scale ranging from 0 (no pain at all) to 10 (extremely intense pain, almost unbearable).19 Within these points, participants could also choose 0.5 (very faint pain [just noticeable]); in addition to these points, participants could use an extra point of their choice if they needed to rate their pain as greater than 10. For example, if the participant perceived the pain to be twice as intense as a 10, he would respond with the subjective rating of 20.
Pre-exercise
On the morning of each experiment, participants consumed 592 mL of water but did not eat until they consumed a controlled meal (1 whole-wheat bagel, 1 oz [28 g] of cream cheese, 250 mL of water, and 2 medium bananas) at the Human Performance Laboratory. Participants were allowed to relax and stretch for 1 hour after eating to allow for gastric emptying and food digestion.
Before the beginning of each experimental test session, body mass to within 50 g was measured on a digital scale (model BWB-800A; Tanita Corporation, Tokyo, Japan). Participants inserted a rectal thermistor (model 401; Yellow Springs Instruments, Yellow Springs, OH) 10 cm past the anal sphincter. A small urine sample was collected to assess hydration status via specific gravity. Participants were not tested if they were dehydrated (urine specific gravity > 1.028) or had a fever (first Tre reading > 37.8°C).
Participants entered and stood in the environmental chamber (33°C, 48%–49% relative humidity) for 10 minutes to become acclimated. Next, participants rated their perceptions, and we measured heart rate (beats/min) via telemetry (Polar Electro, Port Washington, NY), Tre via the rectal thermister, blood pressure using an aneroid sphygmomanometer and stethoscope (n = 9),a forearm and posterior neck skin temperatures with an infrared temperature scanner (Ototemp HTTS-3000; Exergen Corporation, Watertown, MA) placed against the skin, and relative humidity inside the uniform. To measure relative humidity, we placed a wand sensor (Digi-Sense Humidity Meter; Cole-Parmer Instrument Company, Vernon Hills, IL) under the jersey and T-shirt of the participant and in the lumbar region of the lower back without making contact with the skin. The humidity meter had a resolution of 0.1% and an accuracy of ±2% relative humidity. A 7-mL blood sample was drawn from an antecubital vein by a trained phlebotomist (M.S.G.) using sterile technique. Blood was analyzed for hematocrit in triplicate with a microhematocrit centrifuge (model IEC MB centrifuge; Daemon/IEC Division, Needham Heights, MA), hemoglobin in duplicate (model Hb 201+; HemoCue, Ăngelholm, Sweden), blood glucose and lactate in duplicate (model YSI 2300; Stat Plus, Yellow Springs, OH), and plasma osmolality in duplicate using freezing-point depression (model 3250; Advanced Instruments, Inc, Needham Heights, MA).
Trial
After acclimation in the environmental chamber, participants began the experimental trial. After 5 minutes of RBL and at the completion of RBL, relative humidity inside the uniform was measured. At the completion of the RBL task, the pre-exercise measurements were repeated, and participants rated their perceptions. Heart rate and Tre were monitored every 5 minutes during exercise to ensure test participant safety. We measured forearm and posterior neck skin temperature before treadmill walking and every 5 minutes during treadmill walking until exhaustion or completion of the protocol. Total exercise time was measured to the nearest 1 second with a chronograph (IRONMAN Triathlon; Timex, Middlebury, CT). Participants consumed no fluid during laboratory experiments.
Postexercise
Immediately after treadmill walking ended, we measured heart rate, blood pressure (n = 9), Tre, skin temperatures, and relative humidity inside the uniform, and participants rated their perceptions. We also drew another 7-mL blood sample and analyzed it in the same manner used for analysis of the pre-exercise sample. Plasma volume change from pre-exercise to postexercise was calculated using the method of Dill and Costill.20
Next, participants left the environmental chamber, and after removing their equipment and uniforms, body mass was recorded. The postexercise body mass was subtracted from the pre-exercise value to determine mean whole-body sweat rate, corrected when necessary for urine and fecal excretion.
Finally, participants sat quietly and drank water ad libitum. During recovery, Tre was monitored to ensure that thermoregulation returned to normal. Before leaving the Human Performance Laboratory, participants were advised to drink at least 150% of the water weight that they had lost, preferably combined with a meal, to encourage their return to a euhydrated state during the next 24 hours. Within 14 days of completing experimental trials, dual-energy x-ray absorptiometry (DEXA) (Prodigy; Lunar Corporation, Madison, WI) was used to determine body fat percentage, total fat mass, fat-free mass, and lean body mass.
Statistical Analyses
An a priori power analysis was performed to determine the adequacy of sample size. Because the statistical variance of each outcome variable was different, it was impossible to justify sample size on the basis of a power analysis of all variables. Thus, we elected to use Tre as the critical variable because of its importance in participant safety. A minimum sample of 8 participants was identified for a 2-tailed statistical test with an α level of .05 and with a desired minimum power of 0.8. In consideration of this calculation, we conservatively enrolled 10 participants.
Treatment effects were evaluated using a randomized, crossover design. All data were statistically analyzed using a 2-way repeated-measures (uniform × time) analysis of variance (ANOVA) and are reported as mean ± SD. When we found differences, we used the Newman-Keuls test for post hoc analysis. The magnitude of observed effects (ie, effect size) was calculated via the formula d = (mean1 − mean2/σ), where mean1 refers to the mean of the experimental group, mean2 is the mean of the control group (or second experimental group), and σ refers to the pooled SD (ie, the average of the SDs of the 2 groups). Bonferroni corrections with post hoc t tests were used to determine pairwise differences among uniform type and time. A 2-tailed, paired t test was used to evaluate differences between the means of variables measured only pre-exercise and postexercise.
To evaluate relationships between key outcome variables and each participant's personal characteristics, linear regression analysis was performed to analyze 2 different relationships: Tre increase versus lean body mass (kg) and treadmill exercise time versus total fat mass (kg). Other variables, including skin surface area (m2), age, height, and body mass, were compared with Tre and treadmill exercise time via linear regression analysis. The α level was set at .05. We used Statistica (version 5.5; StatSoft Inc, Tulsa, OK) to analyze the data.
RESULTS
The environmental conditions during all laboratory experiments were not different for air temperature (CON = 33.0 ± 0.7°C, PART = 33.1 ± 0.8°C, FULL = 33.0 ± 0.7°C) (F2,100 = 0.50, P = .68) and relative humidity (CON = 48.7% ± 5.5%, PART = 49.4% ± 5.3%, FULL = 48.0% ± 5.9%) (F2,87 = 0.28, P = .85). The entering body mass (CON = 114.87 ± 8.48 kg, PART = 114.78 ± 8.54 kg, FULL = 115.65 ± 8.47 kg) (F2,27 = 0.03, P = .97) and urine specific gravity (CON = 1.015 ± 0.008, PART = 1.018 ± 0.007, FULL = 1.016 ± 0.007) (F2,24 = 0.36, P = .70) of participants were not different across days, indicating that they entered all uniform experiments in a similar state of hydration. Food intake and activity during the 24 hours before experiments were consistent across treatments.
The relative humidity near the skin surface varied among the 3 uniform conditions. The relative humidity for the CON condition was 47% ± 4% throughout the entire experiment; the relative humidity for the PART condition ranged from 75% ± 9% to 89% ± 4%; and the relative humidity for the FULL condition ranged from 69% ± 11% to 90% ± 5%. Although the relative humidity values for the PART and FULL conditions were not different throughout the experiment (F2,22 = 0.028, P = .9), the CON condition was different from the PART and FULL conditions at all time points (F2,27 range, 20.6–223.4; P < .001).
Exercise Time and Perceptual Ratings
All participants completed at least 15 minutes of treadmill exercise. However, the CON, PART, and FULL conditions induced different physiologic strains, resulting in a different number of participants completing 60 minutes of treadmill exercise. Seven participants completed the entire 80-minute protocol in the CON condition, 3 in the PART condition, and 1 in the FULL condition (Table 2). Investigators did not need to stop exercise for any participant, because no participant reached the predetermined Tre or heart rate safety limits; instead, physical exhaustion caused participants to prematurely terminate experiments. As an indicator of exercise-heat tolerance, Figure 1 presents the time to exhaustion for the CON, PART, and FULL conditions.
Table 2.
Number of Participants Completing Exercise at Each Phase of the Protocol

Figure 1.
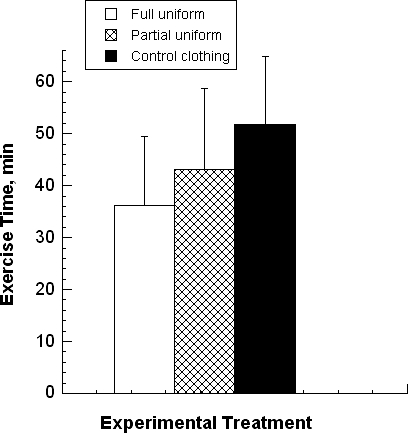
Treadmill exercise time (mean ± SD) while wearing 3 clothing types (N = 10). The full uniform condition was less than the control clothing condition (P = .002, d = 1.17). The partial uniform condition was less than the control clothing condition (P < .01, d = 0.59) and greater than the full uniform condition (P = .04, d = 0.48).
We found a main effect for time. All perceptual measurements (ie, rating of perceived exertion, thermal sensation, thirst, pain intensity) increased from the beginning of RBL to the end of treadmill exercise (F1,7 range, 9.6–292.5; P range, .001–.02). At the point of exhaustion, no between-treatments differences were observed for thermal sensation, thirst, or pain intensity (F1,7 range, 0.8–2.7; P range, .14–.40). However, at the point of exhaustion, we found a main effect for rating of perceived exertion (F2,9 = 5.93, P = .007). The rating of perceived exertion was greater for both the PART (17 ± 2; F1,9 = 11.7, P = .001) and FULL (18 ± 1; F1,8 = 14.8, P = .005) conditions than for the CON condition (15 ± 3). No differences were detected between the PART and FULL conditions for any perceptual measurement at any time point.
Thermal Variables
Skin temperature was measured in all experiments. A main effect of uniform type was detected at the end of treadmill exercise for skin temperatures at the back of the neck (F2,14 = 18.74, P = .001) and the forearm (F2,14 = 6.47, P = .01). On the back of the neck, the skin temperature was greater for both the FULL (35.6 ± 1.0°C; P < .001) and PART (35.3 ± 1.0°C; P = .001) conditions than for the CON (34.5 ± 1.1°C) condition. On the forearm, the skin temperature was greater for the FULL (35.2 ± 0.6°C) than for the CON condition (34.5 ± 1.0°C; P = .027).
Mean whole-body sweat rate (pre-exercise versus postexercise) was lowest during the CON condition (1.24 ± 0.16 L/h). This value was different from the PART (1.86 ± 0.25 L/h; P < .001) and FULL (2.05 ± 0.34 L/h; P < .001) conditions, but the sweat rates for the PART and FULL conditions were not different (P = .114). The total sweat loss values during experiments, expressed as a percentage of body mass, were small (CON = −1.0%, PART = −2.0%, FULL = −2.0%) and likely had only a small physiologic impact on treadmill exercise time.
Figure 2 depicts Tre responses during the entire experimental protocol. As the exercise protocol progressed, different amounts of heat were stored in body tissues. Participants began RBL with similar Tre: CON = 37.2 ± 0.1°C, PART = 37.2 ± 0.1°C, and FULL = 37.2 ± 0.1°C. At the end of treadmill exercise, participants experienced similar elevated final Tre when wearing a uniform (PART = 39.17 ± 0.6°C, FULL = 39.15 ± 0.5°C). These final Tre values tended to be lower for the CON condition (38.7 ± 0.5°C) than for the PART (P = .07, d = 0.86) and FULL (P = .07, d = 1.04) conditions (Figure 2). Thus, elevated Tre coincided with earlier exhaustion in the FULL and PART conditions compared with the CON condition (Figures 1 and 2). However, because the starting Tre was similar in all conditions, linear regression analysis showed that the initial Tre (pre-RBL) was not correlated with total exercise time for the CON (R2 = 0.02, P = .68), PART (R2 = 0.01, P = .78), and FULL (R2 = 0.012, P = .76) conditions.
Figure 2.
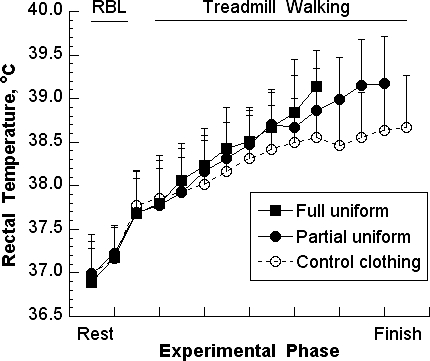
Rectal temperature responses (mean ± SD) during repetitive box lifting (RBL), recovery, and treadmill exercise while wearing 3 different clothing types. Data points depict only those segments with 5 or more participants.
Table 3 shows the change of Tre. The duration of total heat exposure was different for each uniform type; therefore, the rate of Tre increase, normalized on the basis of total exposure time (ie, minutes of rest and exercise), is provided.
Table 3.
Rectal Temperature Increase and Rate of Increase During the Entire Exercise-Heat Protocol (Mean ± SD), N = 10a

Table 4 describes the rate of Tre increase during treadmill exercise only; the sizes of uniform effects were large (CON versus FULL, d = 1.10; PART versus FULL, d = 0.79). Note that the mean duration of treadmill exercise was different for each uniform type (Figure 1).
Table 4.
Rate of Rectal Temperature Increase During Treadmill Exercise (Mean ± SD), N = 10

The relationship between Tre increase (entire exercise-heat protocol) and lean body mass was strongly correlated during the FULL condition (R2 = 0.71, P = .002), indicating that the Tre increased in proportion to lean body mass, but it was not strongly correlated during the PART (R2 = 0.25, P = .15) or CON (R2 = 0.01, P = .95) conditions (Figure 3). Total fat mass, measured via DEXA scan, was strongly negatively correlated with treadmill exercise time during the CON (R2 = −0.90, P < .001) and PART (R2 = −0.69, P = .003) conditions but not during the FULL condition (R2 = −0.36, P = .07) (Figure 4; n = 10). Skin surface area was positively correlated with treadmill exercise time for the CON (R2 = 0.61, P = .008), PART (R2 = 0.73, P = .002), and FULL (R2 = 0.55, P = .014) conditions. However, age, height, and body mass were not significantly correlated with Tre or treadmill exercise time.
Figure 3.
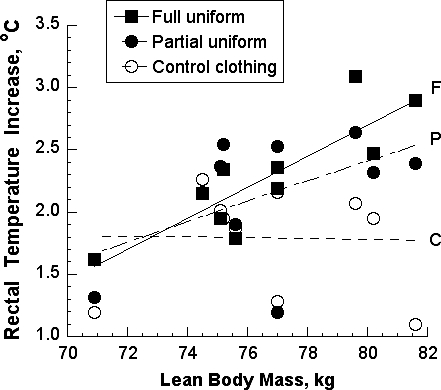
Relationship between rectal temperature increase during the entire exercise-heat exposure and lean body mass. Linear regression analyses indicated that these variables were correlated during the full uniform condition (R2 = 0.71, P = .002), but these variables were not correlated during the partial uniform (R2 = 0.25, P = .15) and control clothing (R2 = 0.01, P = .95) conditions. C indicates control clothing condition; F, full uniform condition; P, partial uniform condition.
Figure 4.
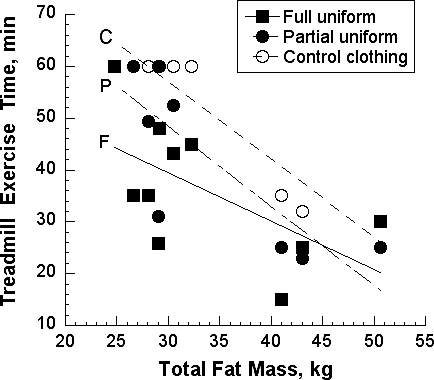
Relationship between exercise time to exhaustion during treadmill exercise and total fat mass. Linear regression analyses identified strong negative correlations for the control clothing condition (R2 = −0.90, P < .001) and the partial uniform condition (R2 = −0.69, P = .003) but not the full uniform condition (R2 = −0.36, P = .07). C indicates control clothing condition; F, full uniform condition; P, partial uniform condition.
Cardiovascular and Hematologic Responses
Heart rate provides an index of the degree of circulatory strain during exercise. Figure 5 depicts the mean heart rates during RBL, seated recovery, and treadmill walking for all uniform conditions. Although these values tended to be lowest during CON and highest during FULL, heart rate was not different (between uniforms) during the first 30 minutes of treadmill exercise as a result of large SDs (Figure 5). However, at the 40th minute of exercise, heart rate for both the PART (171 ± 9; P = .04, d = 1.27) and FULL (181 ± 9; P = .003, d = 1.99) conditions was greater than for the CON condition (156 ± 14). The final heart rate represented the point of exhaustion, a different exercise duration for each uniform condition, and near-maximal heart rates. The final heart rate was less for the CON condition (164 ± 14 beats/min) than for the PART (178 ± 8 beats/min; P = .012, d = 0.92) or FULL (180 ± 13 beats/min; P = .04, d = 1.41) conditions; the PART and FULL conditions were not different at any time point.
Figure 5.
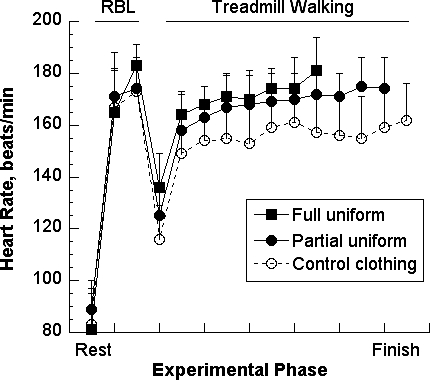
Heart rate responses (mean ± SD) during repetitive box lifting (RBL), recovery, and treadmill walking while wearing 3 clothing types (N = 10). Statistical significance is described in the “Results” section. Data points depict only those segments with 5 or more participants.
Table 5 presents systolic and diastolic blood pressures for the 3 phases of the experimental protocol. The ANOVA detected a main effect of time for systolic (F2,48 = 15.80, P < .001) and diastolic (F2,48 = 11.70, P < .001) pressures. Although the between-uniforms blood pressure comparisons were not different for diastolic (F2,24 = 2.12, P = .14) pressure, a between-uniforms trend was detected for systolic pressure (main effect, F2,24 = 2.71, P = .09).
Table 5.
Systolic and Diastolic Blood Pressures (mm Hg) at 3 Time Points (Mean ± SD), N = 9

When the hematologic factors were analyzed in samples collected pre-RBL and immediately after the end of treadmill walking, we found no between-uniforms differences for plasma lactate, glucose, or osmolality or for percentage change in plasma volume (Table 6).
Table 6.
Hematologic Factors Measured Before and Postexercise (Mean ± SD), N = 10a

DISCUSSION
We evaluated the differential effects of 2 football uniform configurations and control clothing on thermal, cardiovascular, hematologic, and perceptual responses during an 80-minute exercise protocol in a hot environment. Although some researchers6,7,9,11 have evaluated football uniforms, their experimental protocols make interpretation of data and comparison of uniform components difficult. Two laboratory studies have provided information about this matter. In one study,11 investigators observed 8 college-aged men while they walked on a motor-driven treadmill at 35% of their maximal aerobic power (V̇o2max). Using numerous combinations of air temperature (range, 29°C–39°C) and relative humidity (range, 15%–65%), the investigators sought to identify the environmental conditions at which uncompensable heat stress occurred (ie, esophageal temperature did not reach a plateau during constant-rate exercise). Their participants wore either practice uniforms or full game uniforms, and these uniforms were compared with control clothing from a previous study. The American College of Sports Medicine1 used these data to develop guidelines for wearing uniforms in hot environments, but they acknowledged that additional controlled experiments were needed.
In the other relevant laboratory study,9 investigators evaluated the energy cost of a simulated football practice (28°C, 55% relative humidity, 55% V̇o2max) involving 49.5 minutes of intermittent exercise plus 2 minutes of continuous running. Five offensive linemen participated and wore one of the following: shorts (control condition), partial uniforms, or full game uniforms. Interestingly, the results indicated that wearing a full uniform resulted in no differences, compared with other uniform types, for peak and change of gastrointestinal temperature (38.4°C maximum), heart rate, blood lactate and glucose concentrations, or rating of perceived exertion. The investigators9 stated that these unusual findings may have occurred because (1) their protocol involved only about one-half of an actual practice session performed by offensive linemen, (2) the participant sample size was small (N = 5), and (3) large interparticipant variability existed. We also believe that comparisons of the different uniforms were difficult because the environment was not harsh (28°C) and because exercise intensity was not controlled.
We are the first to evaluate different football uniform configurations in a harsh environment within a controlled, randomized, counterbalanced experimental design. Our primary findings were (1) reduced exercise time to exhaustion, (2) increased rate of Tre rise, and (3) a correlation between lean body mass and increase of Tre with the FULL condition but not with the PART or CON conditions. In addition, specific variables (1) indicated greater physiologic strain in the FULL condition compared with the PART condition and (2) provided evidence to support the critical internal temperature hypothesis.12,13
Physiologic Strain
Thermoregulatory, cardiovascular, hematologic, and perceptual variables of our investigation allowed evaluation of the strain induced by a football uniform. For example, Table 3 presents the mean Tre increase for the 3 experimental conditions. The mean starting temperatures and the mean absolute increases in the PART (2.36 ± 0.24°C) and FULL (2.37 ± 0.45°C) conditions were virtually identical. However, because the mean duration of exercise (Figure 1) and mean total heat exposure time (Table 3) were 7 to 8 minutes different, the rate of Tre rise was greatest in the FULL condition, intermediate in the PART condition, and least in the CON condition. As shown in Figure 2, the mean Tre values of uniform conditions were similar up to approximately the beginning of treadmill exercise, at which point these temperatures diverged. To evaluate this divergence, we isolated the rate of Tre rise during treadmill exercise and demonstrated that the FULL condition was greater than both the PART and CON conditions; the sizes of these between-uniforms effects were large (d = 0.79 and 1.10, respectively) (Table 4). Because Tre did not plateau before exercise ended (Figure 2), the FULL condition involved uncompensable heat stress.
The weight of a football uniform increases metabolic rate, which increases heat production, and its inherent insulation reduces heat dissipation to the surrounding air, which decreases heat loss. These dual properties lead to greater thermal and cardiovascular strain in hot environments.6,7,11,21 Our measurements of relative humidity near the skin surface at the lumbar region also showed that considerably greater water vapor pressure existed in the PART and FULL conditions compared with the CON condition, thereby reducing cooling via sweat evaporation.
Because certain anthropomorphic characteristics may predispose some football players to hyperthermia, it is reasonable to expect that a player with a large muscle mass or large body fat content will generate more heat than a smaller player when they run at the same speed. The relationship between lean body mass and Tre increase supports this concept (Figure 3). Linear regression analysis indicated that these 2 variables were correlated in the FULL condition (P = .005) but not in the PART or CON conditions. This occurred in part because the FULL condition involved uncompensable heat stress; the PART condition approached this state; and heat production during the CON condition was compensated by evaporative, convective, and radiative heat loss (Figure 2). Because the threshold for EHS is 39°C to 40°C,1 the data shown in Figure 3 indicate that football players with a large lean body mass, such as offensive linemen, are at greater risk of dangerous hyperthermia than are their smaller teammates (ie, defensive backs). This is especially true when team discipline or peer pressure encourages a player to push beyond the point at which he ordinarily would halt exercise. A hypothetical example of this situation can be envisioned in Figure 2 by extending the final data point of the FULL condition for an additional 4 measurement points. At that time, an athlete would experience hyperthermia with a Tre in excess of 40°C and possible EHS. However, this relationship between lean body mass (ie, measured via DEXA scan) and Tre does not exist when body mass per se (ie, measured via floor scale) is correlated with Tre.22
Figure 4 demonstrates that increased total fat mass was correlated with an earlier onset of exhaustion during the CON and PART conditions but not during the FULL condition. We interpret this to mean that the greater hyperthermia, cardiovascular strain, and skin blood flow during the FULL condition (Figures 2 and 5) altered this relationship, likely because of low skin blood flow. The research of Havenith and colleagues22,23 supports this interpretation of Figure 4. They reported22 that body fatness was significantly related to Tre in a cool environment (21°C, 50% relative humidity) but not in a warm, humid environment (35°C, 80% relative humidity) or a hot, dry environment (45°C, 20% relative humidity). They proposed that the insulative effect of fat was greater in the cool environment when skin blood flow was low than in the warm and hot environments when blood flow was greater. This likely occurred because the insulative fat layer was bypassed by blood vessels that were superficial to adipose tissue.23
As with Tre (Figure 2), the mean heart rates during the FULL and PART conditions were similar until the beginning of treadmill exercise, when they began to diverge (Figure 5). At the 40th minute of treadmill exercise, heart rates were greater for the PART (171 ± 9; P = .04, d = 1.27) and FULL (181 ± 9; P = .003, d = 1.99) conditions than for the CON condition (156 ± 14). The mean final heart rates (Figure 5) indicated considerable cardiovascular strain during the FULL (180 ± 13 beats/min; P = .04, d = 1.41) and PART (178 ± 8 beats/min; P = .012, d = 0.92) conditions compared with the CON condition (164 ± 14 beats/min).
Thus, Tre, heart rate, and systolic blood pressure presented a unified statement regarding the physiologic strain that resulted from wearing a football uniform. This physiologic strain, as hypothesized, increased as the amount of clothing and equipment increased (ie, strain was greater in the FULL condition than in the CON and PART conditions and was greater in the PART condition than in the CON condition). However, the relative influence of anthropomorphic characteristics on individual responses to heat stress may22,23 or may not24 be influenced by environmental conditions, exercise intensity, and exercise mode.
Exhaustion: Critical Internal Temperature
All participants performed the experimental protocol 3 times in a controlled hot environment in repeated-measures fashion and completed 10 minutes of RBL, 10 minutes of seated recovery, and at least 15 minutes of brisk treadmill walking (Table 2). However, after that point, the number of participants continuing treadmill exercise decreased during each consecutive 5-minute segment for all uniform conditions. Only 1 participant completed the entire prescribed 60 minutes of brisk treadmill walking in the FULL condition; in comparison, 3 participants completed the walking task in the PART condition, and 7 completed it in the CON condition (Table 2). Because no participant reached the predetermined safety limits for Tre or heart rate, exercise was terminated in all cases because of exhaustion.
Recently, the concept of a critical internal temperature has been proposed13,24 as a mechanism for volitional exhaustion that occurs during exercise in the heat. According to this hypothesis,25 high internal body temperature independently causes central fatigue during uncompensable heat stress. The data in Table 3 support this concept, because exhaustion occurred in the PART and FULL conditions at virtually the same mean increase of Tre. This means that physical exhaustion (ie, exercise cessation) occurred after the same amount of heat had been stored in the PART and FULL conditions. The data also indicate that the time to volitional exhaustion was influenced in the PART and FULL conditions (Figure 1) by the rate of Tre rise, because a greater rate of increase during the FULL condition coincided with a faster onset of exhaustion (Table 3). This observation is important, because the rate at which heat is stored in deep body tissues previously had been identified as an independent factor in the development of human exhaustion during prolonged cycling exercise14 and in the onset of exhaustion and collapse in hyperthermic rats performing treadmill exercise.26,27
The experiments of González-Alonso et al14 are especially relevant to our investigation. They evaluated the influence of internal body temperature on exhaustion under conditions of uncompensable heat stress. During 2 separate experiments, participants reached exhaustion during cycle ergometer exercise at an esophageal temperature that fell within the narrow range of 39.7°C to 40.9°C, regardless of the initial esophageal temperature (35.9°C versus 37.4°C) or the exercise duration (31 minutes versus 56 minutes). Exercise time to exhaustion was inversely related to the initial internal temperature. In our investigation, participants began RBL at the same Tre during all experiments (37.2°C) and exhibited similar Tre at the point of exhaustion in the PART (39.2 ± 0.6°C; range, 38.07–39.78°C) and FULL (39.2 ± 0.5°C; range, 38.41–39.92°C) conditions after 63 and 56 minutes, respectively, of total exercise-heat exposure. These Tre values for the PART and FULL conditions are greater than laboratory data published by Sawka et al24 involving males walking on a treadmill (5.6 km/h) while totally encapsulated in a protective military uniform (Mission Oriented Protective Posture IV) and carrying a 14.7-kg backpack. Exhaustion from heat strain occurred in 69% (33 of 48) of trials at a mean Tre of 38.8 ± 0.7°C. This encapsulation, which provided a greater stress than a football uniform provides, theoretically resulted in (1) elevated skin temperatures because limited cooling occurred, (2) peripheral displacement of blood, (3) reduced venous return to the heart and reduced cardiac output, (4) decreased exercise-heat tolerance, and (5) reduced Tre at the point of exhaustion.24 Indeed, the experiments of Montain et al28 demonstrated that encapsulation resulted in exhaustion at a lower Tre than equivalent controlled experiments involving no encapsulation.
In other experiments, González-Alonso et al14 reported that both high (0.11°C/min) and low (0.05°C/min) rates of esophageal temperature rise, which were controlled by wearing a water-perfused jacket, resulted in similar final internal body temperatures (cold-water perfusion, final esophageal temperature = 40.1°C; hot-water perfusion, final esophageal temperature = 40.3°C). The uniformed participants in our investigation also experienced different rates of Tre increase (PART = 0.052°C/min, FULL = 0.071°C/min) as a result of differences in insulation and uniform weight, but they experienced similar final mean Tre during the PART and FULL conditions (Table 4). Thus, despite considerably different exercise protocols (ie, cycling versus RBL and treadmill), body characteristics, and clothing, our findings and the findings of González-Alonso et al14 both support the hypothesis that uncompensable heat stress results in exhaustion when a critical internal temperature is reached. However, when compensated heat stress existed in our study because heat dissipation was nearly equal to or greater than heat production (Figures 2 and 3), the critical internal body temperature hypothesis was not supported.
In this subsection, we have emphasized the importance of considering the critical temperature hypothesis as a possible component of the clinical condition known as exertional heat exhaustion, which is the most common form of heat illness among athletes, laborers, and military personnel.1 The diagnosis of exertional heat exhaustion is difficult and is accomplished on the basis of patient history and exclusion of other possible diagnoses.26 In some athletes, severe exertional heat exhaustion also is difficult to distinguish from EHS because these illnesses share common signs and symptoms.29 Both conditions involve attainment of a critical internal temperature of 39°C to 40°C, which may or may not be evaluated in a field setting (Table 3; Figure 2).14 This 39°C to 40°C internal temperature is widely accepted1,30 as the threshold for the onset of EHS. Thus, we recommend that critical internal temperature henceforth be a part of the clinical diagnosis of exertional heat exhaustion when uncompensable heat stress exists, as in the PART and FULL conditions.
Exhaustion: Hypotension
Exertional heat exhaustion is defined as an inability to continue exercise in the heat and is diagnosed by excluding other likely illnesses because its exact mechanism has not been identified and because the symptoms vary from one individual to another.2,4,26 Most authorities1,2,4,26 implicate dehydration, reduced extracellular fluid volume, insufficient cardiac output to meet the simultaneous demands of perfusing muscle (for exercise) and skin (for heat dissipation), and loss of peripheral vascular resistance. However, our blood pressure data support the concept that hypotension also influenced exercise-induced exhaustion (Table 5). For example, mean diastolic but not systolic blood pressure fell, exhibiting a main effect of time (all treatments combined, P < .001) from pre-RBL to 10-minute RBL (Table 5). However, at the end of the treadmill exercise bout, both systolic and diastolic blood pressures indicated relative hypotension when compared with pre-RBL values (all treatments combined, P < .001). Furthermore, systolic blood pressures fell during upright treadmill walking (relative to the immediately post-RBL point), exhibiting a main effect of time (all treatments combined, P < .001). These diastolic pressure data suggest that (1) cardiac filling decreased (as a result of lower pressure during diastole) and (2) stroke volume decreased (Table 5). To maintain cardiac output, the mean final heart rates were necessarily high in the uniform experiments (CON = 164 ± 14 beats/min, FULL = 180 ± 13 beats/min, PART = 178 ± 8 beats/min), indicating great cardiovascular strain at the point of exhaustion (Figure 5).
Helmet and Shoulder Pads
The aforementioned differences between the PART and FULL conditions allow isolation of the contribution of the helmet plus shoulder pads to physiologic strain and exercise-heat tolerance. The following differences were observed: number of participants completing 60 minutes of treadmill exercise, exercise time to exhaustion, and rate of Tre rise. No other statistical comparison detected differences between the PART and FULL conditions. Paradoxically, measurements of thermal sensation, perceived exertion, and thirst at the point of exhaustion showed that athletes perceived no difference between PART and FULL conditions. This indicates that hyperthermic athletes may not be able to sense when deep internal body temperature reaches dangerous levels during training or competition. This finding is supported by the knowledge that few thermal sensory neurons lie in the deep tissues of the body.26
The hot weather participation guidelines of the National Athletic Trainers' Association30 and the American College of Sports Medicine1 recognize that football players typically wear 1 of 3 clothing configurations: (1) shorts, socks, and shoes; (2) shorts, socks, shoes, undershirt, jersey, shoulder pads, and helmet (practice uniform); and (3) shorts, socks, shoes, undershirt, jersey, shoulder pads, helmet, game pants, thigh pads, and knee pads (game uniform). Although the uniform ensembles we studied did not match these configurations, our data are relevant. Because the primary contribution of wearing a helmet plus shoulder pads versus a uniform without this gear was to increase the rate of heat storage and to reduce exercise-heat tolerance, our data support the practice of wearing no helmet and shoulder pads during the initial days of summer training.
CONCLUSIONS
We evaluated the differential effects of FULL and PART conditions versus CON condition on exercise, thermal, cardiovascular, hematologic, and perceptual responses in a hot environment (33°C, 48%–49% relative humidity). We provided information that may be directly applied to football, but the application of these principles may or may not apply to industrial or military uniforms or to different climates or exercise modes.22 As initially hypothesized, the FULL and PART conditions resulted in greater physiologic strain and shorter treadmill exercise times than the CON condition. Because final Tre and final heart rate were lower in the CON condition than in the PART and FULL conditions and because the rate of Tre increase was greater in the FULL condition than in the PART condition, these data support research findings5 and organizational guidelines1,30 that limit the use of a helmet and shoulder pads during the initial days of summer workouts to reduce the risk of EHS or exertional heat exhaustion. Considering every athlete's need for ample time to acclimatize in the heat, we see no justification for the traditional wearing of protective equipment during the initial 3 to 5 days of football summer workouts, when the highest incidence of exertional heat illness (eg, heat stroke and exertional heat exhaustion) occurs. Finally, the experiments in which participants reached exhaustion supported the existence of a critical internal temperature as part of the mechanism for exhaustion, but they only supported it when uncompensable (FULL condition) or nearly uncompensable (PART condition) heat stress exists. Blood pressure likely influenced exhaustion, because hypotension developed during exercise in the heat for all conditions. Thus, we recommend that critical internal temperature and hypotension henceforth become part of the clinical diagnosis of exertional heat exhaustion when uncompensable heat stress exists, as in these PART and FULL conditions.
Acknowledgments
We thank Elaine C. Lee, PhD, for assisting with statistical analysis. This study was funded by Waite, Schneider, Bayless & Chesley, LPA (Cincinnati, OH). This study comprised the 2008 master's degree thesis of Evan C. Johnson, MA.
Footnotes
Data for 1 participant were not collected because we did not have approval to collect blood pressure data from the institutional review board at that time. After that time, an amendment was approved, and we collected blood pressure data for all other participants.
REFERENCES
- 1.Armstrong L. E., Casa D. J., et al. American College of Sports Medicine. American College of Sports Medicine position stand: exertional heat illness during training and competition. Med Sci Sports Exerc. 2007;39(3):556–572. doi: 10.1249/MSS.0b013e31802fa199. [DOI] [PubMed] [Google Scholar]
- 2.Department of the Army and Air Force. Heat Stress Control and Heat Casualty Management. Washington, DC: Dept of Defense; 2003. Publication TB MED507/AFPAM 48-152 (I). http://www.army.mil/usapa/med/DR_pubs/dr_a/pdf/tbmed507.pdf. Accessed September 1, 2009. [Google Scholar]
- 3.Working in Hot Environments. Cincinnati, OH: National Institute for Occupational Safety and Health; 1986. Centers for Disease Control and Prevention, National Institute for Occupational Safety and Health. DHHS (NIOSH) publication 86-112. http://www.cdc.gov/niosh/hotenvt.html#sources. Accessed December 12, 2009. [Google Scholar]
- 4.Armstrong L. E., Anderson J. M. Heat exhaustion, exercise-associated collapse, and heat syncope. In: Armstrong L. E., editor. Exertional Heat Illnesses. Champaign, IL: Human Kinetics; 2003. pp. 57–89. [Google Scholar]
- 5.Yeargin S. W., Casa D. J., Armstrong L. E., et al. Heat acclimatization and hydration status of American football players during initial summer workouts. J Strength Cond Res. 2006;20(3):463–470. doi: 10.1519/20596.1. [DOI] [PubMed] [Google Scholar]
- 6.Fox E. L., Mathews D. K., Kaufman W. S., Bowers R. W. Effects of football equipment on thermal balance and energy cost during exercise. Res Q. 1966;37(3):332–339. [PubMed] [Google Scholar]
- 7.Mathews D. K., Fox E. L., Tanzi D. Physiological responses during exercise and recovery in a football uniform. J Appl Physiol. 1969;26(5):611–615. doi: 10.1152/jappl.1969.26.5.611. [DOI] [PubMed] [Google Scholar]
- 8.Mueller F. O., Cantu R. C. National Center for Catastrophic Sport Injury Research data tables: annual survey of football injury research 1931–2007. http://www.unc.edu/depts/nccsi/FootballInjuryData.htm. Accessed December 12, 2009.
- 9.Hitchcock K. M., Millard-Stafford M. L., Phillips J. M., Snow T. K. Metabolic and thermoregulatory responses to a simulated American football practice in the heat. J Strength Cond Res. 2007;21(3):710–717. doi: 10.1519/R-20916.1. [DOI] [PubMed] [Google Scholar]
- 10.Hoffman J. R., Maresh C. M., Newton R. U., et al. Performance, biochemical, and endocrine changes during a competitive football game. Med Sci Sports Exerc. 2002;34(11):1845–1853. doi: 10.1097/00005768-200211000-00023. [DOI] [PubMed] [Google Scholar]
- 11.Kulka T. J., Kenney W. L. Heat balance limits in football uniforms: how different uniform ensembles alter the equation. Physician Sportsmed. 2002;30(7):29–39. doi: 10.3810/psm.2002.07.377. [DOI] [PubMed] [Google Scholar]
- 12.Nielsen B., Hales J. R., Strange S., Christensen N. J., Warberg J., Saltin B. Human circulatory and thermoregulatory adaptations with heat acclimation and exercise in a hot, dry environment. J Physiol. 1993;460:467–485. doi: 10.1113/jphysiol.1993.sp019482. [DOI] [PMC free article] [PubMed] [Google Scholar]
- 13.Cheung S. S., Sleivert G. G. Multiple triggers for hyperthermic fatigue and exhaustion. Exerc Sport Sci Rev. 2004;32(3):100–106. doi: 10.1097/00003677-200407000-00005. [DOI] [PubMed] [Google Scholar]
- 14.González-Alonso J., Teller C., Andersen S. L., Jensen F. B., Hyldig T., Nielsen B. Influence of body temperature on the development of fatigue during prolonged exercise in the heat. J Appl Physiol. 1999;86(3):1032–1039. doi: 10.1152/jappl.1999.86.3.1032. [DOI] [PubMed] [Google Scholar]
- 15.Johnson E. C., Ganio M. S., Lee E. C., et al. Perceptual responses while wearing an American football uniform in the heat. J Athl Train. 2010;45(2):107–116. doi: 10.4085/1062-6050-45.2.107. [DOI] [PMC free article] [PubMed] [Google Scholar]
- 16.Engell D. B., Maller O., Sawka M. N., Francesconi R. N., Drolet L., Young A. J. Thirst and fluid intake following graded hypohydration levels in humans. Physiol Behav. 1987;40(2):229–236. doi: 10.1016/0031-9384(87)90212-5. [DOI] [PubMed] [Google Scholar]
- 17.Young A. J., Sawka M. N., Epstein Y., Decristofano B., Pandolf K. B. Cooling different body surfaces during upper and lower body exercise. J Appl Physiol. 1987;63(3):1218–1223. doi: 10.1152/jappl.1987.63.3.1218. [DOI] [PubMed] [Google Scholar]
- 18.Borg G. Perceived exertion as an indicator of somatic stress. Scand J Rehabil Med. 1970;2(2):92–98. [PubMed] [Google Scholar]
- 19.Cook D. B., O'Connor P. J., Eubanks S. A., Smith J. C., Lee M. Naturally occurring muscle pain during exercise: assessment and experimental evidence. Med Sci Sports Exerc. 1997;29(8):999–1012. doi: 10.1097/00005768-199708000-00004. [DOI] [PubMed] [Google Scholar]
- 20.Dill D. B., Costill D. L. Calculation of percentage changes in volumes of blood, plasma, and red cells in dehydration. J Appl Physiol. 1974;37(2):247–248. doi: 10.1152/jappl.1974.37.2.247. [DOI] [PubMed] [Google Scholar]
- 21.Bergeron M. F., McKeag D. B., Casa D. J., et al. Youth football: heat stress and injury risk. Med Sci Sports Exerc. 2005;37(8):1421–1430. doi: 10.1249/01.mss.0000174891.46893.82. [DOI] [PubMed] [Google Scholar]
- 22.Havenith G., Coenen J. M., Kistemaker L., Kenney W. L. Relevance of individual characteristics for human heat stress response is dependent on exercise intensity and climate type. Eur J Appl Physiol Occup Physiol. 1998;77(3):231–241. doi: 10.1007/s004210050327. [DOI] [PubMed] [Google Scholar]
- 23.Havenith G., van Middendorp H. The relative influence of physical fitness, acclimatization state, anthropometric measures and gender on individual reactions to heat stress. Eur J Appl Physiol Occup Physiol. 1990;61(5–6):419–427. doi: 10.1007/BF00236062. [DOI] [PubMed] [Google Scholar]
- 24.Sawka M. N., Latzka W. A., Montain S. J., et al. Physiologic tolerance to uncompensable heat: intermittent exercise, field vs laboratory. Med Sci Sports Exerc. 2001;33(3):422–430. doi: 10.1097/00005768-200103000-00014. [DOI] [PubMed] [Google Scholar]
- 25.Nielsen B. Heat stress causes fatigue! In: Marconnet P., Komi P. V., Saltin B., Sejersted O. M., editors. Muscle Fatigue Mechanisms in Exercise and Training: Proceedings of the 4th International Symposium on Exercise and Sport Biology, Nice, November 1–4, 1990. Basel, Switzerland: Karger; 1992; 207–217. Medicine and Sport Science; vol 34. [Google Scholar]
- 26.Hubbard R. W., Armstrong L. E. The heat illnesses: biochemical, ultrastructural and fluid-electrolyte considerations. In: Pandolf K. B., Sawka M. N., Gonzalez R. R., editors. Human Performance Physiology and Environmental Medicine at Terrestrial Extremes. Vol. 1988. Indianapolis, IN: Benchmark Press; pp. 305–359. [Google Scholar]
- 27.Hubbard R. W., Matthew C. B., Durkot M. J., Francesconi R. P. Novel approaches to the pathophysiology of heatstroke: the energy depletion model. Ann Emerg Med. 1987;16(9):1066–1075. doi: 10.1016/s0196-0644(87)80760-6. [DOI] [PubMed] [Google Scholar]
- 28.Montain S. J., Sawka M. N., Cadarette B. S., Quigley M. D., McKay J. M. Physiological tolerance to uncompensable heat stress: effects of exercise intensity, protective clothing, and climate. J Appl Physiol. 1994;77(1):216–222. doi: 10.1152/jappl.1994.77.1.216. [DOI] [PubMed] [Google Scholar]
- 29.Armstrong L. E., Lopez R. M. Return to exercise training after heat exhaustion. J Sport Rehabil. 2007;16(3):182–190. doi: 10.1123/jsr.16.3.182. [DOI] [PubMed] [Google Scholar]
- 30.Binkley H. M., Beckett J., Casa D. J., Kleiner D. M., Plummer P. E. National Athletic Trainers' Association position statement: exertional heat illnesses. J Athl Train. 2002;37(3):329–343. [PMC free article] [PubMed] [Google Scholar]